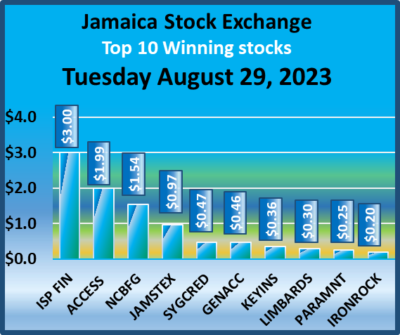
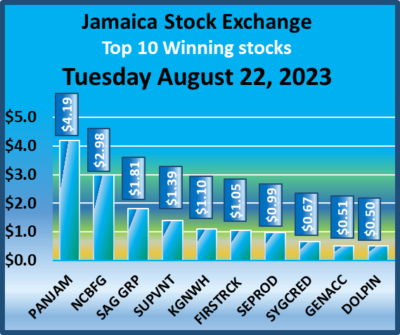
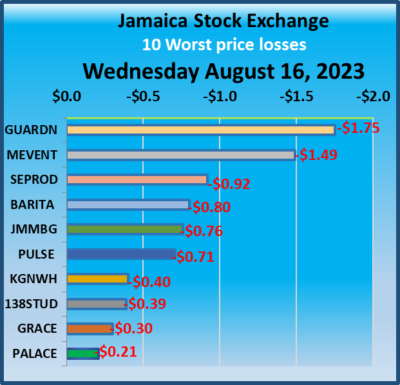
Trading surged on Tuesday on the Jamaica Stock Exchange compared with Monday after robust activity in Carreras, Jamaica Broilers, Stanley Motta in the Main Market and Dolphin Cove in the Junior Market and resulted in a jump in value and volume of stocks traded in all markets of the exchange compared with Monday.
 At the close, the JSE Combined Market Index rose 502.75 points to 331,355.08, the All Jamaican Composite Index rallied 1,999.27 points to 351,449.14, the JSE Main Index climbed 881.84 points to 317,871.56, the Junior Market Index dropped 34.97 points to settle at 3,797.20, while the JSE USD Market Index popped 1.09 points to end at 235.13.
Trading of Preference shares ended, with Jamaica Public Service 7% rallied $8.86 in closing at $58.86.
At the close, investors traded 23,495,915 shares in all three markets, down from 10,494,639 stocks on Monday. The value of stocks traded on the Junior and Main markets ended at $235 million, compared to $71.6 million on Monday. Trading on the JSE USD market ended with investors exchanging 593,068 shares for US$64,296, up from 884,498 units at US$16,456 on Monday.
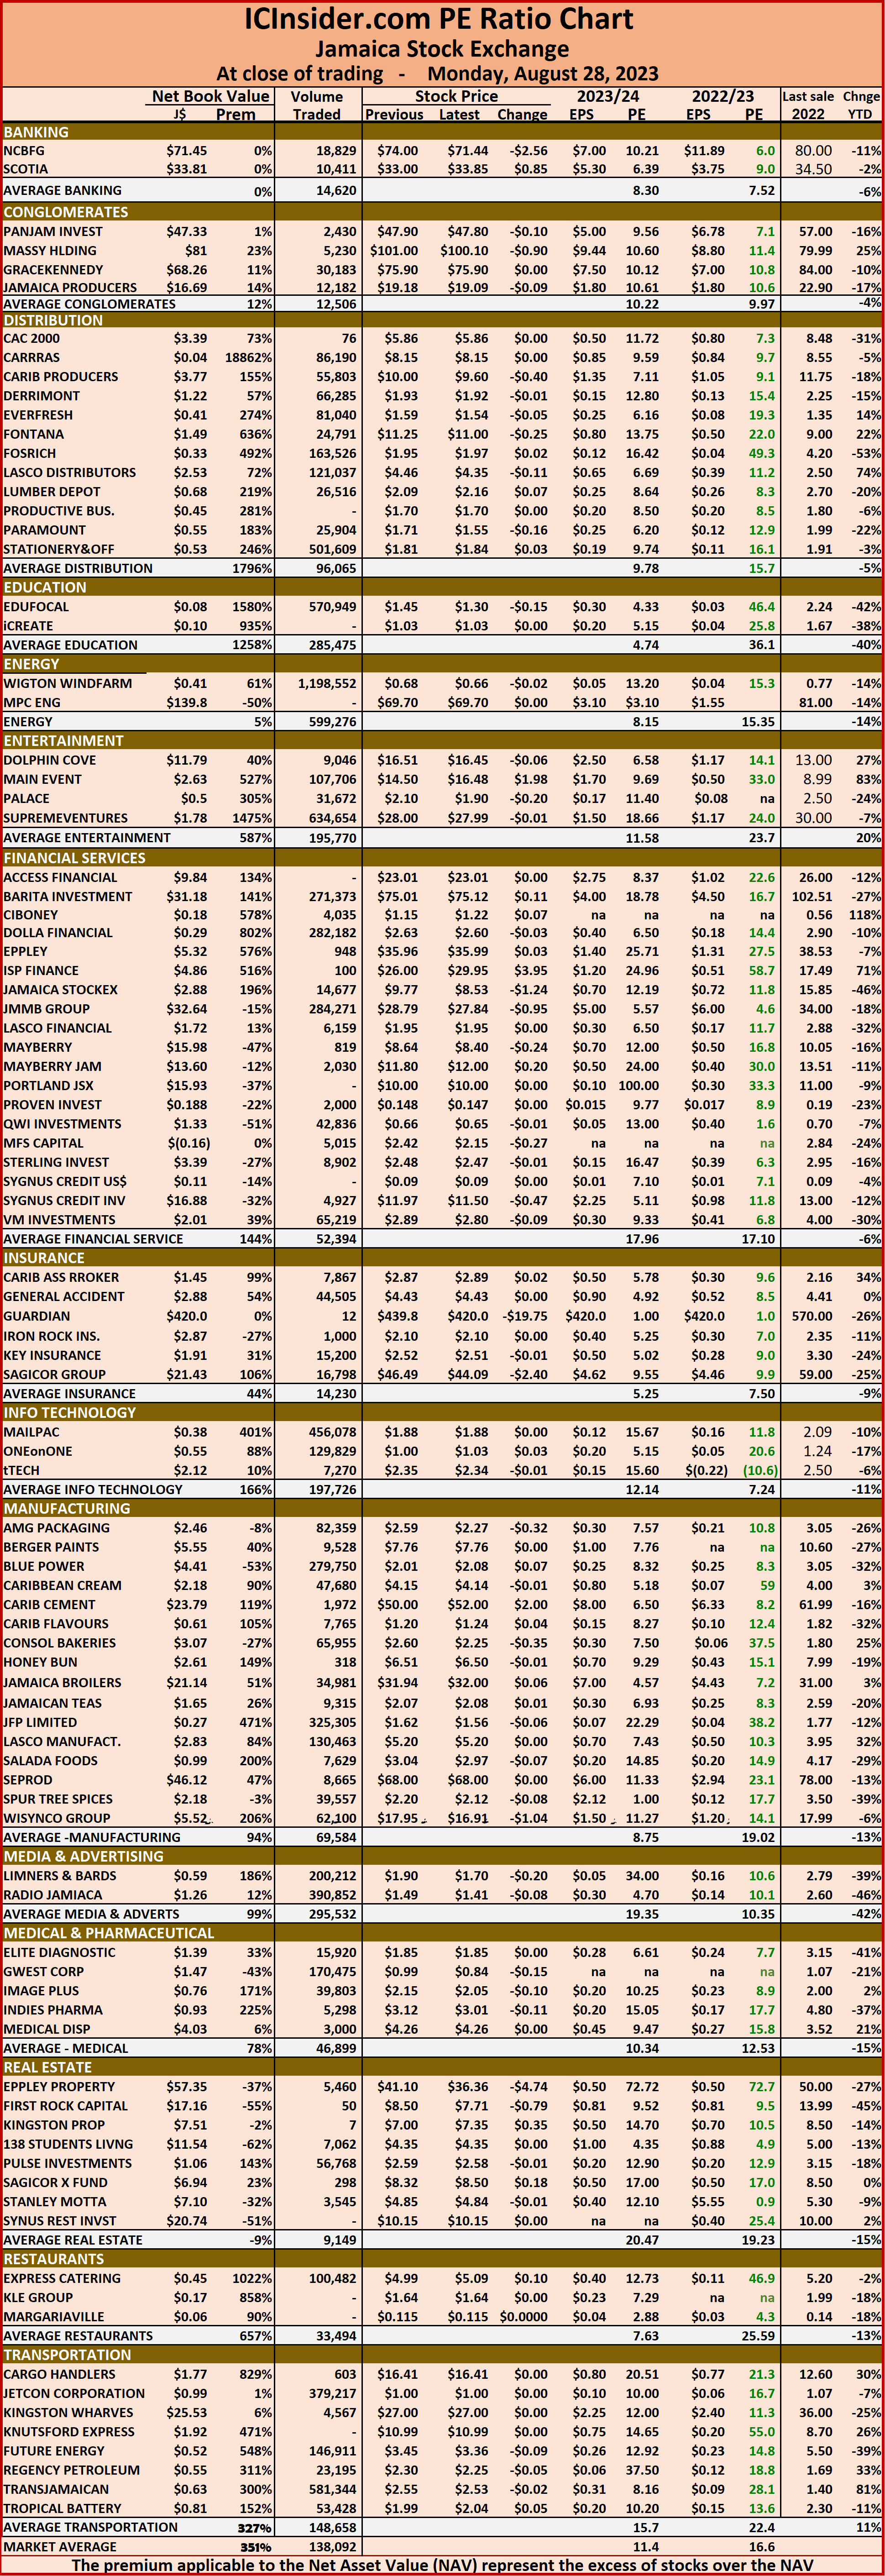
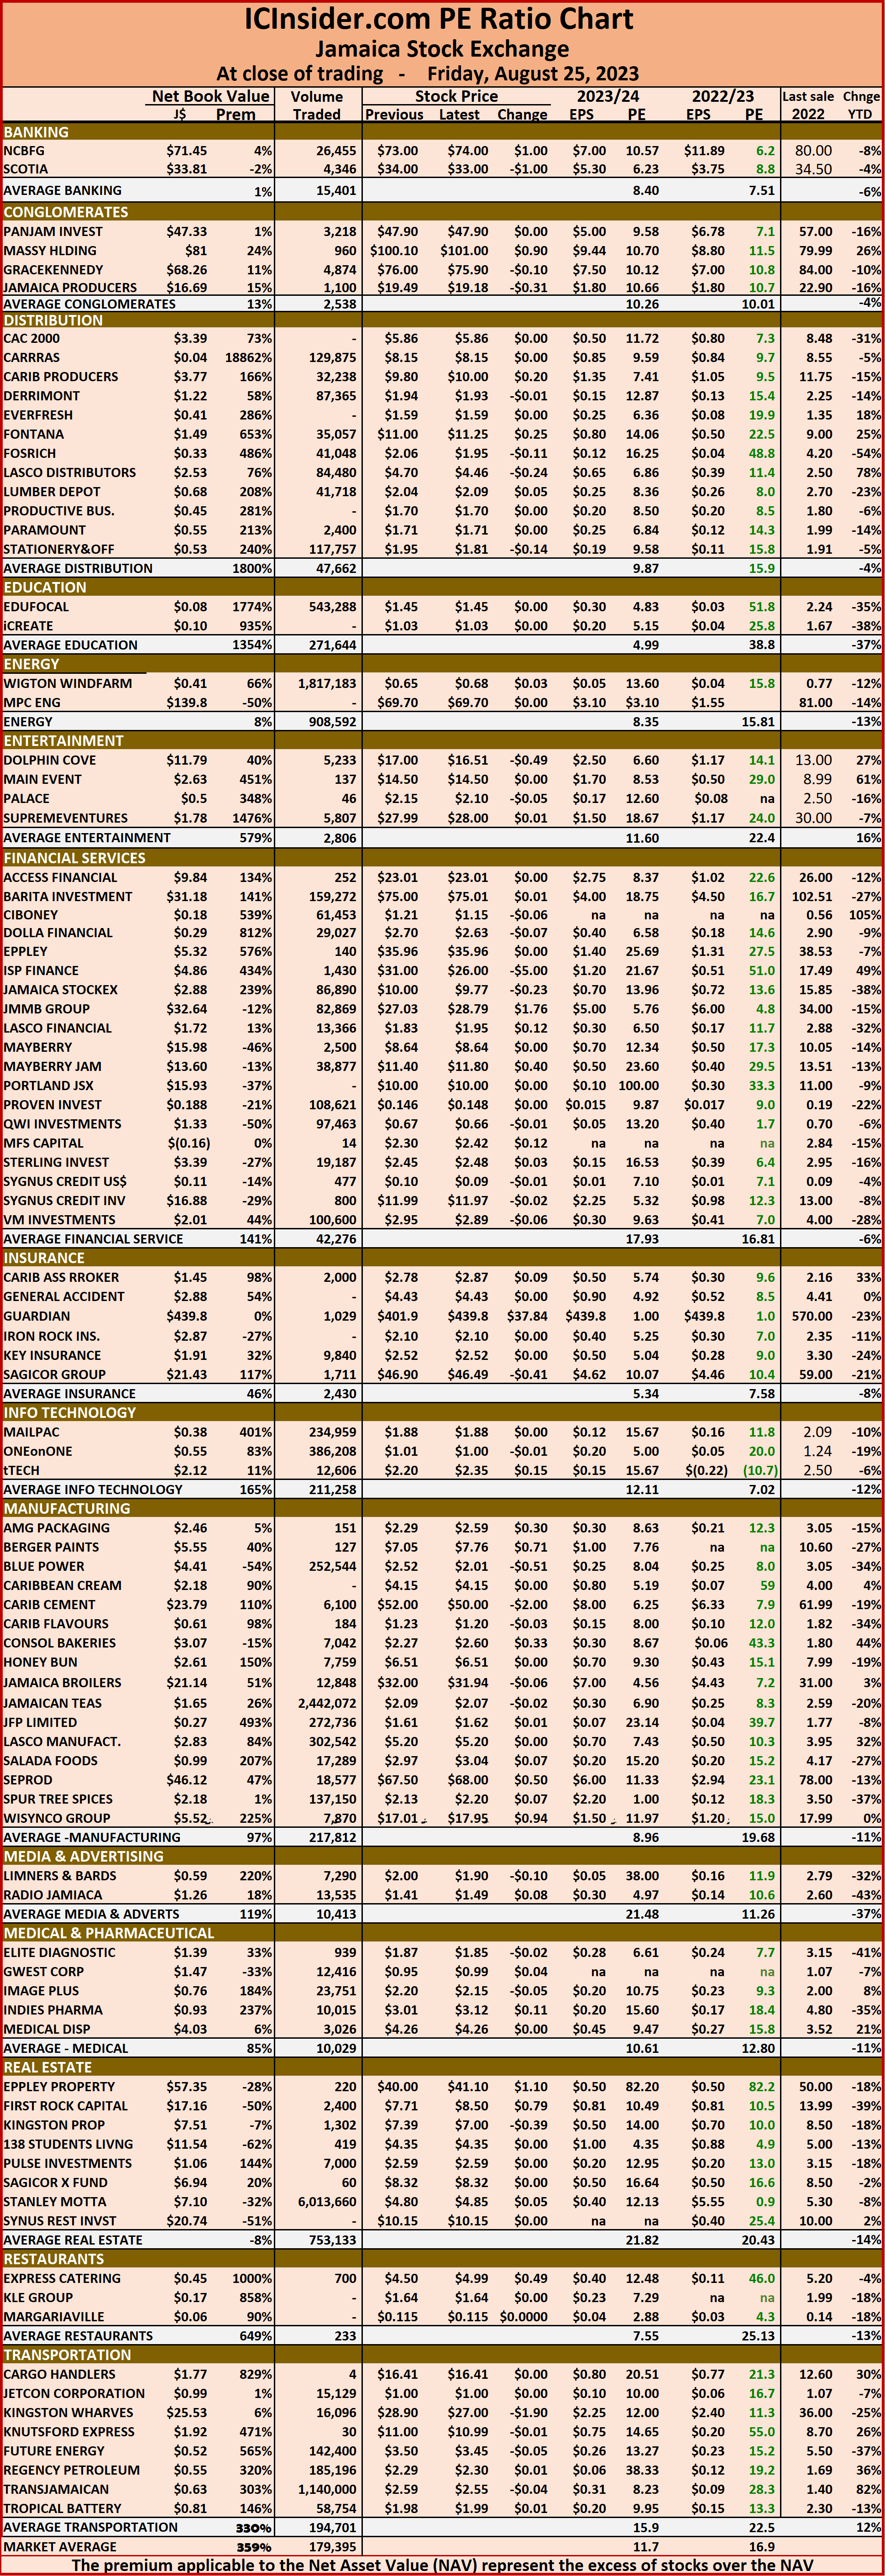
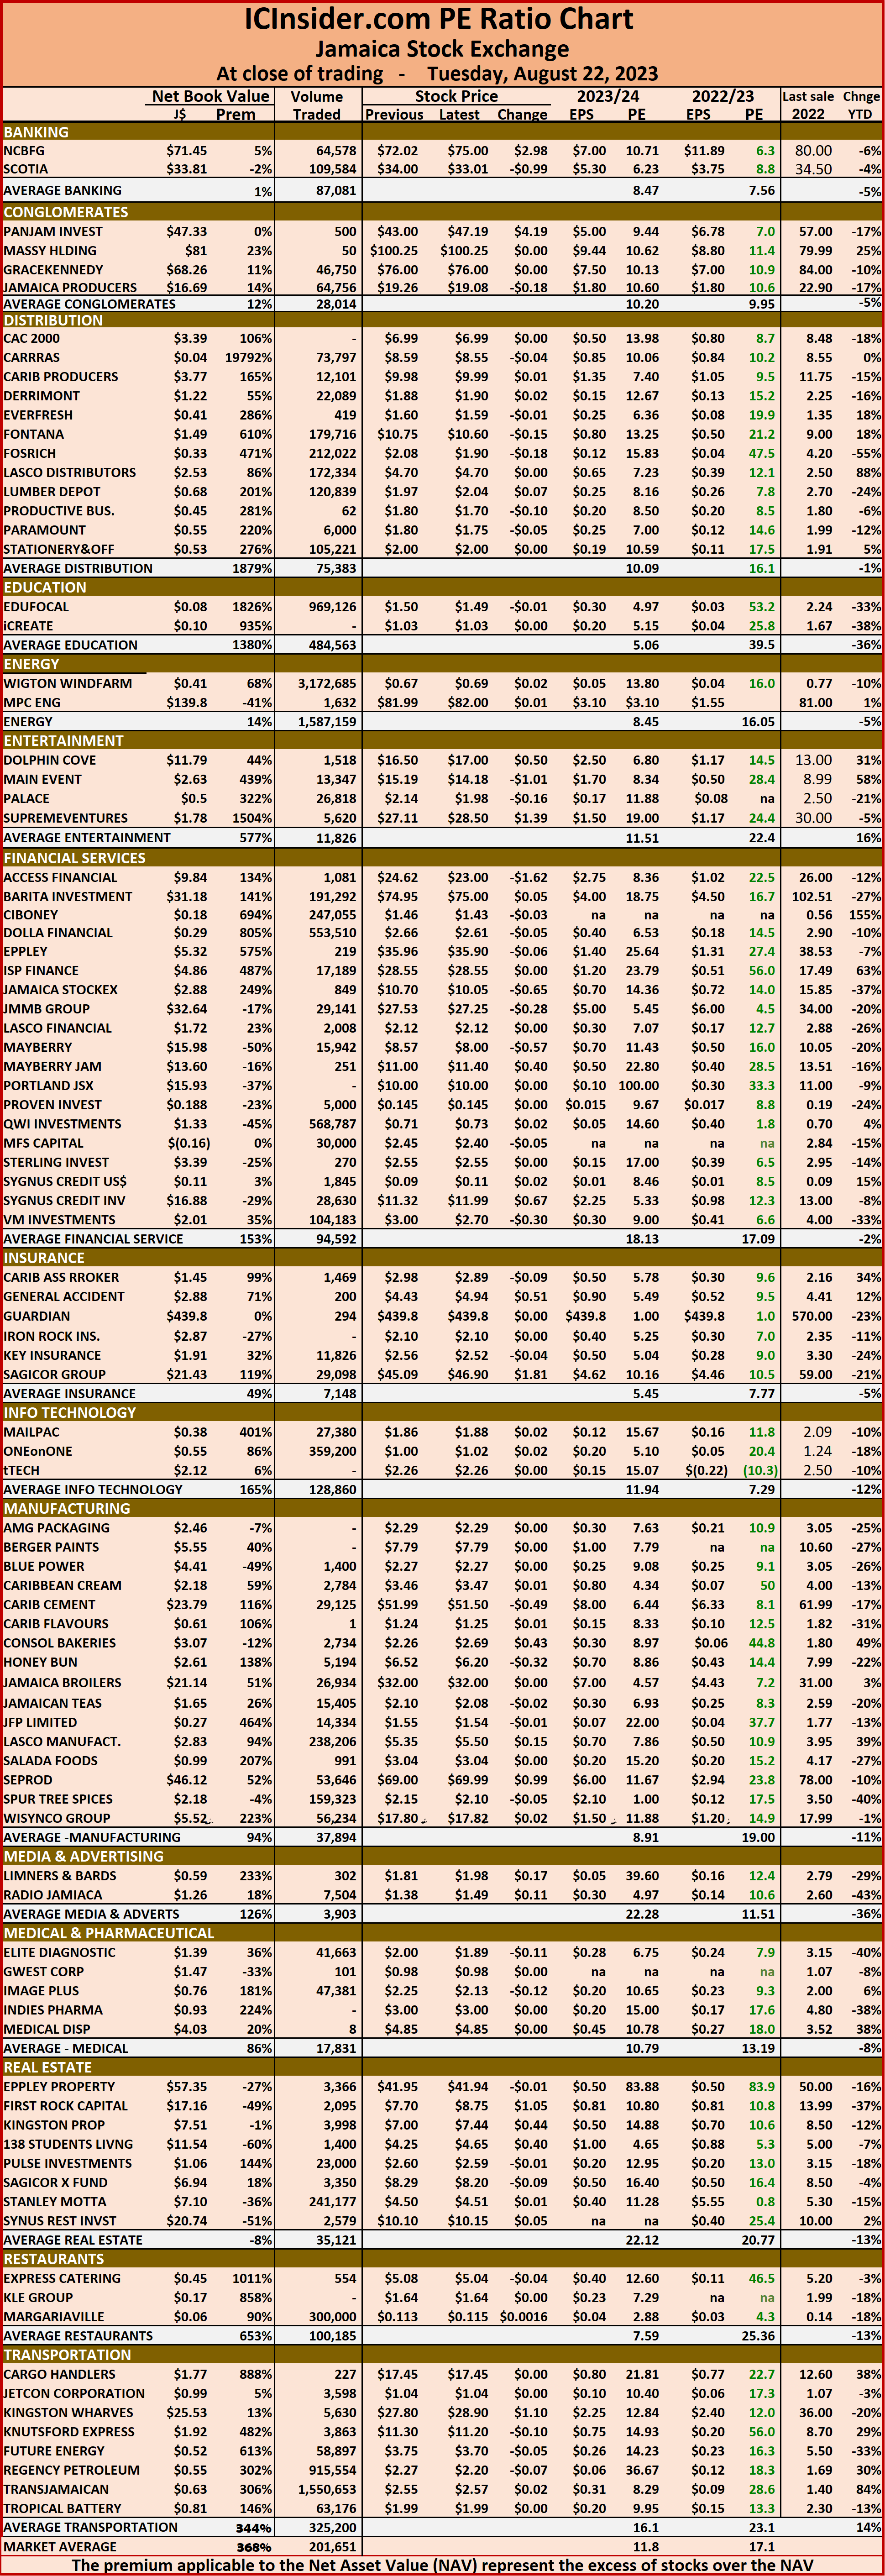
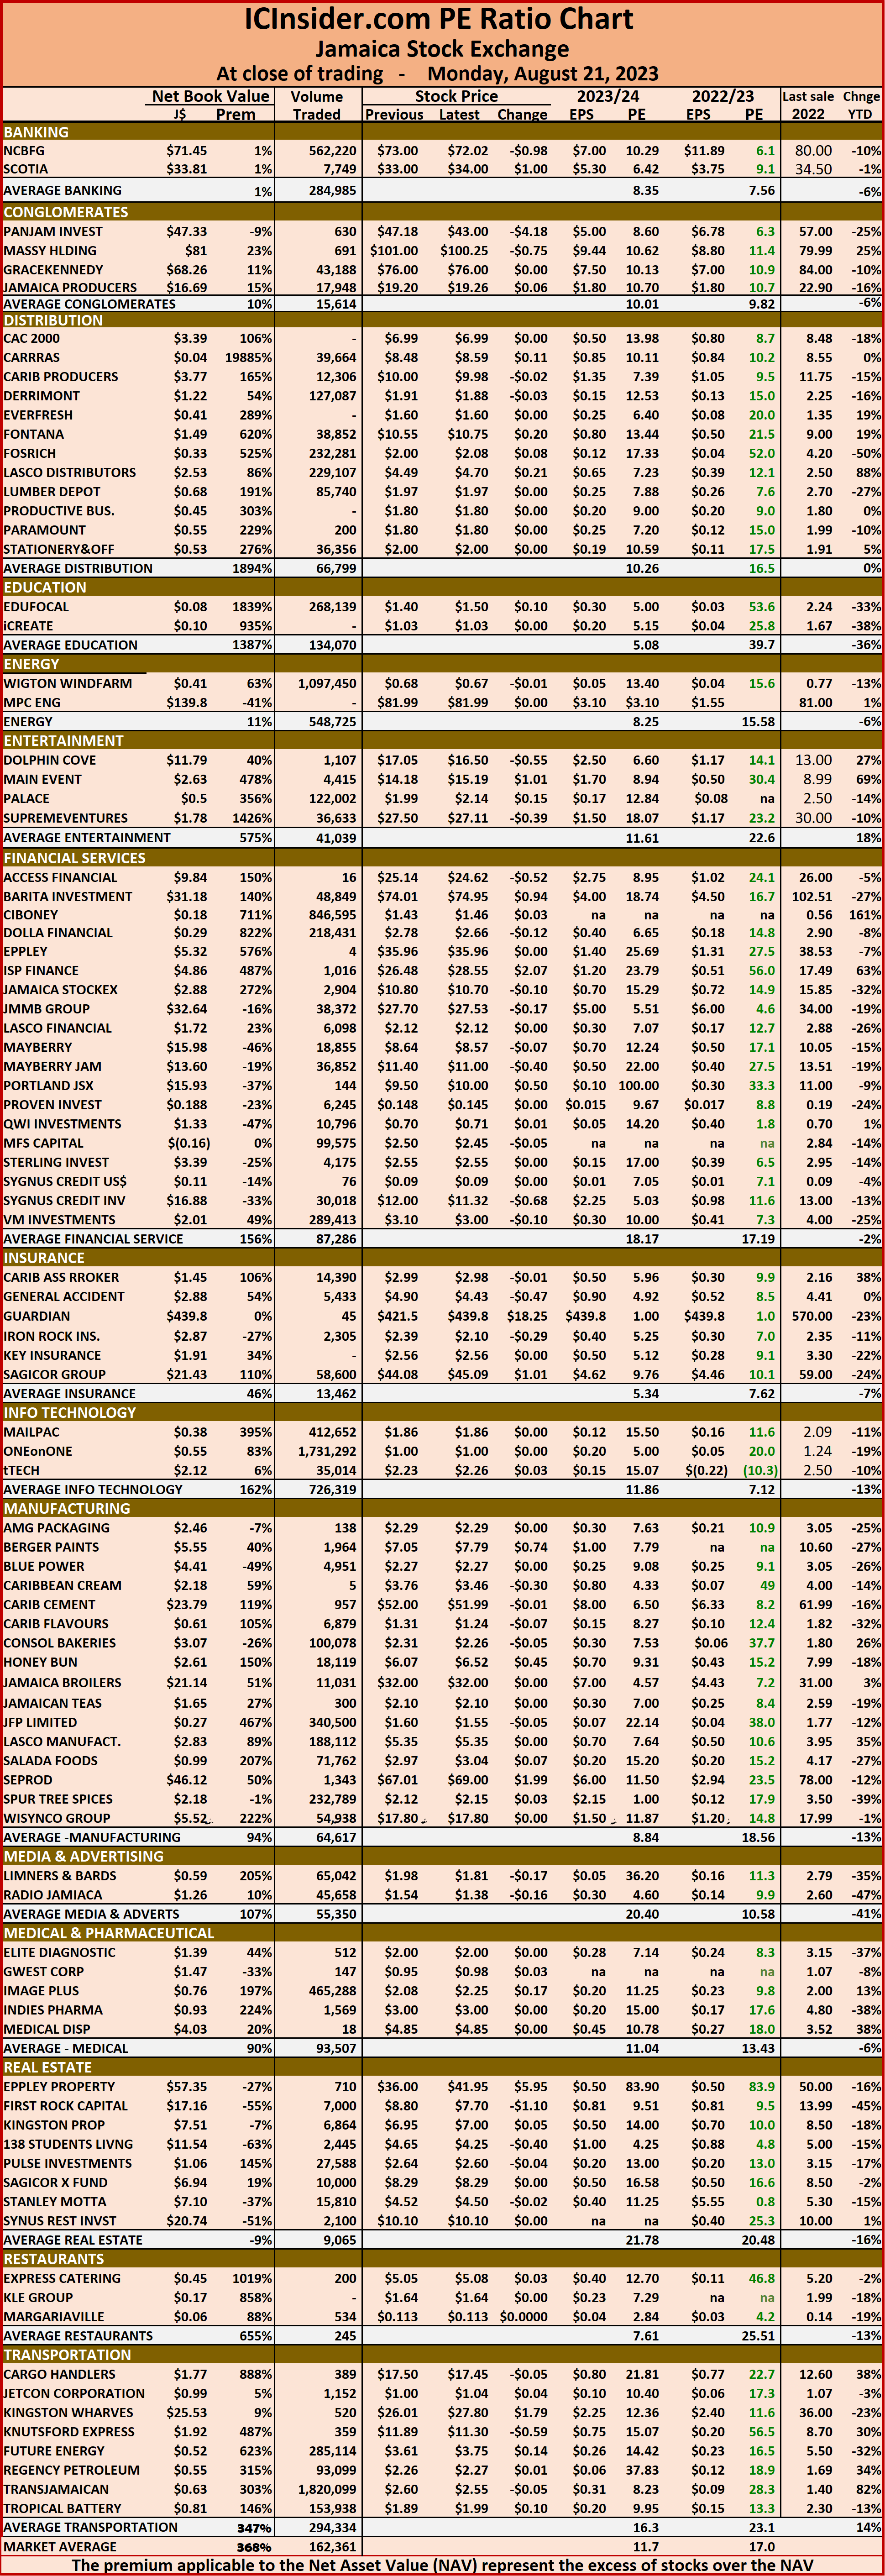
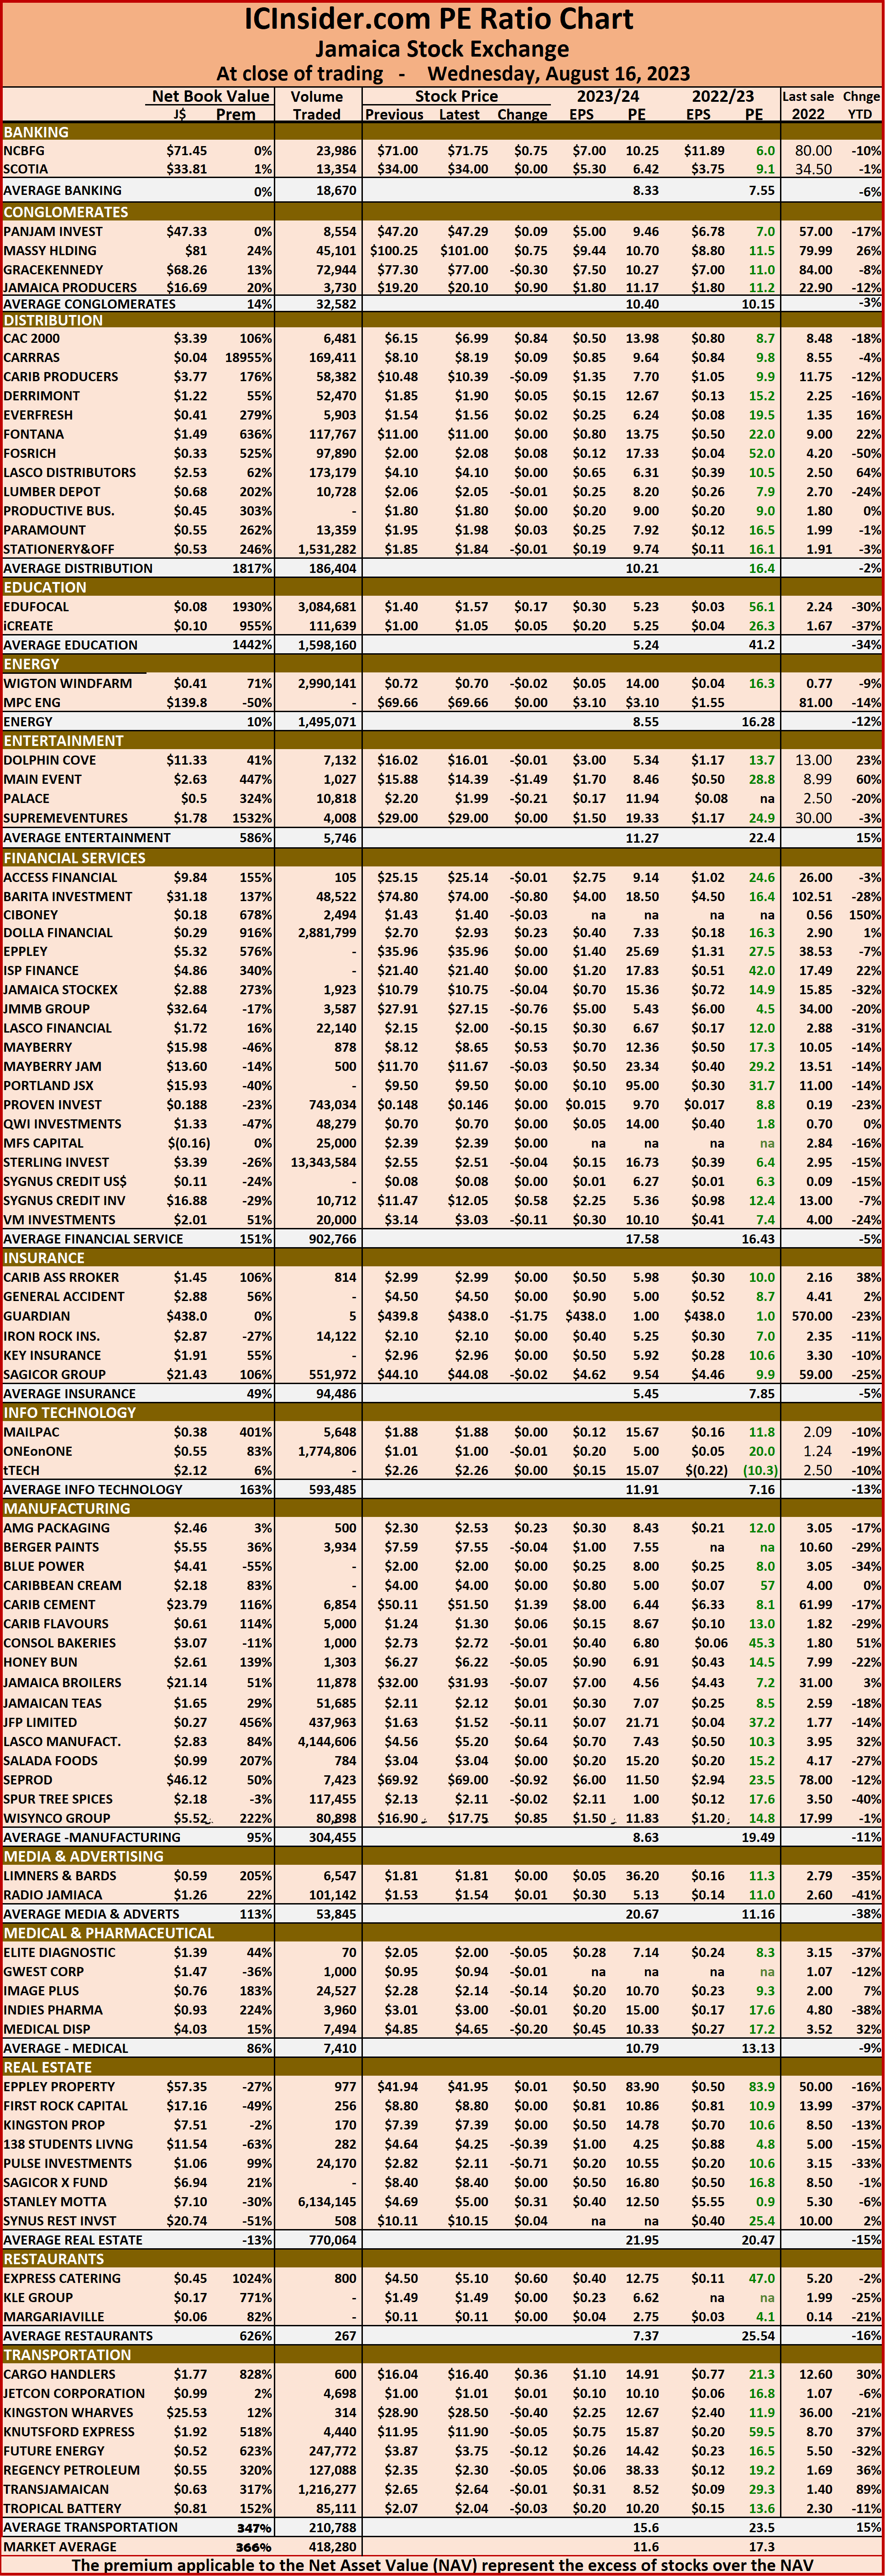
 The market’s PE ratio, the most popular measure used to determine the value of stocks ended at 16.8 on 2022-23 earnings and 11.6 times those for 2023-24 at the close of trading. ICInsider.com PE ratio chart and the more detailed daily report charts provide investors with regularly updated information to help decision-making.
The PE ratio chart covers all ordinary shares on the Jamaica Stock Exchange. It shows companies grouped by industry, allowing for easy comparisons between the same sector companies and the overall market. The EPS & PE ratios are based on 2023 and 2024 actual or projected earnings, excluding major one time items.
Investors need pertinent information to successfully navigate numerous investment options in the local stock market. The ICInsider.com PE ratio chart and the more detailed daily report charts provide investors with regularly updated information to help decision-making.
Investors should use the chart to help make rational decisions when investing in stocks close to the average for the sector and not going too far from it unless there are compelling reasons to do so. This approach helps to remove emotions from investment decisions and place them on fundamentals while at the same time not being too far from the majority of investors. Investors who buy when the price of a stock is close to the average will find that they are not inclined to overpay for a stock.
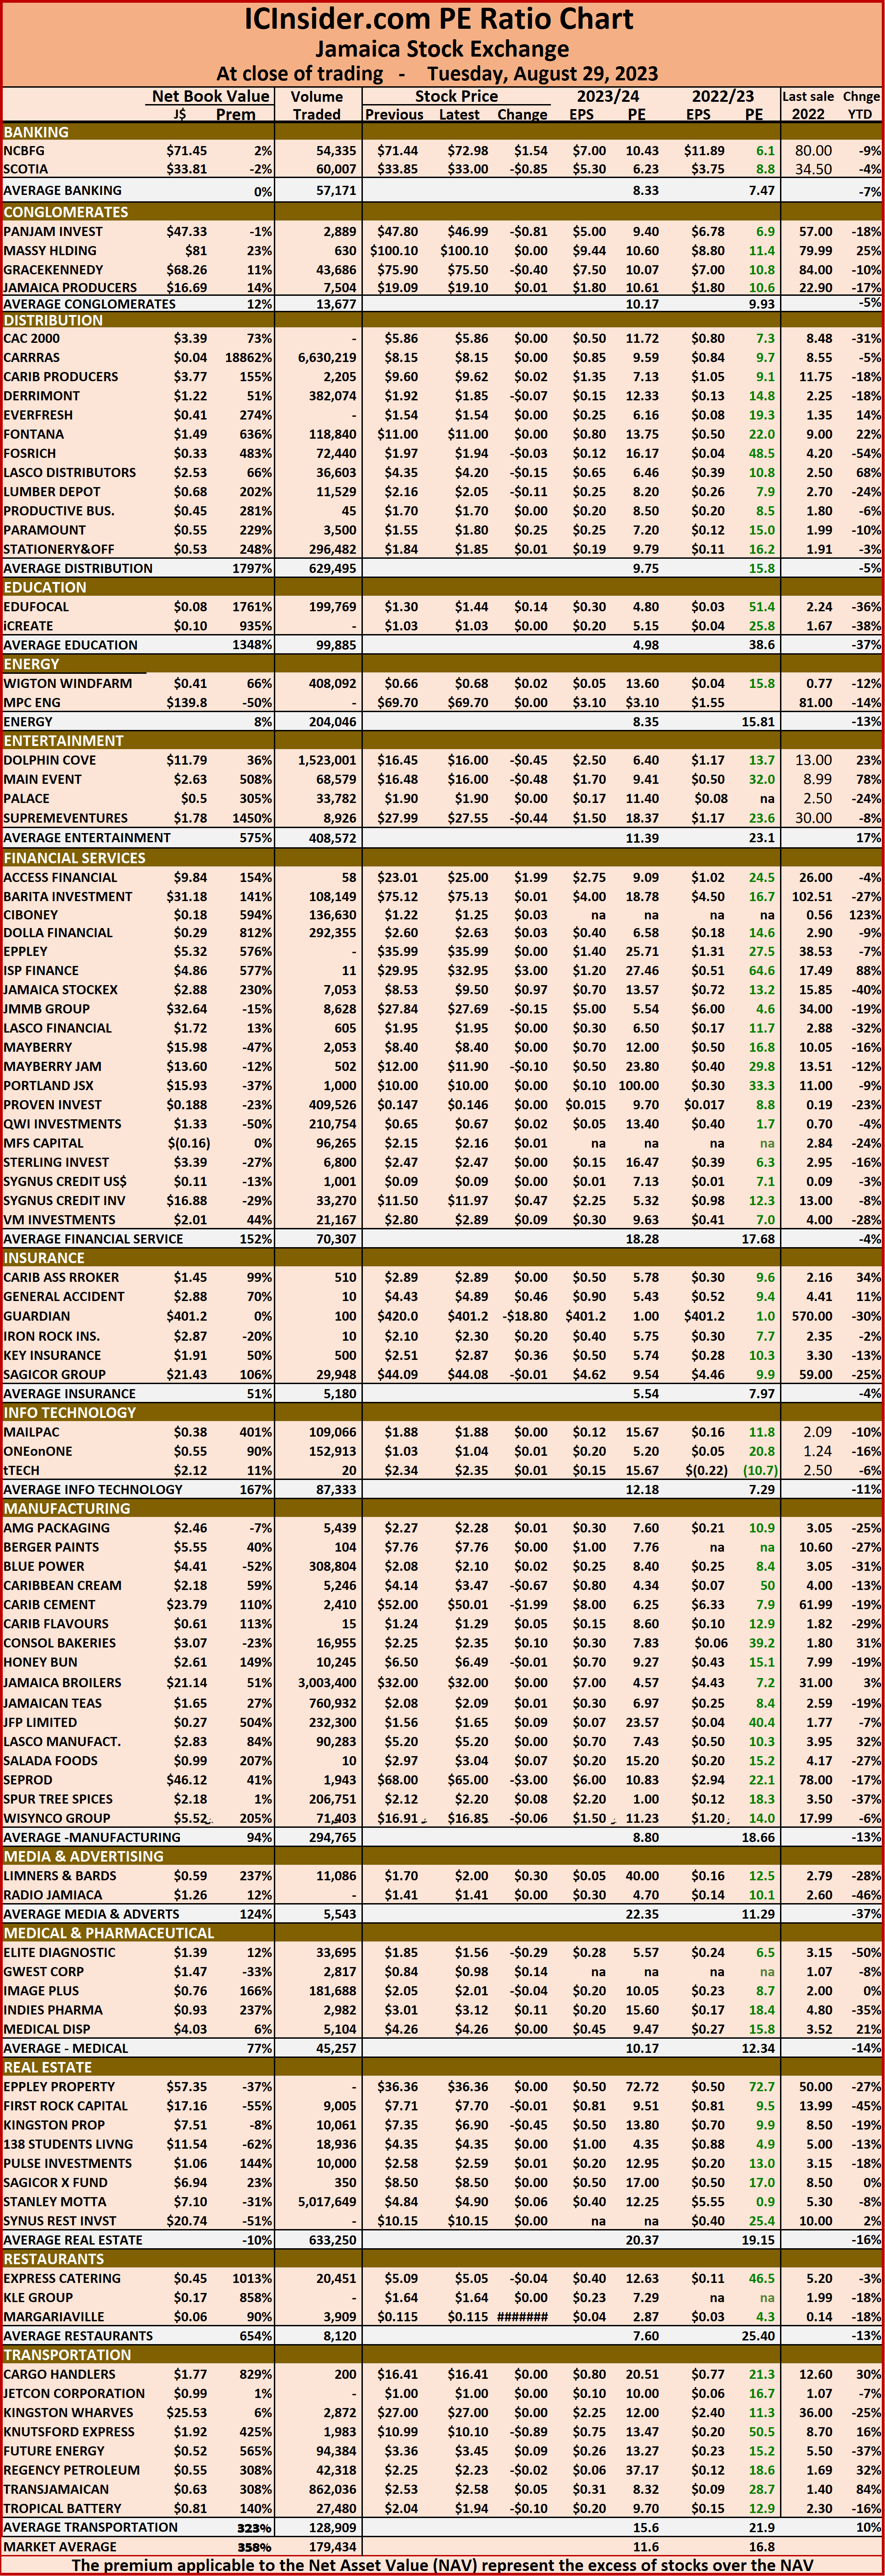 The net asset value of each company is reported as a guide to assess the value of stocks based on this measure quickly. The chart also shows daily changes in stock prices and the percentage year to date price movement based on the last traded prices.
Dividends paid or payable and yields for each company are shown in the Main and Junior Markets’ daily report charts along with the closing volume pertaining to the highest bid and the lowest offer for each company.
Meagre Jamaica Stock Exchange trading
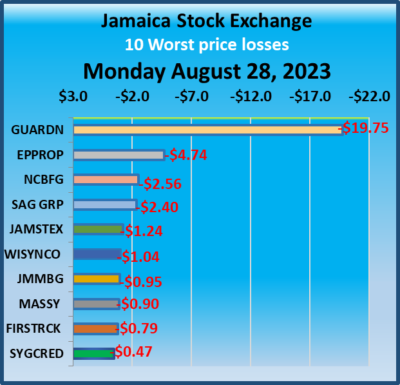
Trading dropped on Monday on the Jamaica Stock Exchange compared with Friday and resulted in declines in all markets with the value and volume of stocks traded falling compared with Friday’s levels.
 At the close, the JSE Combined Market Index dropped 3,153.87 points to 330,852.33 the All Jamaican Composite Index skidded 3,967.05 points to close at 349,449.87, the JSE Main Index dived 3,340.09 points to 316,989.72, the Junior Market Index continues to consolidate, dipping a mere 4.08 points to settle at 3,832.17, while the JSE USD Market Index slipped 4.53 points to end at 234.04.
Trading of Preference shares ended, with Productive Business Solutions 10.5 % preference share rallying $98 to close at $1,100.
At the close, investors traded 10,494,639 shares in all three markets, down from 16,261,370 stocks on Friday. The value of stocks traded on the Junior and Main markets ended at $71.6 million, compared to $75.96 million on Friday. Trading on the JSE USD market ended with investors exchanging 884,498 shares for US$16,456, up from 109,502 units at US$16,272 on Friday.
 The market’s PE ratio, the most popular measure used to determine the value of stocks ended at 16.6 on 2022-23 earnings and 11.4 times those for 2023-24 at the close of trading. ICInsider.com PE ratio chart and the more detailed daily report charts provide investors with regularly updated information to help decision-making.
The PE ratio chart covers all ordinary shares on the Jamaica Stock Exchange. It shows companies grouped by industry, allowing for easy comparisons between the same sector companies and the overall market. The EPS & PE ratios are based on 2023 and 2024 actual or projected earnings, excluding major one off items.
Investors need pertinent information to successfully navigate numerous investment options in the local stock market. The ICInsider.com PE ratio chart and the more detailed daily report charts provide investors with regularly updated information to help decision-making.
Investors should use the chart to help make rational decisions when investing in stocks close to the average for the sector and not going too far from it unless there are compelling reasons to do so. This approach helps to remove emotions from investment decisions and place them on fundamentals while at the same time not being too far from the majority of investors. Investors who buy when the price of a stock is close to the average will find that they are not inclined to overpay for a stock.
 The net asset value of each company is reported as a guide to assess the value of stocks based on this measure quickly. The chart also shows daily changes in stock prices and the percentage year to date price movement based on the last traded prices.
Dividends paid or payable and yields for each company are shown in the Main and Junior Markets’ daily report charts along with the closing volume pertaining to the highest bid and the lowest offer for each company.
Mixed trading for JSE Markets
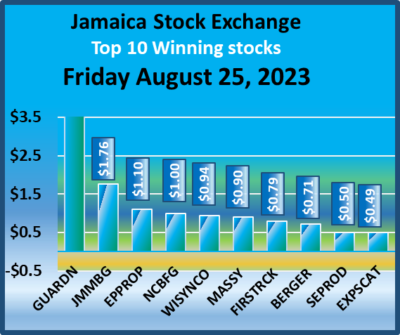
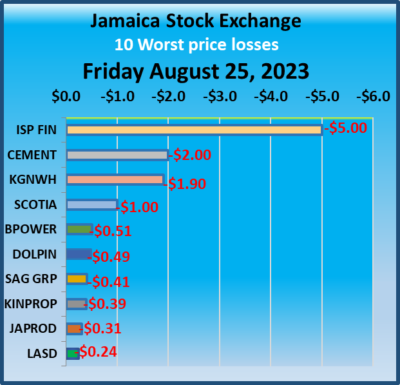
The markets of the Jamaica Stock Exchange closed mixed on Friday following declines on Thursday in all markets and ended with increases in the value and volume of stocks traded compared with Thursday’s levels.
 At the close, the JSE Combined Market Index rose 24.06 points to 334,006.20, the All Jamaican Composite Index skidded 1,591.81 points to settle at 353,416.92, the JSE Main Index popped 23.12 points to 320,329.81, the Junior Market Index just popped 0.28 points to 3,836.25, while the JSE USD Market Index slipped 1.59 points to end at 238.57.
At the close, investors traded 16,261,370 shares in all three markets, up from 14,063,900 stocks on Thursday. The value of stocks traded on the Junior and Main markets ended at $75.96 million, up from $47.66 million on Thursday. Trading on the JSE USD market ended with investors exchanging 109,502 shares for US$16,272 up from 389,899 units at US$37,298 on Thursday.
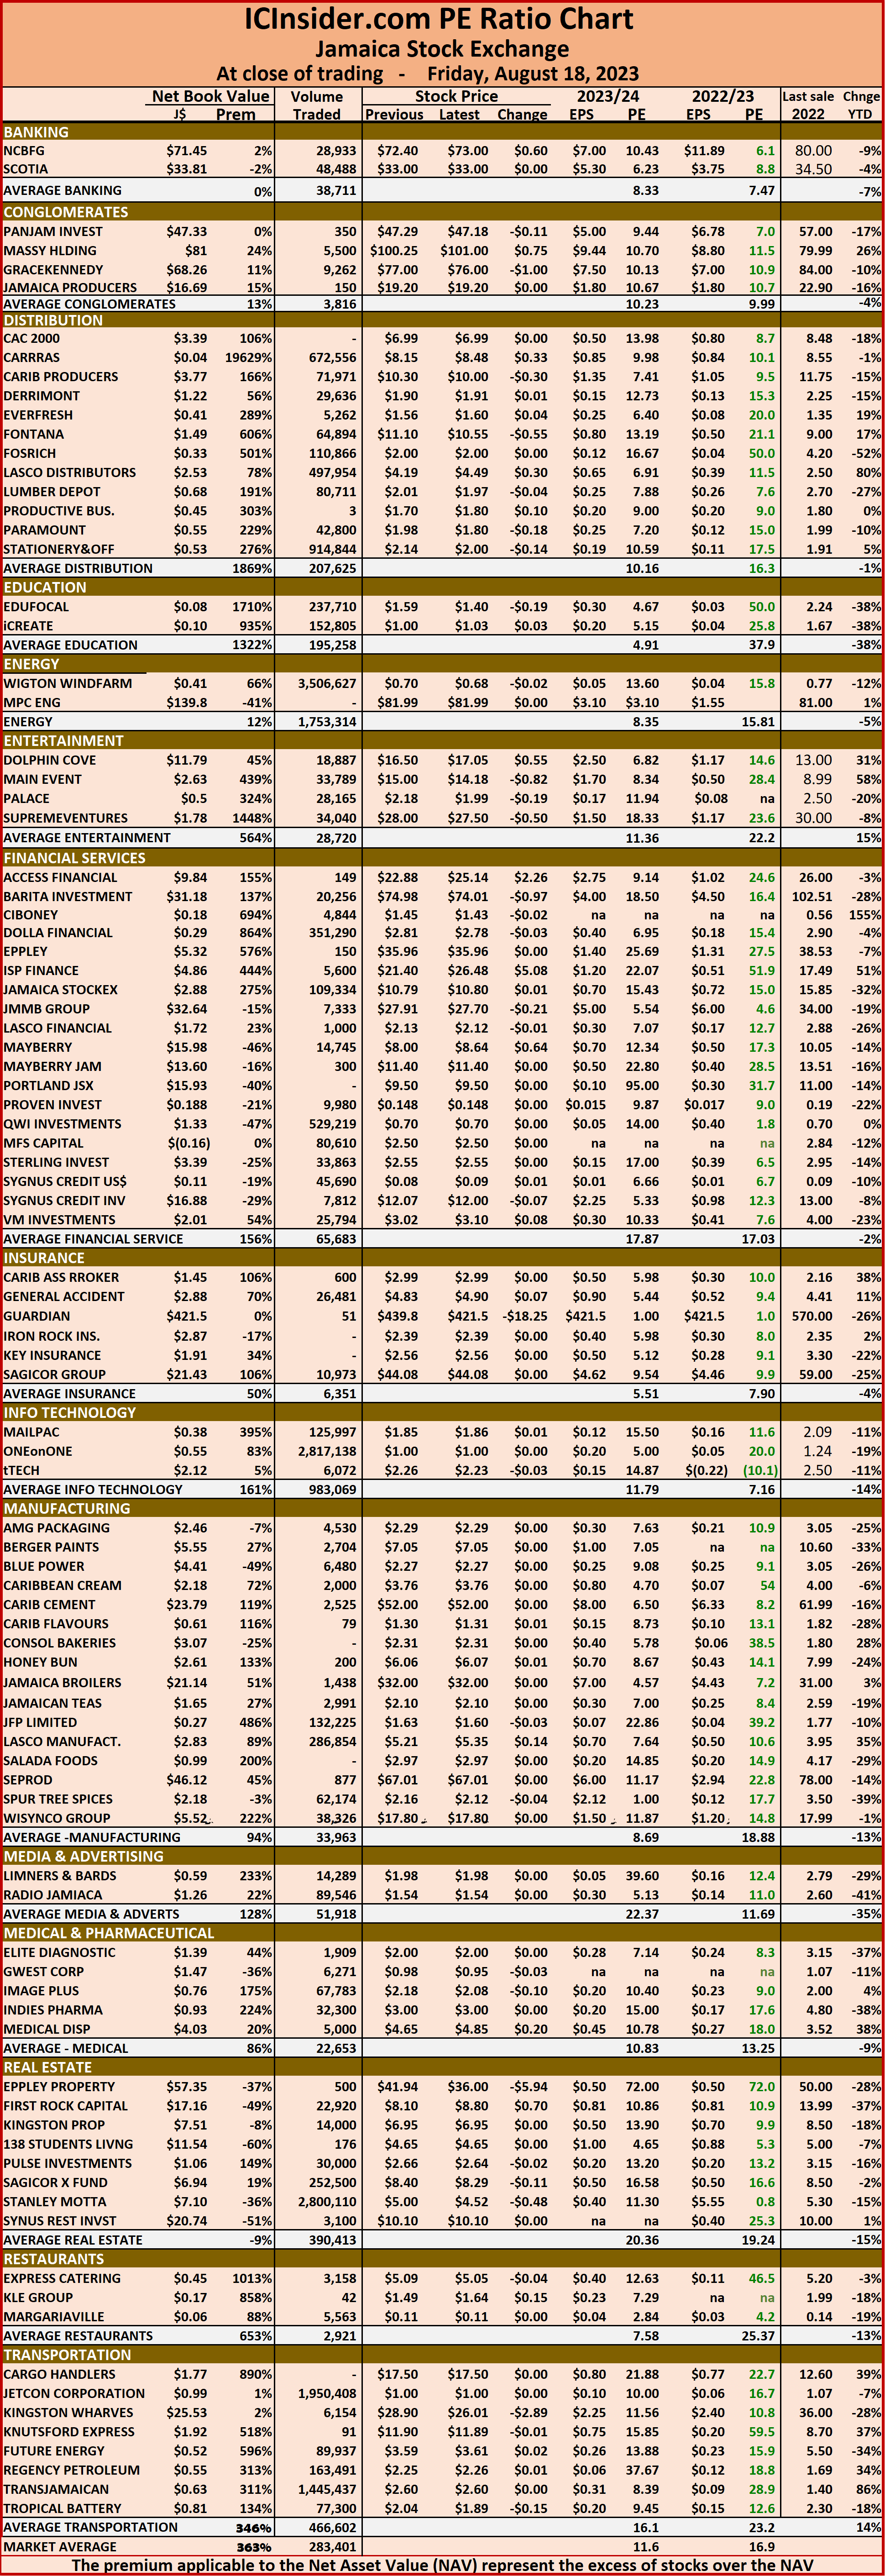
The market’s PE ratio, the most popular measure used to determine the value of stocks ended at 16.9 on 2022-23 earnings and 11.7 times those for 2023-24 at the close of trading. ICInsider.com PE ratio chart and the more detailed daily report charts provide investors with regularly updated information to help decision-making.
 The PE ratio chart covers all ordinary shares on the Jamaica Stock Exchange. It shows companies grouped by industry, allowing for easy comparisons between the same sector companies and the overall market. The EPS & PE ratios are based on 2023 and 2024 actual or projected earnings, excluding major one off items.
Investors need pertinent information to successfully navigate numerous investment options in the local stock market. The ICInsider.com PE ratio chart and the more detailed daily report charts provide investors with regularly updated information to help decision-making.
Investors should use the chart to help make rational decisions when investing in stocks close to the average for the sector and not going too far from it unless there are compelling reasons to do so. This approach helps to remove emotions from investment decisions and place them on fundamentals while at the same time not being too far from the majority of investors. Investors who buy when the price of a stock is close to the average will find that they are not inclined to overpay for a stock.
 The net asset value of each company is reported as a guide to assess the value of stocks based on this measure quickly. The chart also shows daily changes in stock prices and the percentage year to date price movement based on the last traded prices.
Dividends paid or payable and yields for each company are shown in the Main and Junior Markets’ daily report charts along with the closing volume pertaining to the highest bid and the lowest offer for each company.
Retreat for all JSE Markets
All three markets of the Jamaica Stock Exchange pulled back on Thursday following a drop in the value and volume of stocks traded compared with Wednesday’s levels.
 At the close, the JSE Combined Market Index dropped 3,151.37 points to close trading at 333,982.14, the All Jamaican Composite Index fell 1,860.37 points to 355,008.73, the JSE Main Index dived 3,329.09 points to end at 320,306.69, the Junior Market Index shed 4.93 points to settle at 3,835.97, while the JSE USD Market Index slipped 1.20 points to end at 240.16.
Trading of Preference shares ended, with Eppley 7.75% preference share falling $1.85 to close at $18.20, Jamaica Public Service 7% declining $5 to $50 units and Jamaica Public Service 9.5% diving $249.99 to end at $2,800.01.
At the close, investors traded 14,063,900 shares in all three markets, down from 14,291,744 stocks on Wednesday. The value of stocks traded on the Junior and Main markets ended at just $47.66 million, down from $100.88 million on Wednesday. Trading on the JSE USD market ended with investors exchanging 389,899 shares for US$37,298 up from 45,555 units at US$14,460 on Wednesday.
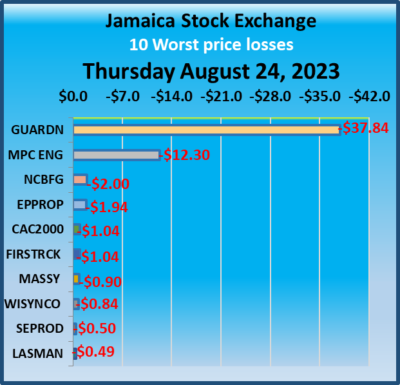 The market’s PE ratio, the most popular measure used to determine the value of stocks ended at 16.8 on 2022-23 earnings and 11.7 times those for 2023-24 at the close of trading. ICInsider.com PE ratio chart and the more detailed daily report charts provide investors with regularly updated information to help decision-making.
The PE ratio chart covers all ordinary shares on the Jamaica Stock Exchange. It shows companies grouped by industry, allowing for easy comparisons between the same sector companies and the overall market. The EPS & PE ratios are based on 2023 and 2024 actual or projected earnings, excluding major one off items.
Investors need pertinent information to successfully navigate numerous investment options in the local stock market. The ICInsider.com PE ratio chart and the more detailed daily report charts provide investors with regularly updated information to help decision-making.
Investors should use the chart to help make rational decisions when investing in stocks close to the average for the sector and not going too far from it unless there are compelling reasons to do so. 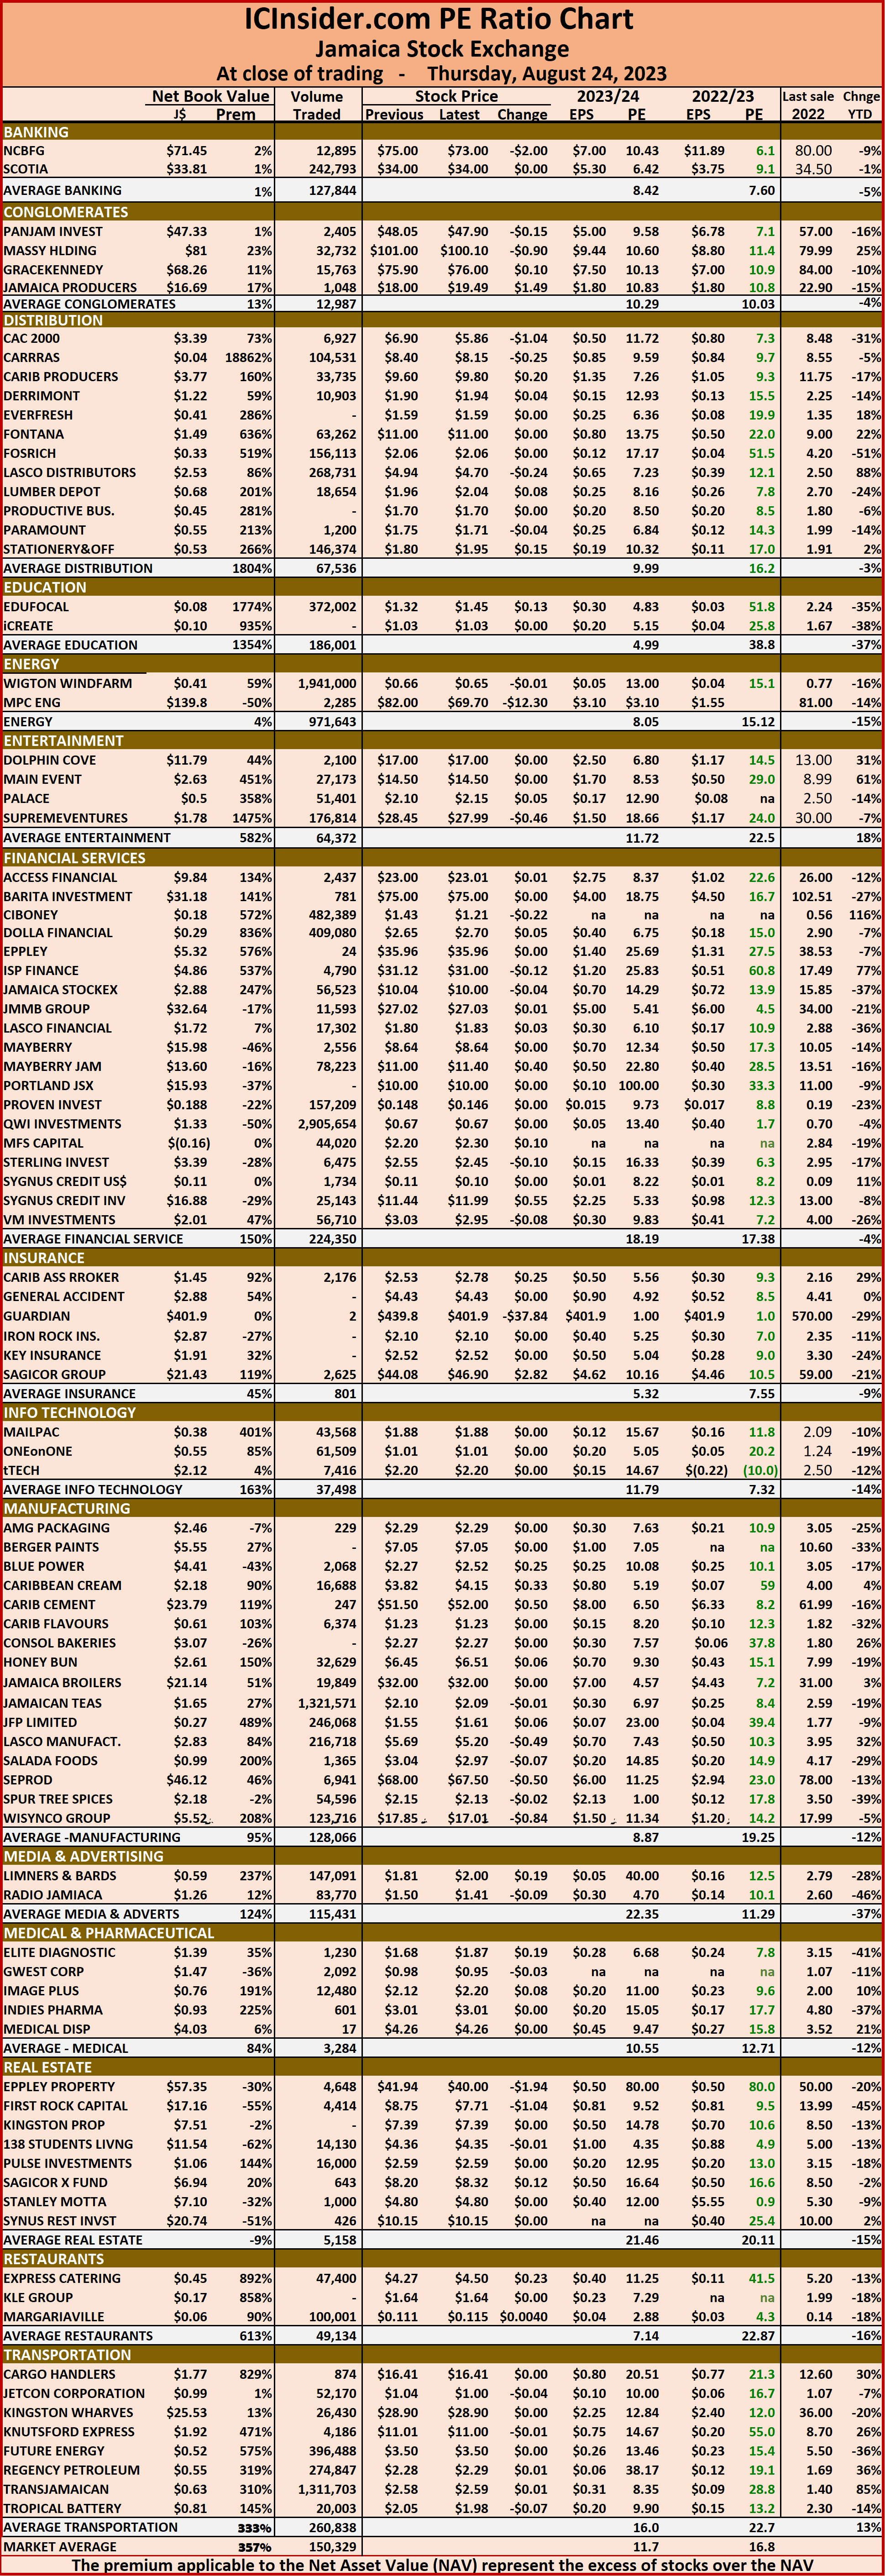 This approach helps to remove emotions from investment decisions and place them on fundamentals while at the same time not being too far from the majority of investors. Investors who buy when the price of a stock is close to the average will find that they are not inclined to overpay for a stock.
The net asset value of each company is reported as a guide to assess the value of stocks based on this measure quickly. The chart also shows daily changes in stock prices and the percentage year to date price movement based on the last traded prices.
Dividends paid or payable and yields for each company are shown in the Main and Junior Markets’ daily report charts along with the closing volume pertaining to the highest bid and the lowest offer for each company.
Junior Market plunges, Main Market gains
Trading climbed on the Jamaica Stock Exchange on Wednesday with the value and volume of stocks traded rising above Tuesday’s levels and resulting in a mixed close for the Exchange.
 At the close, the JSE Combined Market Index popped 709.40 points to 337133.51, the All Jamaican Composite Index climbed 1,340.21 points to 356,869.10, the JSE Main Index increased 1,279.01 points to 323,635.78, the Junior Market Index plunged 52.88 points to settle at 3,840.90, while the JSE USD Market Index rose 0.66 points to end at 241.36.
Trading of Preference shares ended, with Jamaica Public Service 7% falling $1 to $55 and Jamaica Public Service 9.5% dropping $50 to $3,050, being the preference stocks with notable price movements.
At the close, investors traded 14,291,744 shares in all three markets, down from 13,335,561 stocks on Tuesday. The value of stocks traded on the Junior and Main markets ended at $100.88 million, up from $62.45 million on Tuesday. Trading on the JSE USD market ended with investors exchanging 45,555 shares for US$14,460 compared with 343,792 units at US$39,382 on Tuesday.
 The market’s PE ratio, the most popular measure used to determine the value of stocks ended at 16.5 on 2022-23 earnings and 11.6 times those for 2023-24 at the close of trading. ICInsider.com PE ratio chart and the more detailed daily report charts provide investors with regularly updated information to help decision-making.
The PE ratio chart covers all ordinary shares on the Jamaica Stock Exchange. It shows companies grouped by industry, allowing for easy comparisons between the same sector companies and the overall market. The EPS & PE ratios are based on 2023 and 2024 actual or projected earnings, excluding major one off items.
Investors need pertinent information to successfully navigate numerous investment options in the local stock market. The ICInsider.com PE ratio chart and the more detailed daily report charts provide investors with regularly updated information to help decision-making.
Investors should use the chart to help make rational decisions when investing in stocks close to the average for the sector and not going too far from it unless there are compelling reasons to do so. This approach helps to remove emotions from investment decisions and place them on fundamentals while at the same time not being too far from the majority of investors. Investors who buy when the price of a stock is close to the average will find that they are not inclined to overpay for a stock.
 The net asset value of each company is reported as a guide to assess the value of stocks based on this measure quickly. The chart also shows daily changes in stock prices and the percentage year to date price movement based on the last traded prices.
Dividends paid or payable and yields for each company are shown in the Main and Junior Markets’ daily report charts along with the closing volume pertaining to the highest bid and the lowest offer for each company.
Fall for JSE Markets on Tuesday
Trading dropped on the Jamaica Stock Exchange on Tuesday with the value and volume of stocks traded falling below Monday’s trades, resulting in slippage in all three markets of the Exchange.
 At the close, the JSE Combined Market Index fell 1,745.02 points to 336,424.11, the All Jamaican Composite Index shed 2,282.01 points to 355,528.89, the JSE Main Index declined 1,867.43 points to 322,356.77, the Junior Market Index slipped 0.28 points to 3,893.78, while the JSE USD Market Index shed 6.67 points to settle at 240.70.
Trading of Preference shares ended with just one notable price change, with Productive Business Solutions 9.75% preference share recovering the $8 lost on Monday to close at $100.
At the close, investors traded 13,335,561 shares in all three markets, down from 15,594,397 stocks on Monday. The value of stocks traded on the Junior and Main markets ended at $62.45 million, down from $86.57 million on Monday. Trading on the JSE USD market ended with investors exchanging 343,792 shares for US$39,382 compared with 282,396 units at US$9,019 on Monday.
 The market’s PE ratio, the most popular measure used to determine the value of stocks ended at 17.1 on 2022-23 earnings and 11.8 times those for 2023-24 at the close of trading. ICInsider.com PE ratio chart and the more detailed daily report charts provide investors with regularly updated information to help decision-making.
The PE ratio chart covers all ordinary shares on the Jamaica Stock Exchange. It shows companies grouped by industry, allowing for easy comparisons between the same sector companies and the overall market. The EPS & PE ratios are based on 2023 and 2024 actual or projected earnings, excluding major one off items.
Investors need pertinent information to successfully navigate numerous investment options in the local stock market. The ICInsider.com PE ratio chart and the more detailed daily report charts provide investors with regularly updated information to help decision-making.
Investors should use the chart to help make rational decisions when investing in stocks close to the average for the sector and not going too far from it unless there are compelling reasons to do so. This approach helps to remove emotions from investment decisions and place them on fundamentals while at the same time not being too far from the majority of investors. Investors who buy when the price of a stock is close to the average will find that they are not inclined to overpay for a stock.
 The net asset value of each company is reported as a guide to assess the value of stocks based on this measure quickly. The chart also shows daily changes in stock prices and the percentage year to date price movement based on the last traded prices.
Dividends paid or payable and yields for each company are shown in the Main and Junior Markets’ daily report charts along with the closing volume pertaining to the highest bid and the lowest offer for each company.
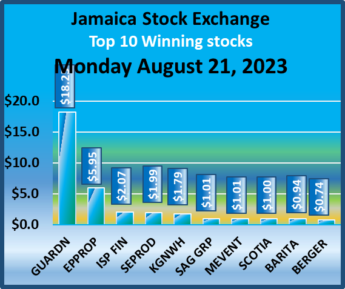
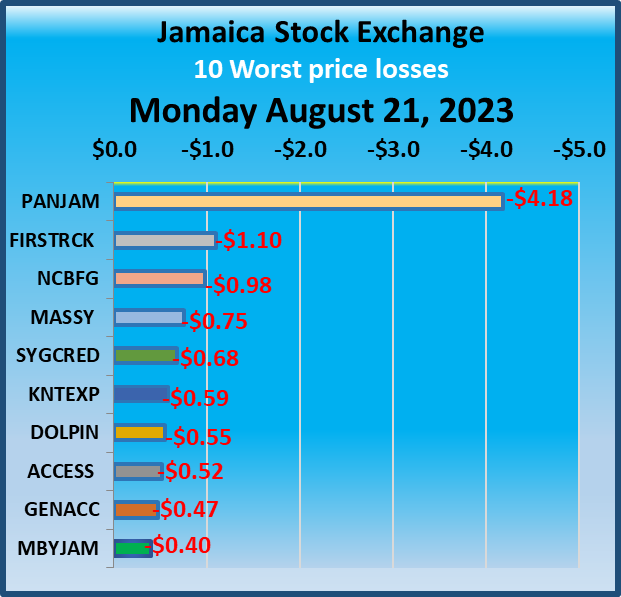
Gains for all JSE Markets on Monday
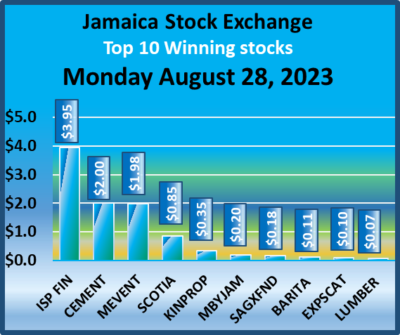
Trading was mixed on the Jamaica Stock Exchange on Monday with the value of stocks traded climbing above Friday’s trades but with a lower volume, resulting in all three markets of the Jamaica Stock Exchange recording gains to start off the week.
 At the close, the JSE Combined Market Index climbed 3,936.15 points to close at 338,169.13, the All Jamaican Composite Index surged 4,373.19 points to 357,810.90, the JSE Main Index jumped 4,153.40 points to 324,224.20, the Junior Market Index gained 6.64 points to close trading at 3,894.06, while the JSE USD Market Index popped 0.84 points to 247.37.
Trading of Preference shares ended with notable price changes for Jamaica Public Service 7% with a rise of 75 cents to close at $56, Productive Business Solutions 10.5% preference share increasing $2 to $1002 and Productive Business Solutions 9.75% preference share
shedding $8 to end at $92.
At the close, investors dealt in 15,594,397 shares in all three markets, down from 19,541,580 stocks on Friday. The value of stocks traded on the Junior and Main markets ended at $86.57 million, up from $73.3 million on Friday. Trading on the JSE USD market ended with investors exchanging 282,396 shares for US$9,019 compared with 595,775 units at US$31,180 on Friday.
 The market’s PE ratio, the most popular measure used to determine the value of stocks ended at 17 on 2022-23 earnings and 11.7 times those for 2023-24 at the close of trading. ICInsider.com PE ratio chart and the more detailed daily report charts provide investors with regularly updated information to help decision-making.
The PE ratio chart covers all ordinary shares on the Jamaica Stock Exchange. It shows companies grouped by industry, allowing for easy comparisons between the same sector companies and the overall market. The EPS & PE ratios are based on 2023 and 2024 actual or projected earnings, excluding major one off items.
Investors need pertinent information to successfully navigate numerous investment options in the local stock market. The ICInsider.com PE ratio chart and the more detailed daily report charts provide investors with regularly updated information to help decision-making.
Investors should use the chart to help make rational decisions when investing in stocks close to the average for the sector and not going too far from it unless there are compelling reasons to do so. This approach helps to remove emotions from investment decisions and place them on fundamentals while at the same time not being too far from the majority of investors. Investors who buy when the price of a stock is close to the average will find that they are not inclined to overpay for a stock.
 The net asset value of each company is reported as a guide to assess the value of stocks based on this measure quickly. The chart also shows daily changes in stock prices and the percentage year to date price movement based on the last traded prices.
Dividends paid or payable and yields for each company are shown in the Main and Junior Markets’ daily report charts along with the closing volume pertaining to the highest bid and the lowest offer for each company.
Trading gained steam on the Jamaica Stock Exchange
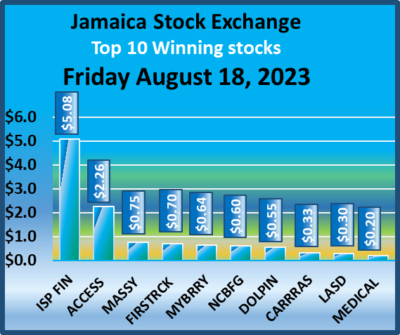
Trading picked up on the Jamaica Stock Exchange on Friday with the volume and the value of stocks traded climbing above Thursday’s trades and resulting in all three markets of the Jamaica Stock Exchange recording gains in the main indices, but the combined index dipped to close out the week.
 At the close, the JSE Combined Market Index dipped 414.94 points to close at 334,232.98, the All Jamaican Composite Index rose 129.65 points to end at 353,437.71, the JSE Main Index dropped 684.90 points to finish at 320,070.80, the Junior Market Index gained 24.48 points to close trading at 3,887.42, while the JSE USD Market Index rose 9.95 points to 246.53.
There was only one Preference share trading that ended with a notable price change with Productive Business Solutions 10.5 % preference share shedding $100 and ended at $1000.
At the close, investors dealt in 19,541,580 shares in all three markets, up from 10,094,461 stocks on Thursday. The value of stocks traded on the Junior and Main markets ended at $73.3 million, up from $47.9 million on Thursday. Trading on the JSE USD market ended with investors exchanging 595,775 shares for US$31,180 compared with 445,494 units at US$17,444 on Thursday.
 The market’s PE ratio, the most popular measure used to determine the value of stocks ended at 16.9 on 2022-23 earnings and 11.6 times those for 2023-24 at the close of trading. ICInsider.com PE ratio chart and the more detailed daily report charts provide investors with regularly updated information to help decision-making.
The PE ratio chart covers all ordinary shares on the Jamaica Stock Exchange. It shows companies grouped by industry, allowing for easy comparisons between the same sector companies and the overall market. The EPS & PE ratios are based on 2023 and 2024 actual or projected earnings, excluding major one off items.
Investors need pertinent information to successfully navigate numerous investment options in the local stock market. The ICInsider.com PE ratio chart and the more detailed daily report charts provide investors with regularly updated information to help decision-making.
Investors should use the chart to help make rational decisions when investing in stocks close to the average for the sector and not going too far from it unless there are compelling reasons to do so. This approach helps to remove emotions from investment decisions and place them on fundamentals while at the same time not being too far from the majority of investors. Investors who buy when the price of a stock is close to the average will find that they are not inclined to overpay for a stock.
 The net asset value of each company is reported as a guide to assess the value of stocks based on this measure quickly. The chart also shows daily changes in stock prices and the percentage year to date price movement based on the last traded prices.
Dividends paid or payable and yields for each company are shown in the Main and Junior Markets’ daily report charts along with the closing volume pertaining to the highest bid and the lowest offer for each company.
Trading plunges on the Jamaica Stock Exchange
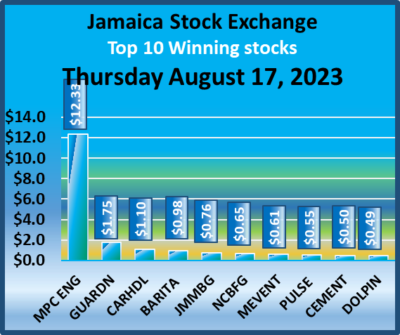
Stocks registered losses in all three markets of the Jamaica Stock Exchange on Thursday as trading plunged well below that on Wednesday, with the volume of stocks 23 percent of that traded previously and a value just under 30 percent of Wednesday’s traded value.
 At the close, the JSE Combined Market Index dipped 522.54 points to 334,647.92, the All Jamaican Composite Index dropped 757.11 points to 353,308.06, the JSE Main Index lost 457.71 points to end at 320,755.70, the Junior Market Index fell 10.42 points to finish at 3,862.94, the JSE USD Market Index shed 6.47 points to close at 236.58.
There was only one Preference share trading that ended with a notable price change as Jamaica Public Service 7% fell $9.75 to $55.25.
At the close, investors dealt in 10,094,461 shares in all three markets, down from 43,258,967 stocks on Wednesday. The value of stocks traded on the Junior and Main markets ended at just $47.9 million, down sharply from $162 million on Wednesday. Trading on the JSE USD market ended with investors exchanging 445,494 shares for US$17,444, compared with 797,307 units at US$115,172 on Wednesday.
 The market’s PE ratio, the most popular measure used to determine the value of stocks ended at 17.2 on 2022-23 earnings and 11.8 times those for 2023-24 at the close of trading. ICInsider.com PE ratio chart and the more detailed daily report charts provide investors with regularly updated information to help decision-making.
The PE ratio chart covers all ordinary shares on the Jamaica Stock Exchange. It shows companies grouped by industry, allowing for easy comparisons between the same sector companies and the overall market. The EPS & PE ratios are based on 2023 and 2024 actual or projected earnings, excluding major one off items.
Investors need pertinent information to successfully navigate numerous investment options in the local stock market. The ICInsider.com PE ratio chart and the more detailed daily report charts provide investors with regularly updated information to help decision-making.
Investors should use the chart to help make rational decisions when investing in stocks close to the average for the sector and not going too far from it unless there are compelling reasons to do so. This approach helps to remove emotions from investment decisions and place them on fundamentals while at the same time not being too far from the majority of investors. Investors who buy when the price of a stock is close to the average will find that they are not inclined to overpay for a stock.
 The net asset value of each company is reported as a guide to assess the value of stocks based on this measure quickly. The chart also shows daily changes in stock prices and the percentage year to date price movement based on the last traded prices.
Dividends paid or payable and yields for each company are shown in the Main and Junior Markets’ daily report charts along with the closing volume pertaining to the highest bid and the lowest offer for each company.
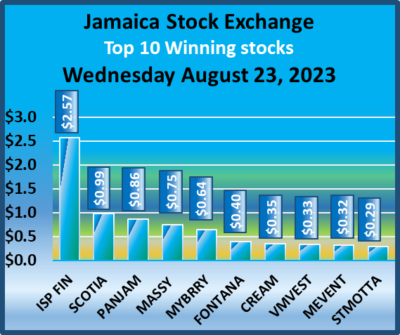
Big Junior market recovery, Main Market slips
The Junior Market recovered all most all the 137 points drop in the previous two days as it enjoyed a near 100-point bounce on Wednesday, with JSE USD rising with the Main Market index slipping following a rise in volume and value of stocks trading over the markets’ activity on Tuesday.
 At the close, the JSE Combined Market Index popped 692.51 points to close at 335,170.47, the All Jamaican Composite Index advanced 228.12 points to end at 354,065.17, the JSE Main Index dipped 192.39 points to finish at 321,213.41, the Junior Market Index surged 95.27 points to finish at 3,873.37, while the JSE USD Market Index slipped 2.64 points to close at 243.05.
There are no Preference shares trading with a notable price change.
At the close, investors dealt in 43,258,967 shares in all three markets, up from 23,384,296 stocks on Tuesday. The value of stocks traded on the Junior and Main markets ended at $162 million, up sharply from $61.7 million on Tuesday. Trading on the JSE USD market ended with investors exchanging 797,307 shares for US$115,172, compared with 610,587 units at US$16,053 on Tuesday.
 The market’s PE ratio, the most popular measure used to determine the value of stocks ended at 17.3 on 2022-23 earnings and 11.6 times those for 2023-24 at the close of trading. ICInsider.com PE ratio chart and the more detailed daily report charts provide investors with regularly updated information to help decision-making.
The PE ratio chart covers all ordinary shares on the Jamaica Stock Exchange. It shows companies grouped by industry, allowing for easy comparisons between the same sector companies and the overall market. The EPS & PE ratios are based on 2023 and 2024 actual or projected earnings, excluding major one off items.
Investors need pertinent information to successfully navigate numerous investment options in the local stock market. The ICInsider.com PE ratio chart and the more detailed daily report charts provide investors with regularly updated information to help decision-making.
Investors should use the chart to help make rational decisions when investing in stocks close to the average for the sector and not going too far from it unless there are compelling reasons to do so. This approach helps to remove emotions from investment decisions and place them on fundamentals while at the same time not being too far from the majority of investors. Investors who buy when the price of a stock is close to the average will find that they are not inclined to overpay for a stock.
 The net asset value of each company is reported as a guide to assess the value of stocks based on this measure quickly. The chart also shows daily changes in stock prices and the percentage year to date price movement based on the last traded prices.
Dividends paid or payable and yields for each company are shown in the Main and Junior Markets’ daily report charts along with the closing volume pertaining to the highest bid and the lowest offer for each company.


