Investors seem to have cooled on newly listed One Great Studio with less than 2 million units changing hands on Friday following three days of more than 14 million stocks being traded for each day since listing on Tuesday, with the price drifting down to $1.20 at the close of the week when the overall market end the week with mixed fortunes as the Junior Market inched higher and the Main Market main index rose but the All Jamaican Composite Index fell.
 At close, the JSE Combined Market Index rose 869.06 points to close at 326,253.01, with the All Jamaican Composite Index falling 1,768.93 points to 343,636.27, the JSE Main Index rallied 876.64 points to close at 312,277.29, the Junior Market Index rose 5.83 points to 3809.59, while the JSE USD Market Index shed 1.12 points to finish at 254.26.
At the close, investors exchanged 11,124,804 shares in all three markets, up from 27,691,335 stock units on Thursday. The value of stocks traded on the Junior and Main markets amounted to $85.12 million, up from $72 million on Thursday. Trading on the JSE USD market ended with investors exchanging 580,017 shares for US$10,197 up from 73,572 units at US$2,495, on Thursday.
In the preference segment, 138 Student Living preference share jumped $11.52 and ended at $105.
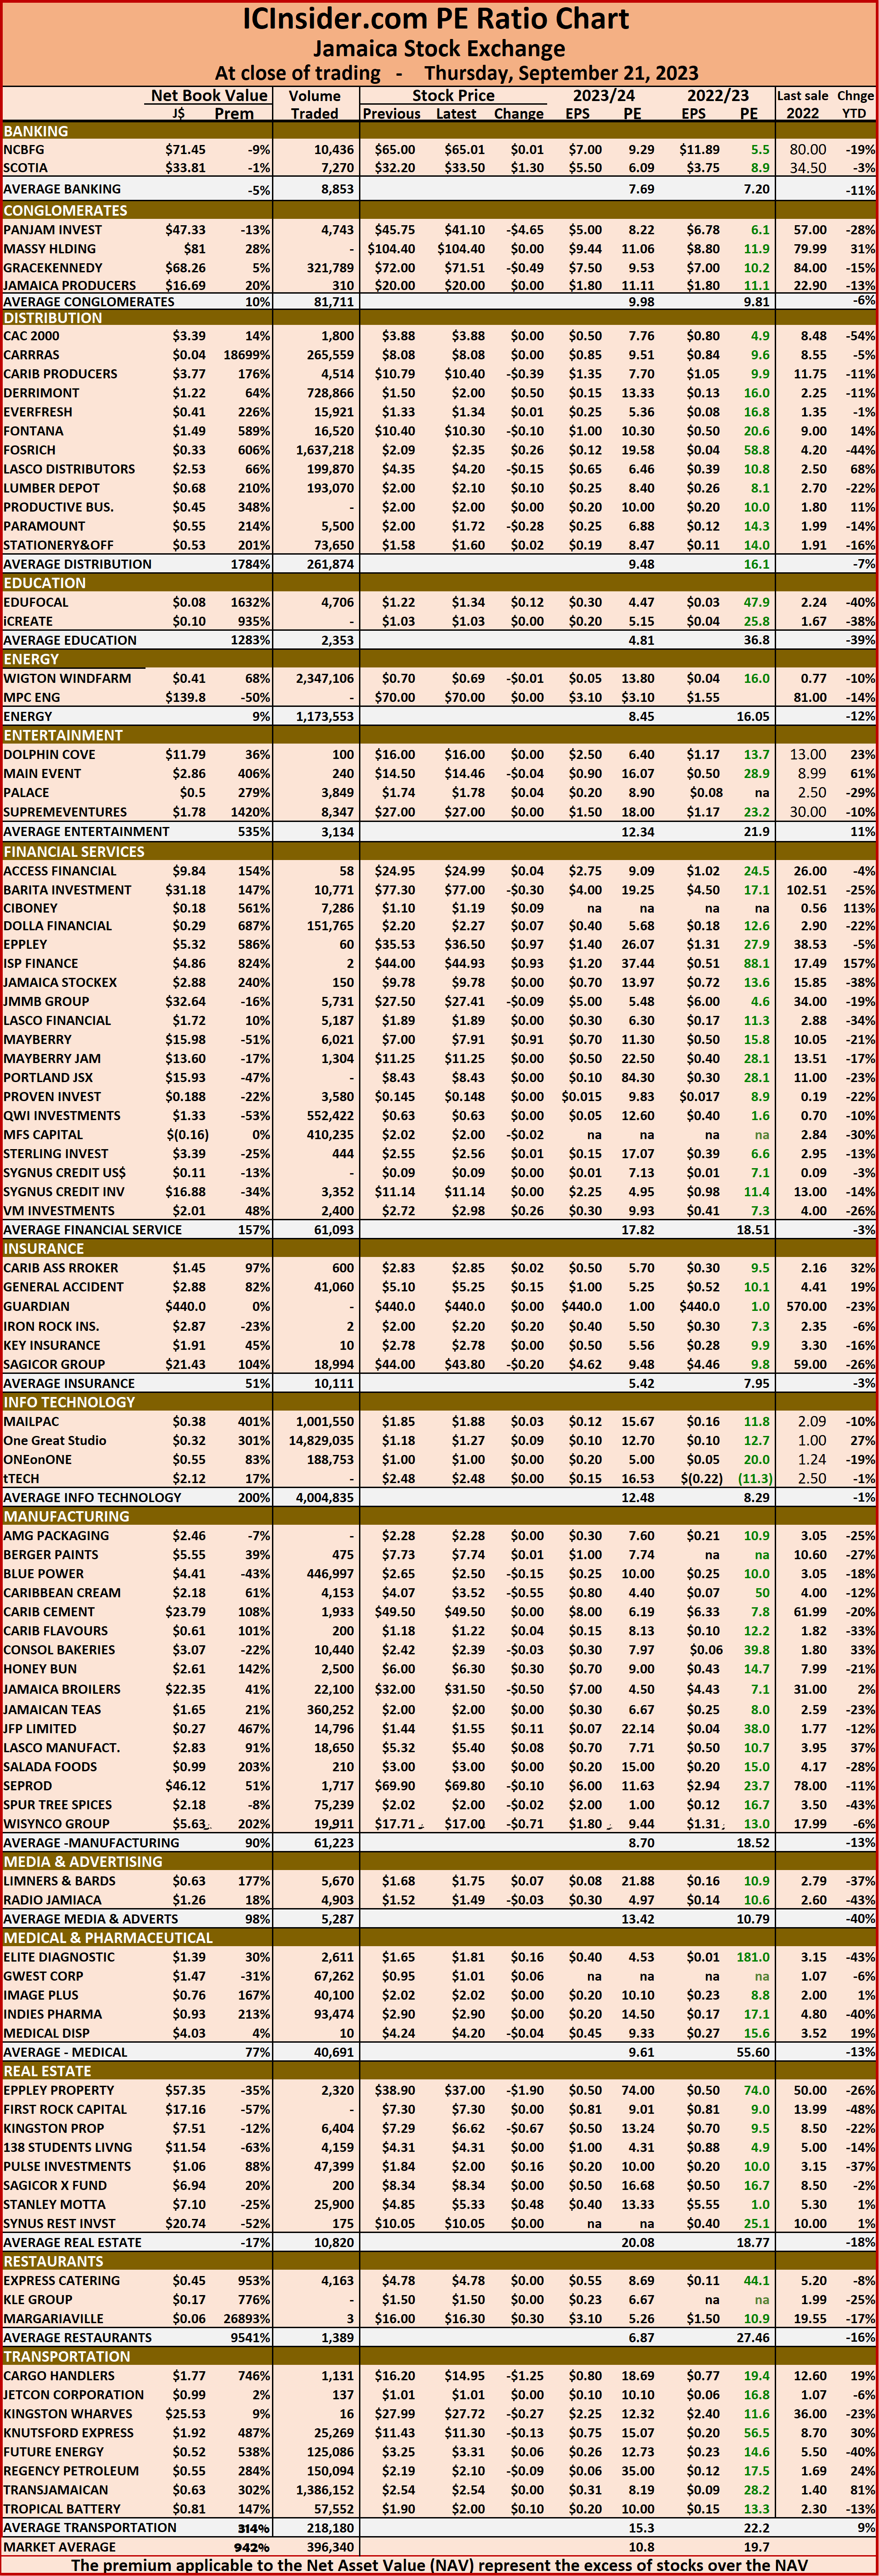
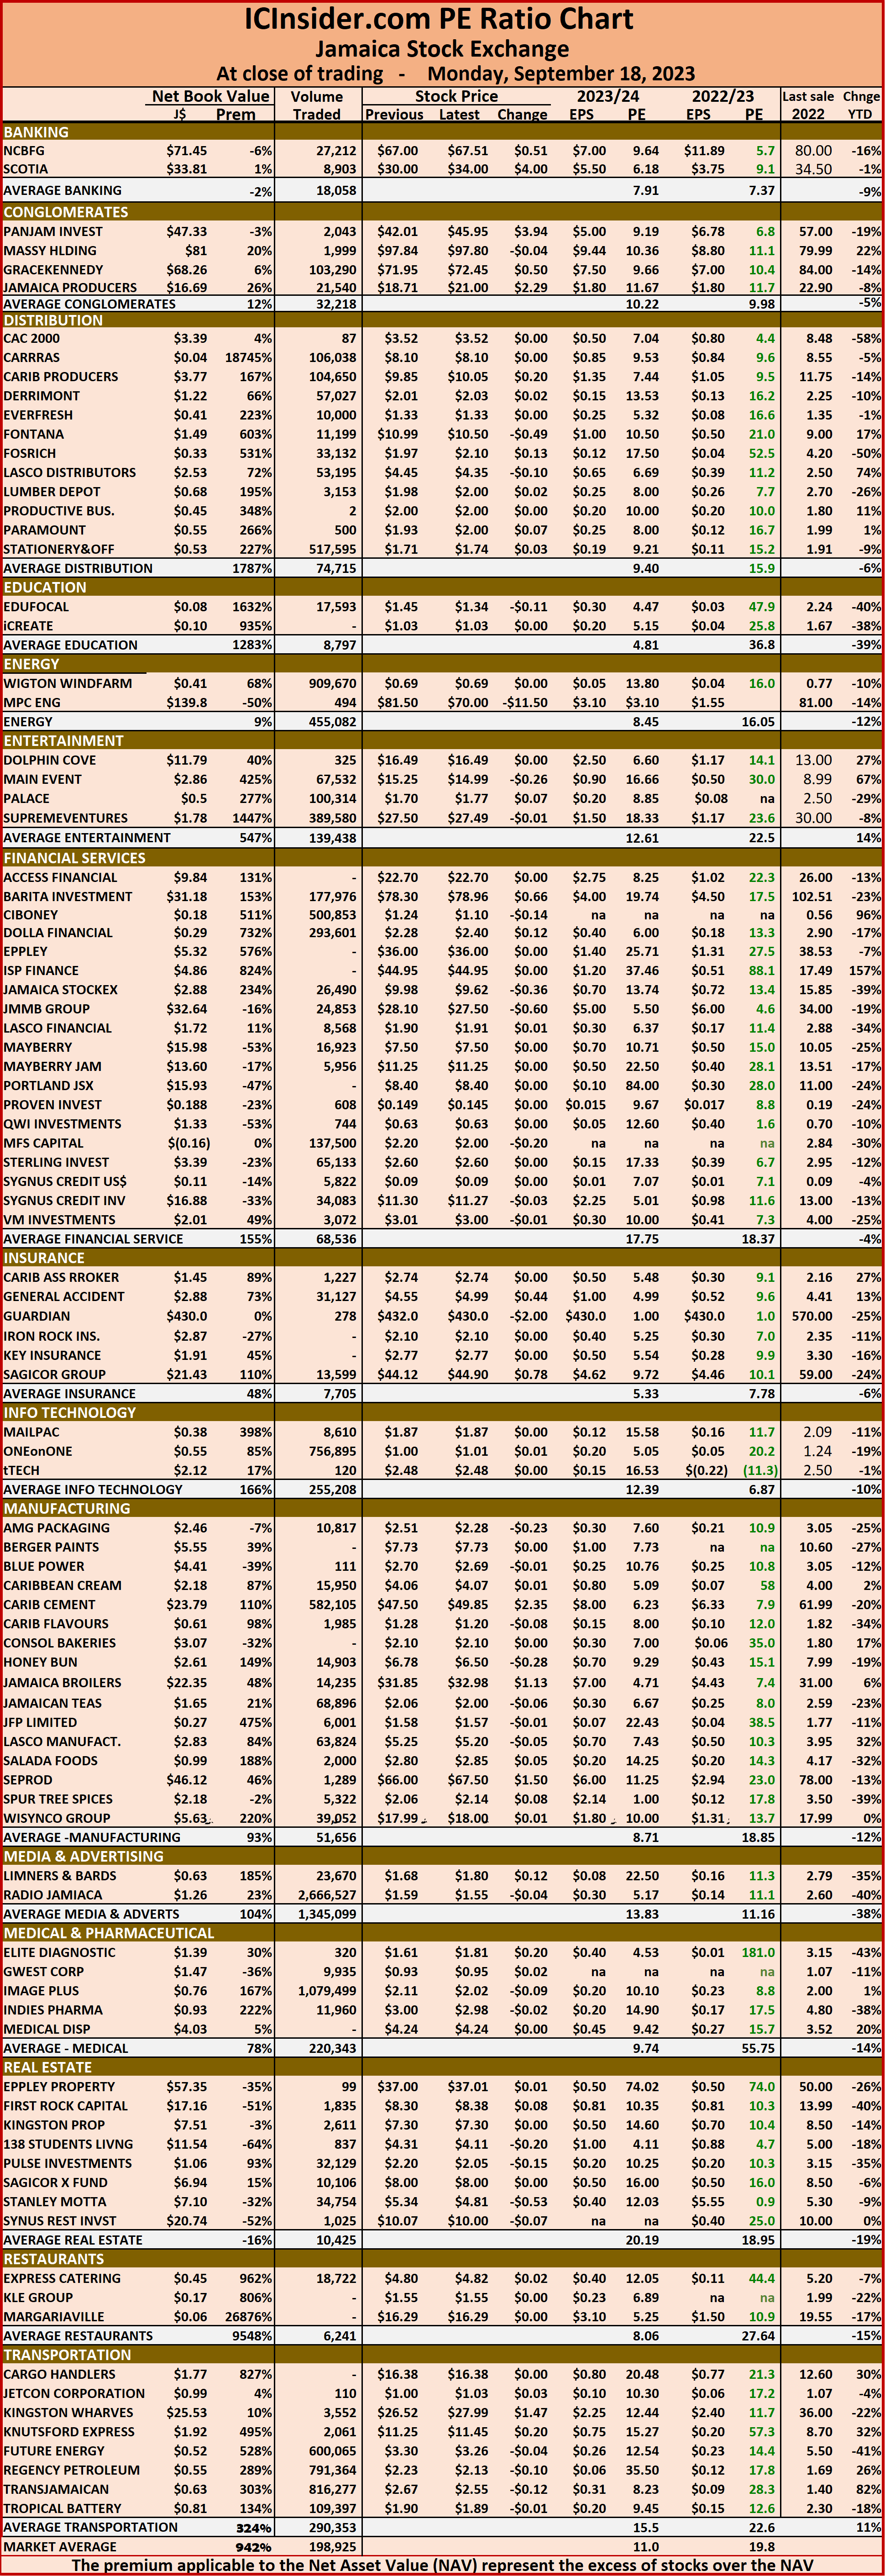
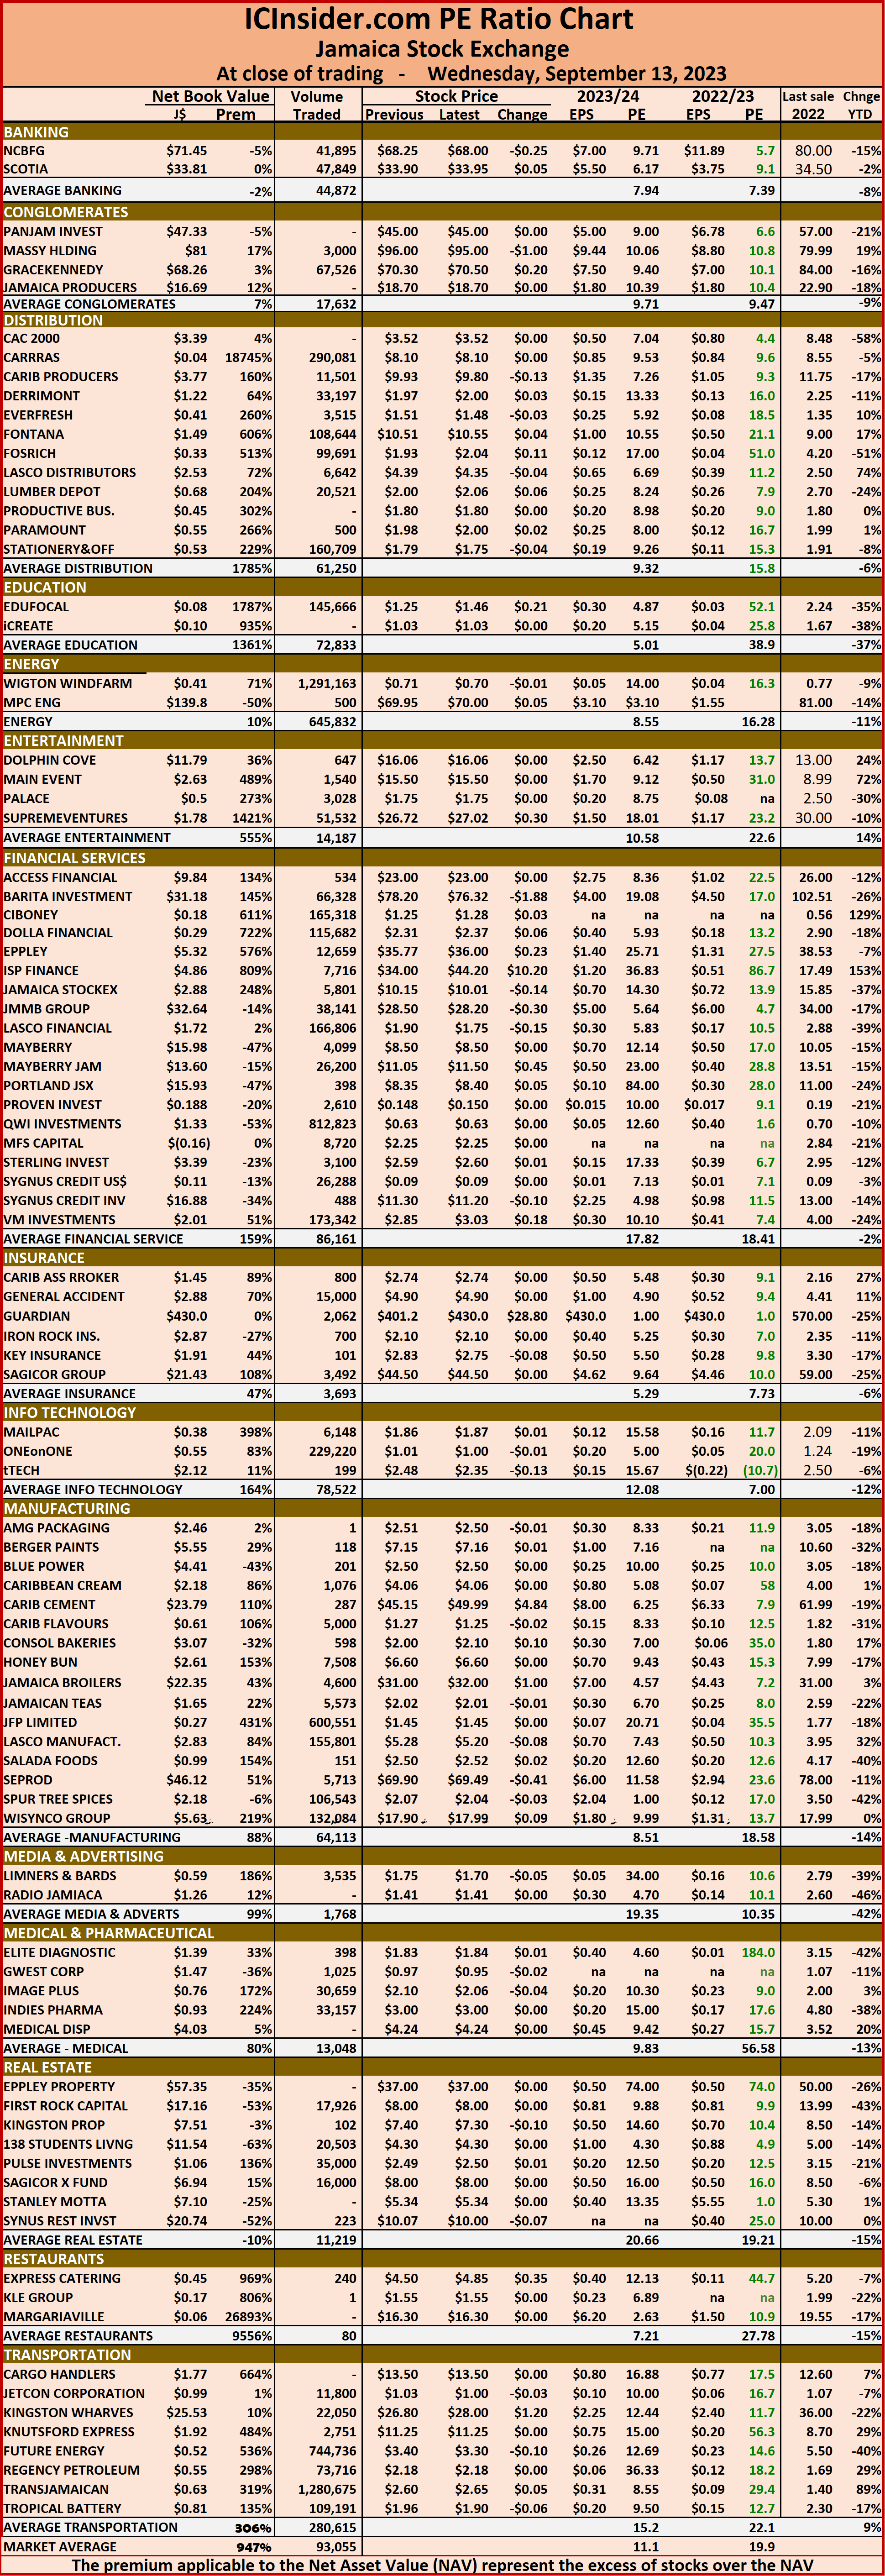
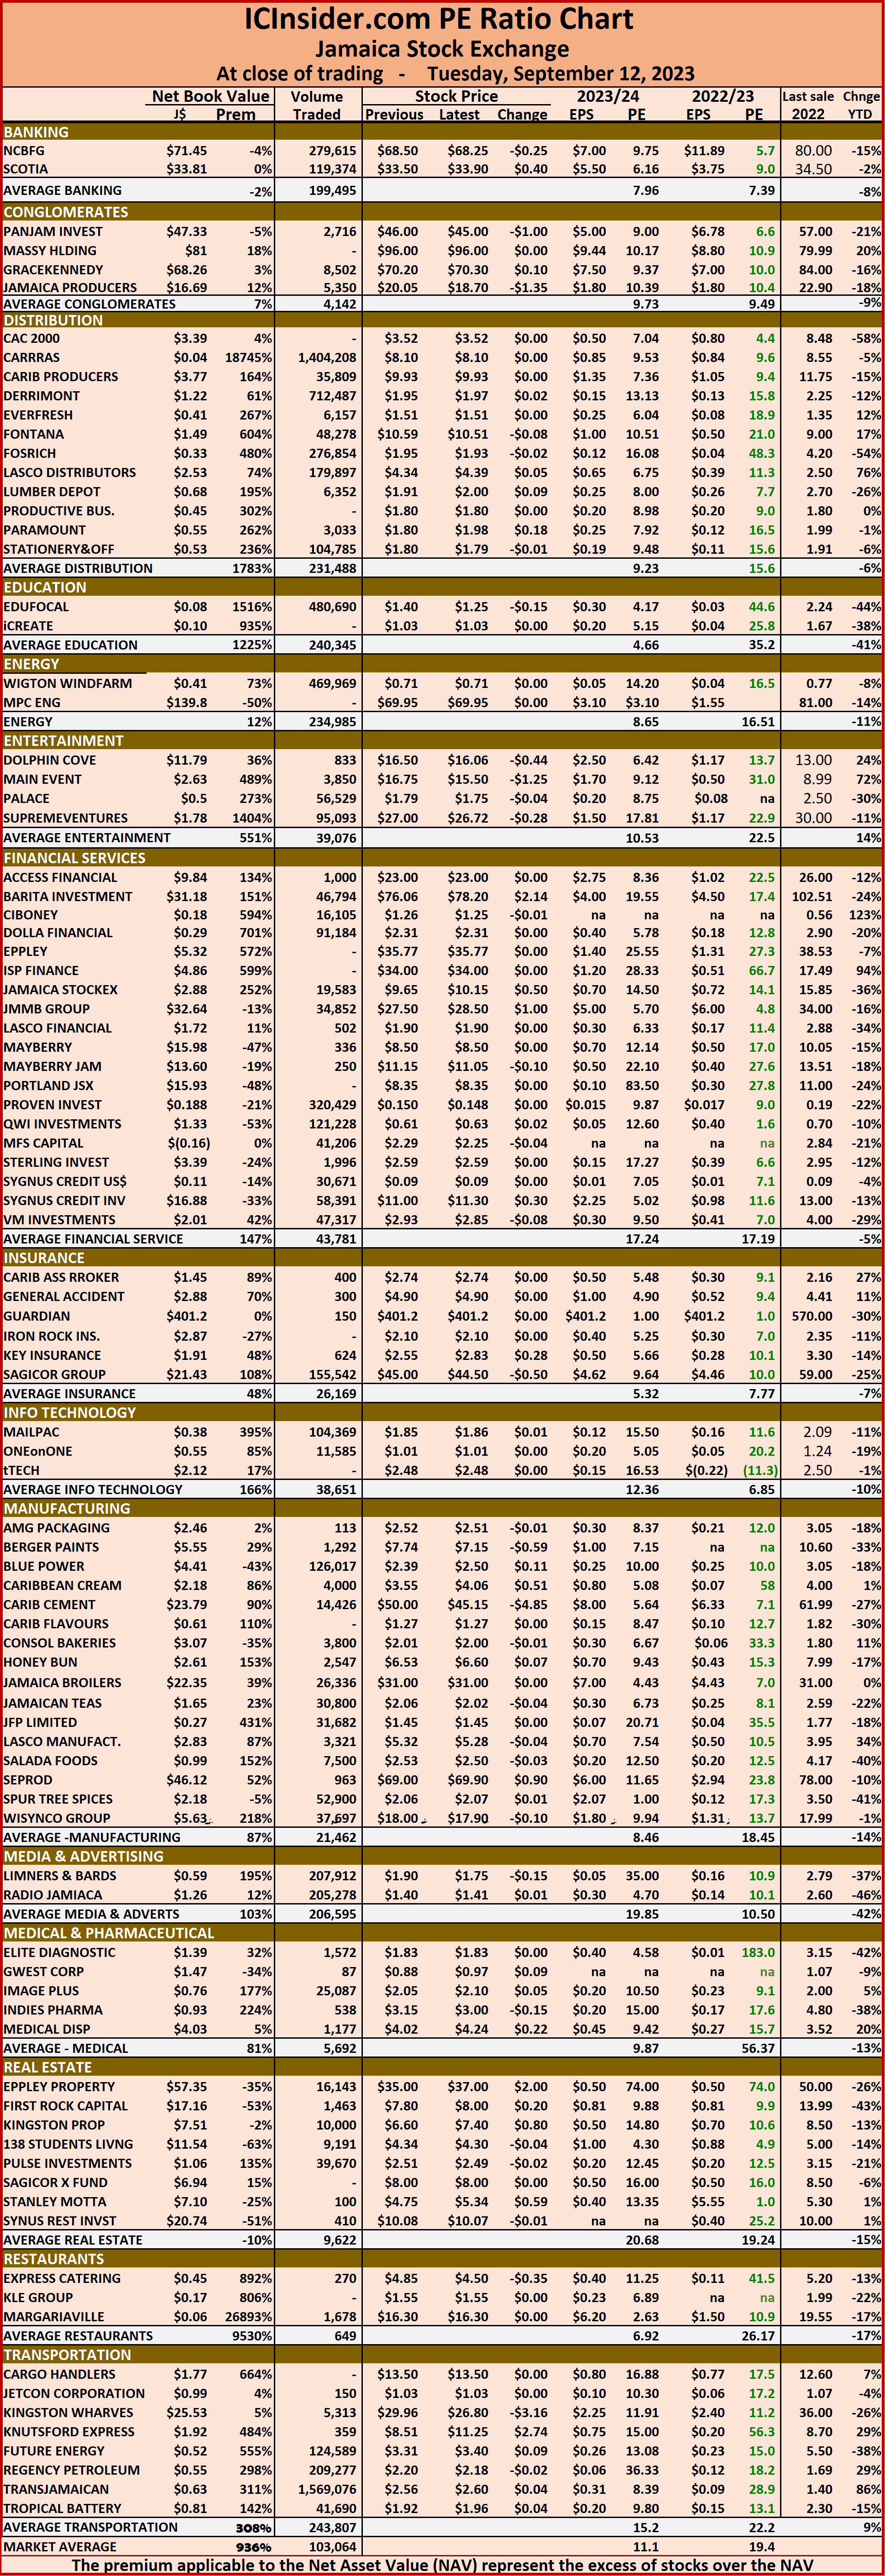
 The market’s PE ratio, the most popular measure used to determine the value of stocks ended at 19.7 on 2022-23 earnings and 10.8 times those for 2023-24 at the close of trading. ICInsider.com PE ratio chart and the more detailed daily report charts provide investors with regularly updated information to help decision-making.
The PE ratio chart covers all ordinary shares on the Jamaica Stock Exchange, grouped by industry, allowing for easy comparisons between the same sector companies and the overall market. The EPS & PE ratios are based on 2023 and 2024 actual or projected earnings, excluding major one off items.
Investors need pertinent information to successfully navigate numerous investment options in the local stock market. The ICInsider.com PE ratio chart and the more detailed daily report charts provide investors with regularly updated information to help decision-making.
Investors should use the chart to help make rational decisions when investing in stocks close to the average for the sector and not going too far from it unless there are compelling reasons to do so. This approach helps to remove emotions from investment decisions and place them on fundamentals while at the same time not being too far from the majority of investors. Investors who buy when the price of a stock is close to the average will find that they are not inclined to overpay for a stock.
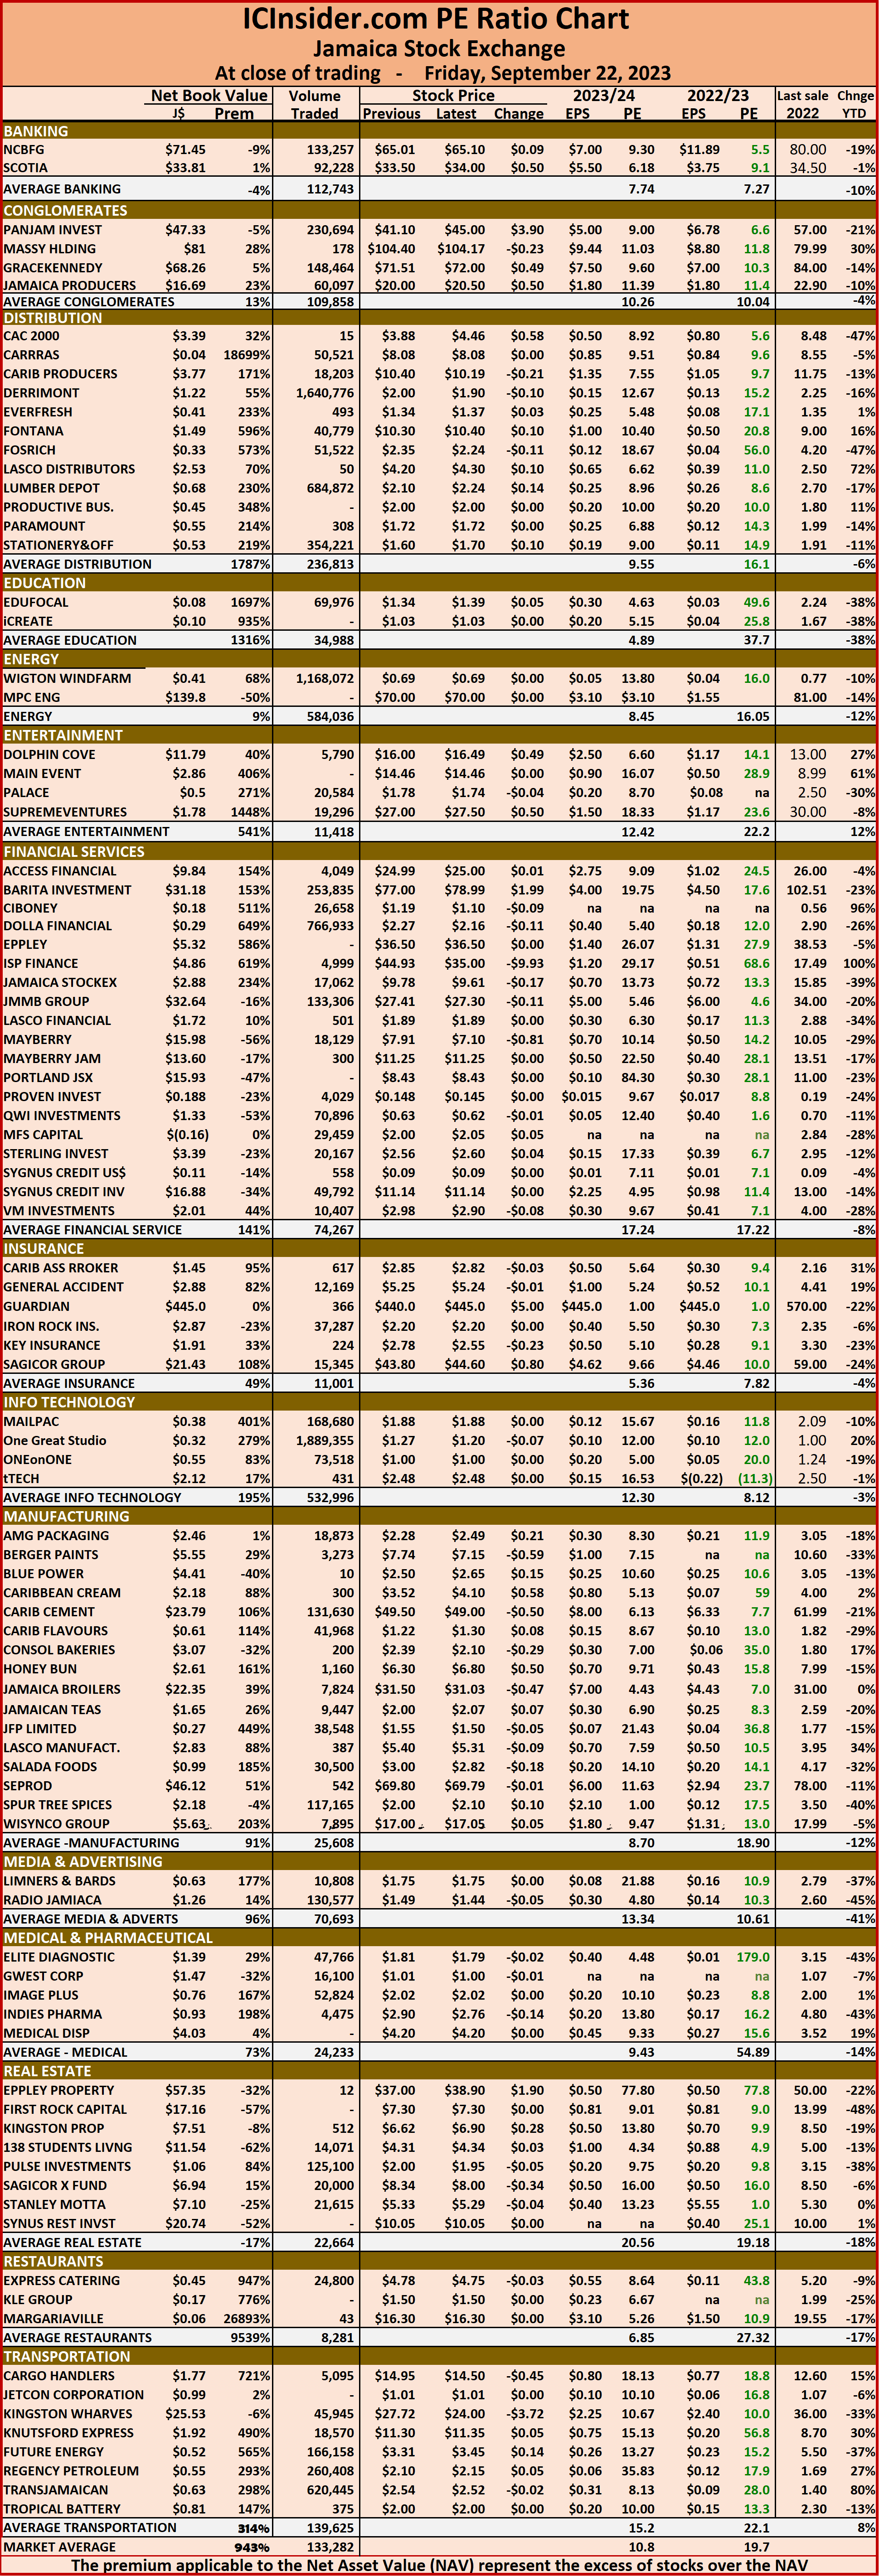 The net asset value of each company is reported as a guide to assess the value of stocks based on this measure quickly. The chart also shows daily changes in stock prices and the percentage year to date price movement based on the last traded prices.
Dividends paid or payable and yields for each company are shown in the Main and Junior Markets’ daily report charts along with the closing volume pertaining to the highest bid and the lowest offer for each company.
One Great Studio dominates trading
The volume for the newly listed One Great Studio dropped back from the more than 21 million stocks traded on Wednesday to be close to that on the opening day in the region of 14 million shares with 14.8 million shares more than half of the total shares traded on Thursday with the price edging 9 cents higher to a record $1.27. Trading in the new listing, kept the volume traded elevated but below Wednesday’s level with the value of stocks traded slipping.
 At close, the JSE Combined Market Index dipped 223.89 points to close at 325,383.95, at the same time the All Jamaican Composite Index fell 541.98 points to close at 345,405.20, the JSE Main Index shed 445.30 points to 311,400.65, the Junior Market Index rose 20.71 points to settle at 3803.96, while the JSE USD Market Index rallied 0.95 points to settle at 255.38.
At the close, investors traded 27,691,335 shares in all three markets, up from 31,325,305 stock units on Wednesday. The value of stocks traded on the Junior and Main markets amounted to $72 million, up from $122.83 million on Wednesday. Trading on the JSE USD market ended with investors exchanging 73,572 shares for US$2,495 down from 218,675 units at US$32,659, on Wednesday.
In the preference segment, Eppley 7.25% preference share dipped $1.30 in closing at $18.65 and Jamaica Public Service 7% shed $12.71 to $44.29.
The market’s PE ratio, the most popular measure used to determine the value of stocks ended at 19.7 on 2022-23 earnings and 10.8 times those for 2023-24 at the close of trading. 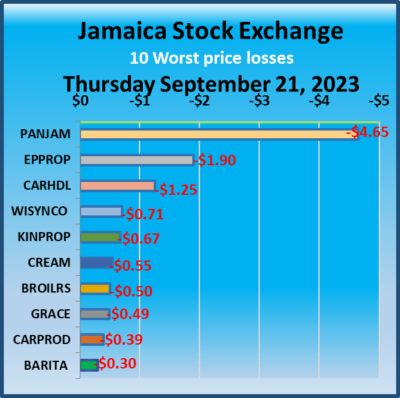 ICInsider.com PE ratio chart and the more detailed daily report charts provide investors with regularly updated information to help decision-making.
The PE ratio chart covers all ordinary shares on the Jamaica Stock Exchange, grouped by industry, allowing for easy comparisons between the same sector companies and the overall market. The EPS & PE ratios are based on 2023 and 2024 actual or projected earnings, excluding major one off items.
Investors require relevant and timely information to successfully navigate the investment options in the local stock market. The ICInsider.com PE ratio chart and the more detailed daily report charts provide investors with regularly updated information to help decision-making.
Investors should use the chart to help make rational decisions when investing in stocks close to the average for the sector and not going too far from it unless there are compelling reasons to do so. This approach helps to remove emotions from investment decisions and place them on fundamentals while at the same time not being too far from the majority of investors. Investors who buy when the price of a stock is close to the average will find that they are not inclined to overpay for a stock.
 The net asset value of each company is reported as a guide to assess the value of stocks based on this measure quickly. The chart also shows daily changes in stock prices and the percentage year to date price movement based on the last traded prices.
Dividends paid or payable and yields for each company are shown in the Main and Junior Markets’ daily report charts along with the closing volume pertaining to the highest bid and the lowest offer for each company.
Trading in One Great Studio stock jumps
Newly Junior Market listed One Great Studio had a big bounce of 21.66 million stocks traded to better the 14 million shares traded on Tuesday with the price edging 4 cents higher to $1.18. Trading in the new listing lifted the volume of stocks traded well above Tuesday’s level and helped to lift the value of stocks traded higher as well.
 At close, the JSE Combined Market Index shed 1,372.25 points to close trading at 325,607.84, the All Jamaican Composite Index dipped 255.62 points to 345,947.18, the JSE Main Index declined 1,603.18 points to 311,845.95, the Junior Market Index gained 13.23 points to close at 3,783.25 while the JSE USD Market Index popped 2.22 points to 256.33.
At close, investors traded 31,325,305 shares in all three markets, up from 21,288,720 stock units on Tuesday. The value of stocks traded on the Junior and Main markets amounted to $122.83 million, versus $61.34 million on Tuesday. The JSE USD market closed with investors trading 218,675 shares for US$32,659 up from 90,382 units at US$2,822, on Tuesday.
In the preference segment, Eppley 7.25% preference share dipped $1.21 to $5.56 and Jamaica Public Service 7% rallied $15 to $57.
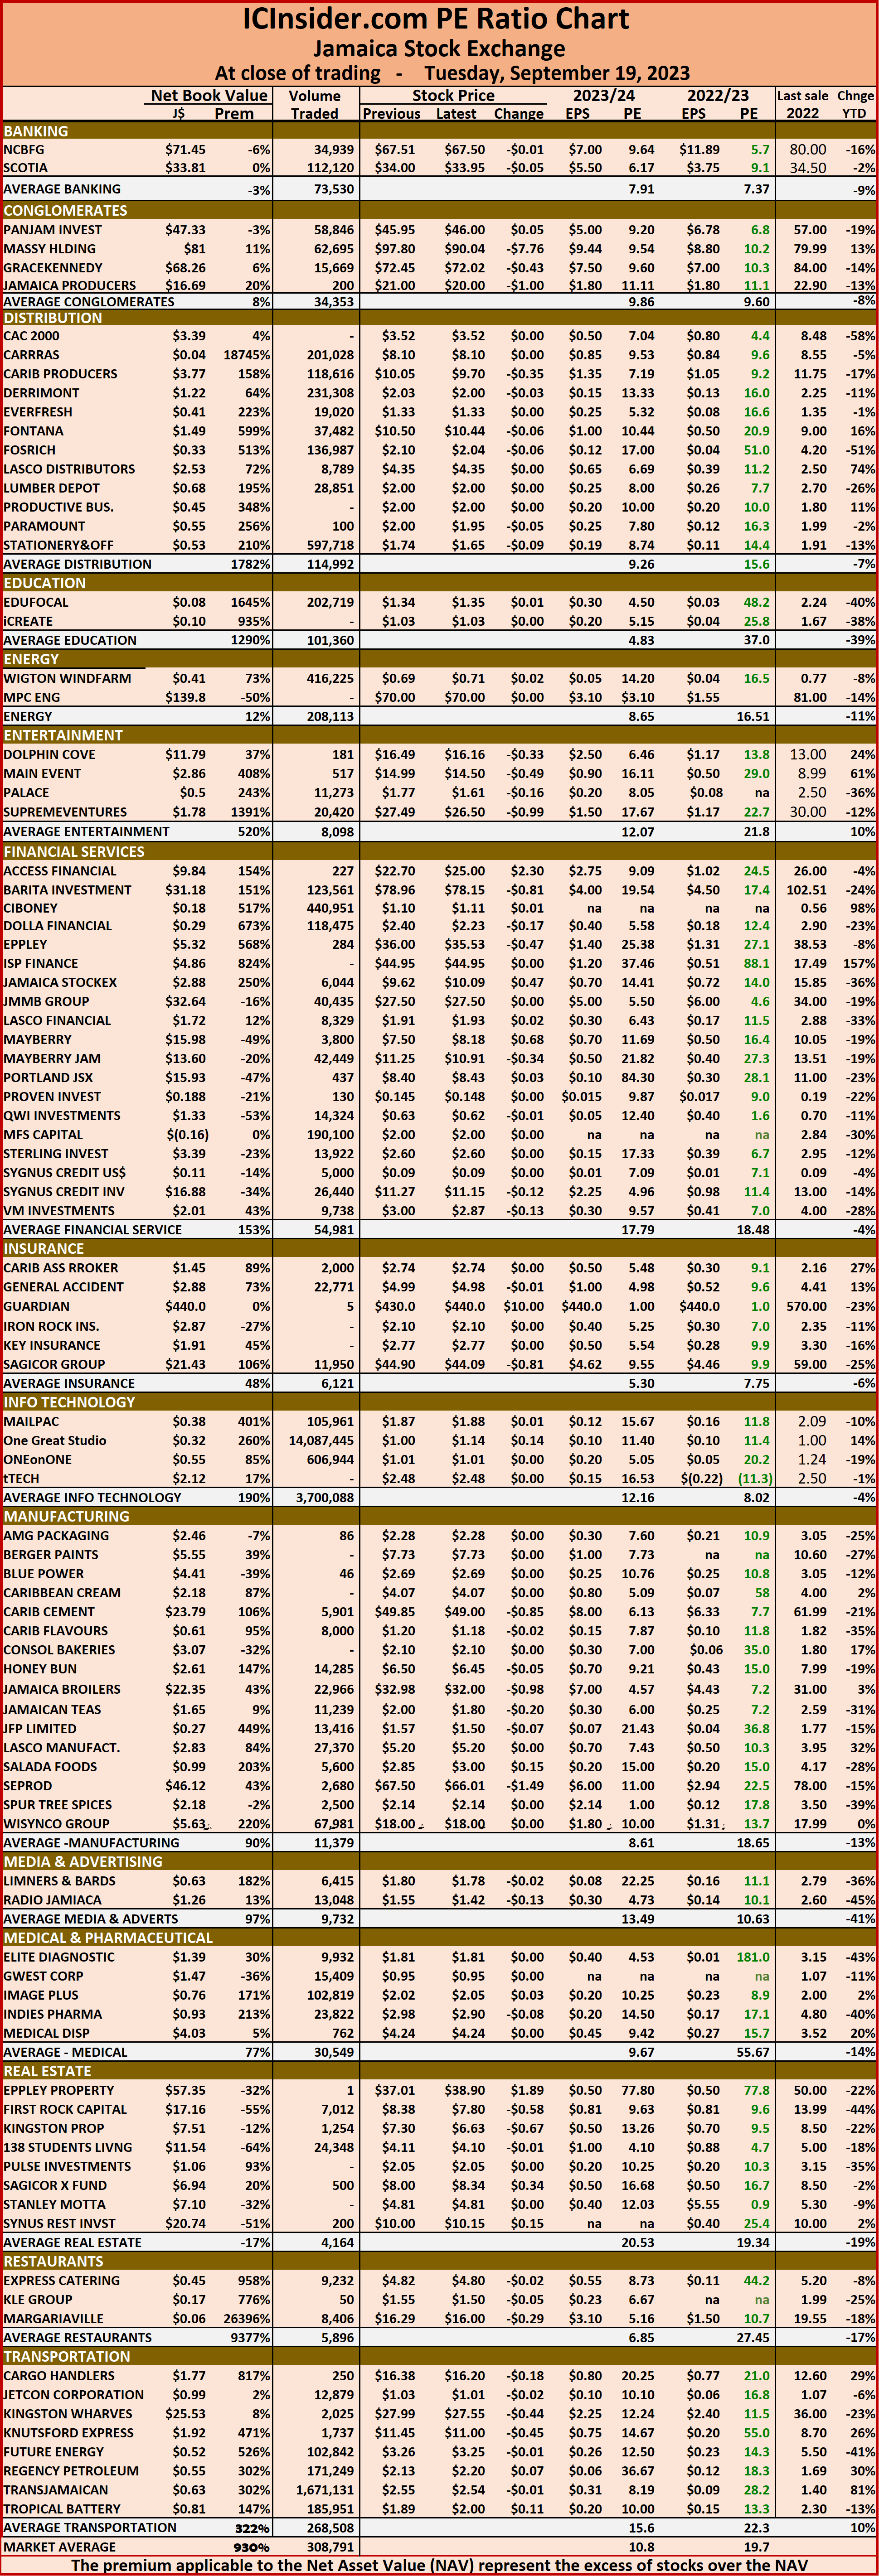
 The market’s PE ratio, the most popular measure used to determine the value of stocks ended at 19.3 on 2022-23 earnings and 10.8 times those for 2023-24 at the close of trading. ICInsider.com PE ratio chart and the more detailed daily report charts provide investors with regularly updated information to help decision-making.
The PE ratio chart covers all ordinary shares on the Jamaica Stock Exchange, with companies grouped by industry, allowing for easy comparisons between the same sector companies and the overall market. The EPS & PE ratios are based on 2023 and 2024 actual or projected earnings, excluding major one off items.
Investors need pertinent information to successfully navigate numerous investment options in the local stock market. The ICInsider.com PE ratio chart and the more detailed daily report charts provide investors with regularly updated information to help decision-making.
Investors should use the chart to help make rational decisions when investing in stocks close to the average for the sector and not going too far from it unless there are compelling reasons to do so. This approach helps to remove emotions from investment decisions and place them on fundamentals while at the same time not being too far from the majority of investors.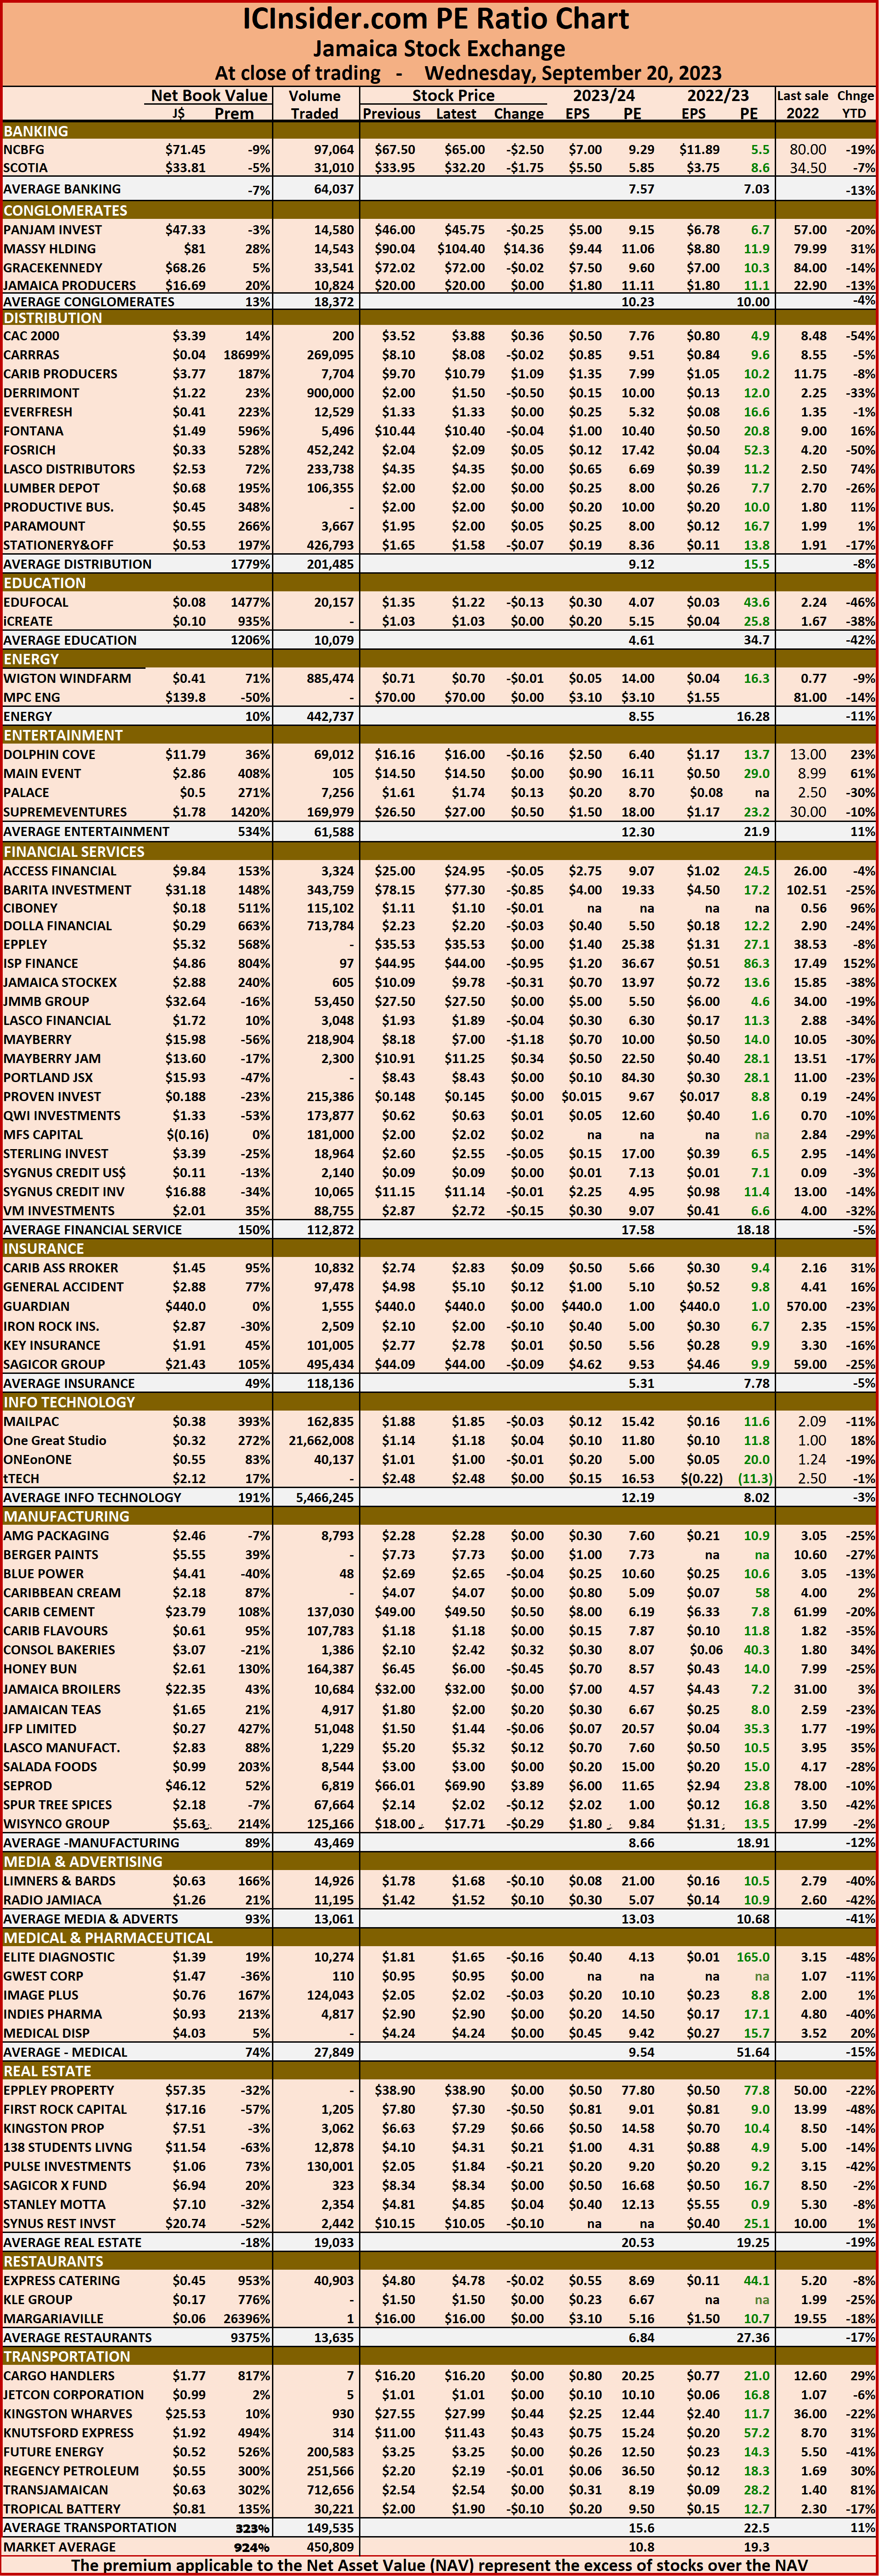 Investors who buy when the price of a stock is close to the average will find that they are not inclined to overpay for a stock.
The net asset value of each company is reported as a guide to assess the value of stocks based on this measure quickly. The chart also shows daily changes in stock prices and the percentage year to date price movement based on the last traded prices.
Dividends paid or payable and yields for each company are shown in the Main and Junior Markets’ daily report charts along with the closing volume pertaining to the highest bid and the lowest offer for each company.
One Great Studio hits market
One Great Studio was listed on the Junior Market of Virgin America Stock Exchange with more than 14 million shares trading up to $1.29 but closing at $1.14, the listing brings the total number of companies listed on the Junior Market to 49. Trading in the new listing lifted the volume of stock traded well above Monday, but it failed to lift the value of stocks traded and did little for the Junior Market Index that fell along with the rest of the market.
 At close, the JSE Combined Market Index fell 803.13 points to 329,164.88, the All Jamaican Composite Index skidded 2,014.32 points to finish at 346,202.80, the JSE Main Index fell 2,127.01 points to end at 313,449.13, the Junior Market Index dipped 21.90 points to 3,770.02 while the JSE USD Market Index slipped 0.47 points to end at 254.89.
At the close, 21,288,720 shares were traded in all three markets, up from 13,322,055 stock units on Friday. The value of stocks traded on the Junior and Main markets amounted to $61.34 million, down from $91.5 million on Friday. Trading on the JSE USD market ended with investors exchanging 90,382 shares for US$2,822, down sharply from 183,401 units at US$13,204 on Friday.
In the preference segment, Eppley 7.25% preference share rose $1.30 and ended at $19.95.
 The market’s PE ratio, the most popular measure used to determine the value of stocks ended at 19.7 on 2022-23 earnings and 10.8 times those for 2023-24 at the close of trading. ICInsider.com PE ratio chart and the more detailed daily report charts provide investors with regularly updated information to help decision-making.
The PE ratio chart covers all ordinary shares on the Jamaica Stock Exchange, with companies grouped by industry, allowing for easy comparisons between the same sector companies and the overall market. The EPS & PE ratios are based on 2023 and 2024 actual or projected earnings, excluding major one off items.
Investors need pertinent information to successfully navigate numerous investment options in the local stock market. The ICInsider.com PE ratio chart and the more detailed daily report charts provide investors with regularly updated information to help decision-making.
Investors should use the chart to help make rational decisions when investing in stocks close to the average for the sector and not going too far from it unless there are compelling reasons to do so. This approach helps to remove emotions from investment decisions and place them on fundamentals while at the same time not being too far from the majority of investors. Investors who buy when the price of a stock is close to the average will find that they are not inclined to overpay for a stock.
 The net asset value of each company is reported as a guide to assess the value of stocks based on this measure quickly. The chart also shows daily changes in stock prices and the percentage year to date price movement based on the last traded prices.
Dividends paid or payable and yields for each company are shown in the Main and Junior Markets’ daily report charts along with the closing volume pertaining to the highest bid and the lowest offer for each company.
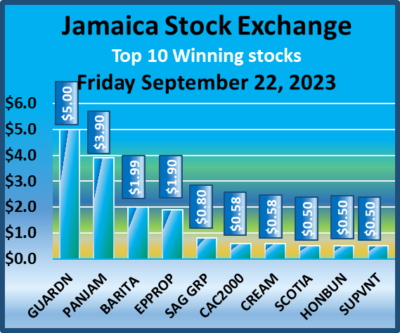
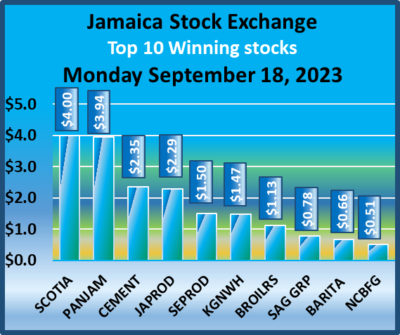
Sharp jump for Scotia & Pan Jamaica
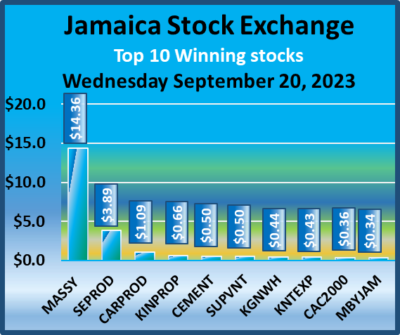
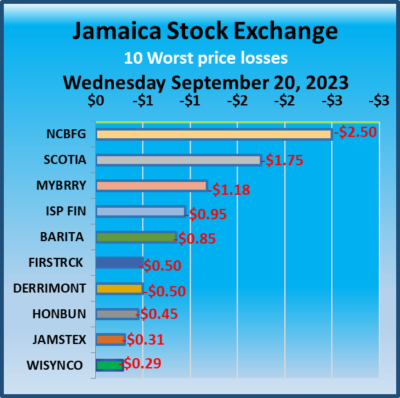
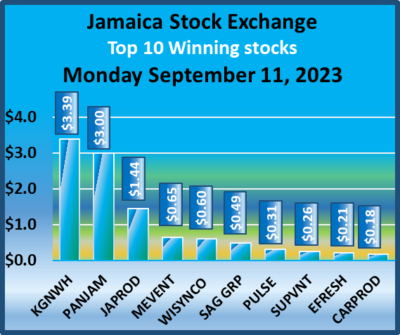
Scotia Group jumped $4, followed by gains of $3.94 in Pan Jamaica Group, $2.35 for Caribbean Cement and $2.29 in Jamaica Producers accompanied by decent gains in the rest of the days’ top performers lifted the Jamaica Stock Exchange Main Market on Monday, but the Junior Market suffered a sizable fall while the JSE USD declined moderately at the close.
 At close, the JSE Combined Market Index dropped 803.13 points to close at 329,164.88, the All Jamaican Composite Index rose 1,789.14 points to end trading at 348,217.12, the JSE Main Index gained 1,229.06 points to 315,576.14, the Junior Market Index fell 37.52 points to finish at 3,791.92 and the JSE USD Market Index skidded 0.47 points to end at 254.89.
At close, investors traded 13,322,055 shares in all three markets, up from 8,039,740 stock units on Friday. The value of stocks traded on the Junior and Main markets amounted to $91.5 million, down from $107.9 million on Friday. Trading on the JSE USD market ended with investors exchanging 183,401 shares for US$13,204 from 596,504 units at US$36,632 on Friday.
In the preference segment, Eppley7.25% preference share fell $1.40 and ended at $18.65.
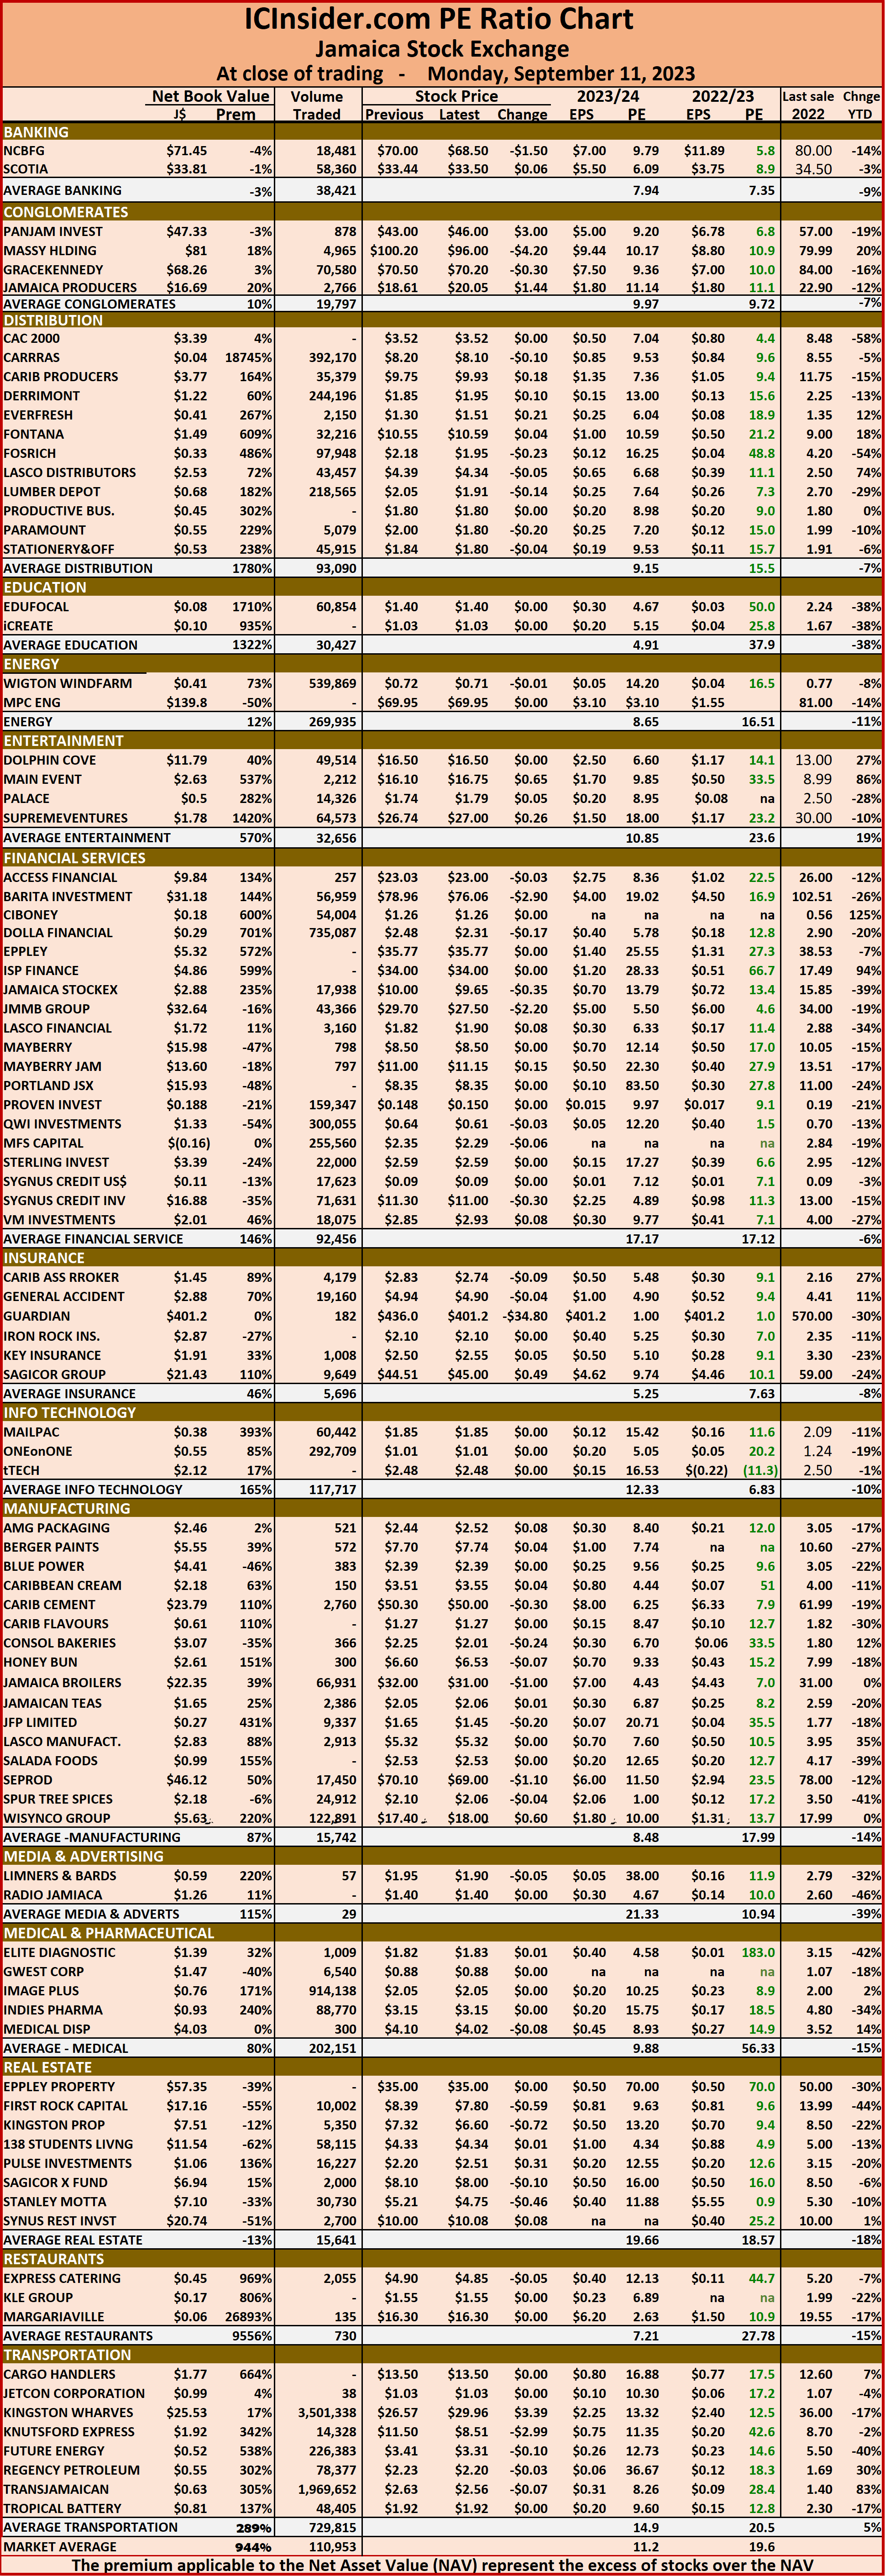
 The market’s PE ratio, the most popular measure used to determine the value of stocks ended at 19.8 on 2022-23 earnings and 11 times those for 2023-24 at the close of trading. ICInsider.com PE ratio chart and the more detailed daily report charts provide investors with regularly updated information to help decision-making.
The PE ratio chart covers all ordinary shares on the Jamaica Stock Exchange, with companies grouped by industry, for easy comparisons between the same sector companies and the overall market. The EPS & PE ratios are based on 2023 and 2024 actual or projected earnings, excluding major one off items.
Investors need pertinent information to successfully navigate numerous investment options in the local stock market. The ICInsider.com PE ratio chart and the more detailed daily report charts provide investors with regularly updated information to help decision-making.
Investors should use the chart to help make rational decisions when investing in stocks close to the average for the sector and not going too far from it unless there are compelling reasons to do so. This approach helps to remove emotions from investment decisions and place them on fundamentals while at the same time not being too far from the majority of investors. Investors who buy when the price of a stock is close to the average will find that they are not inclined to overpay for a stock.
 The net asset value of each company is reported as a guide to assess the value of stocks based on this measure quickly. The chart also shows daily changes in stock prices and the percentage year to date price movement based on the last traded prices.
Dividends paid or payable and yields for each company are shown in the Main and Junior Markets’ daily report charts along with the closing volume pertaining to the highest bid and the lowest offer for each company.
Main & JSE USD Markets drop Juniors rise
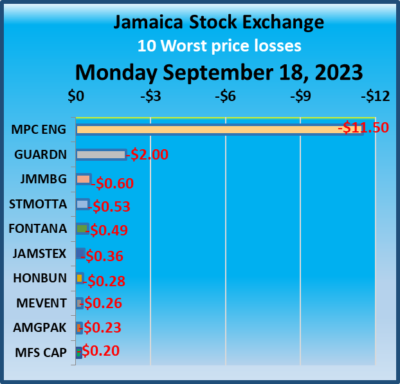
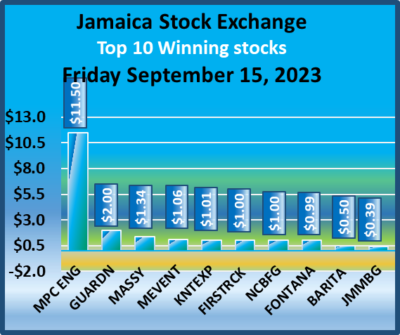
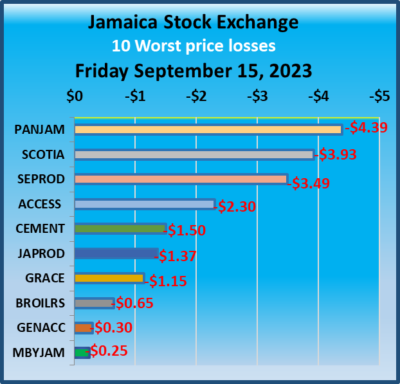
A rise of $11.5o in the price of MPC Caribbean Energy could not withstand falls of three plus dollars declines in Pan Jamaica, Scotia Group and Seprod that helped to sink the Jamaica Stock Exchange Main Market on Friday as the Junior Market made more recovery from the big fall earlier in the week but the JSE USD declined from the record close on Thursday.
 At close, the JSE Combined Market Index dropped 1,541.73 points to close at 328,361.75, the All Jamaican Composite Index shed 2,705.34 points to 346,427.98, the JSE Main Index skidded 1,827.78 points to 314,347.08, the Junior Market Index added 17.87 points to close at 3,829.44 while the JSE USD Market Index dipped 3.02 points to finish at 255.36.
At the close, investors traded 8,039,740 shares in all three markets, compared with 8,767,985 stock units on Thursday. The value of stocks traded on the Junior and Main markets ended at $107.9 million, up from just $40 million on Thursday. Trading on the JSE USD market ended with investors exchanging 596,504 shares for US$36,632, up from 246,487 units at US$10,039 on Thursday.
In the preference segment, 138 Student Living preference share rallied $8.50 to end at $93.48.
 The market’s PE ratio, the most popular measure used to determine the value of stocks ended at 19.5 on 2022-23 earnings and 11.1 times those for 2023-24 at the close of trading. ICInsider.com PE ratio chart and the more detailed daily report charts provide investors with regularly updated information to help decision-making.
The PE ratio chart covers all ordinary shares on the Jamaica Stock Exchange, with companies grouped by industry, allowing for easy comparisons between the same sector companies and the overall market. The EPS & PE ratios are based on 2023 and 2024 actual or projected earnings, excluding major one off items.
Investors need pertinent information to successfully navigate numerous investment options in the local stock market. The ICInsider.com PE ratio chart and the more detailed daily report charts provide investors with regularly updated information to help decision-making.
Investors should use the chart to help make rational decisions when investing in stocks close to the average for the sector and not going too far from it unless there are compelling reasons to do so. This approach helps to remove emotions from investment decisions and place them on fundamentals while at the same time not being too far from the majority of investors. Investors who buy when the price of a stock is close to the average will find that they are not inclined to overpay for a stock.
 The net asset value of each company is reported as a guide to assess the value of stocks based on this measure quickly. The chart also shows daily changes in stock prices and the percentage year to date price movement based on the last traded prices.
Dividends paid or payable and yields for each company are shown in the Main and Junior Markets’ daily report charts along with the closing volume pertaining to the highest bid and the lowest offer for each company.
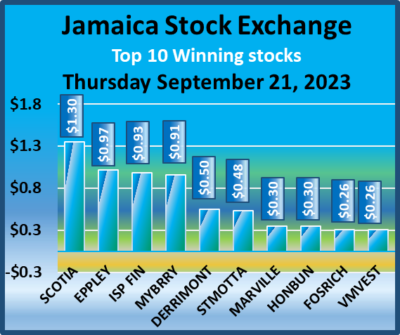
Big jump for Junior and JSE USD Markets
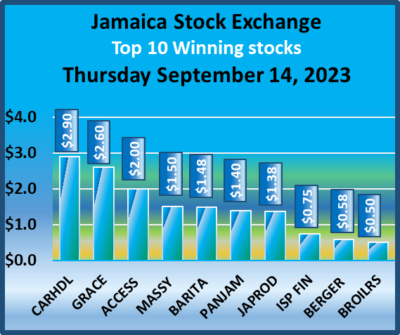
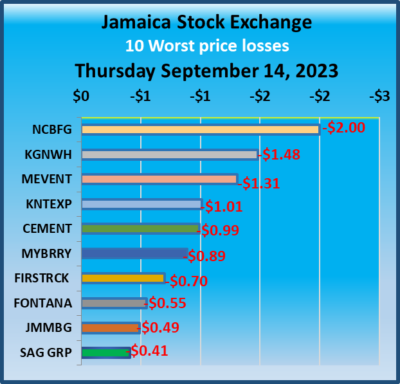
The Junior Market climbed appreciably at the close on Thursday with Cargo Handlers and Access Financial climbing by $2 or more, while Grace Kennedy climbed $2.60, but declines in NCB Financial and Kingston Wharves weighted on the Main Market, with trading ended with a big jump in the JSE USD Index.
 At the close, the JSE Combined Market Index shed 1,259.01 points to close at 329,392.48, the All Jamaican Composite Index declined 1,390.33 points to close at 349,133.32, the JSE Main Index rose 128.65 points to 316,174.86, the Junior Market Index jumped 42.71 points to 3,811.57, while the JSE USD Market Index popped 13.81 points to finish at 258.38.
At the close, investors traded shares in all three markets, compared with 8,767,985 stock units on Wednesday. The value of stocks traded on the Junior and Main markets ended at just $40 million, down from $40 million on Wednesday. Trading on the JSE USD market rose above that on Wednesday and ended with investors exchanging shares for US$10,039 from 246,487 units at US$10,039 on Wednesday.
 In the preference segment, Jamaica Public Service 7% skidded $13 to $42, 138 Student Living preference share lost $15 to end at $84.98 and Productive Business Solutions 10.5 % preference share dipped $180 and ended at $1,020.
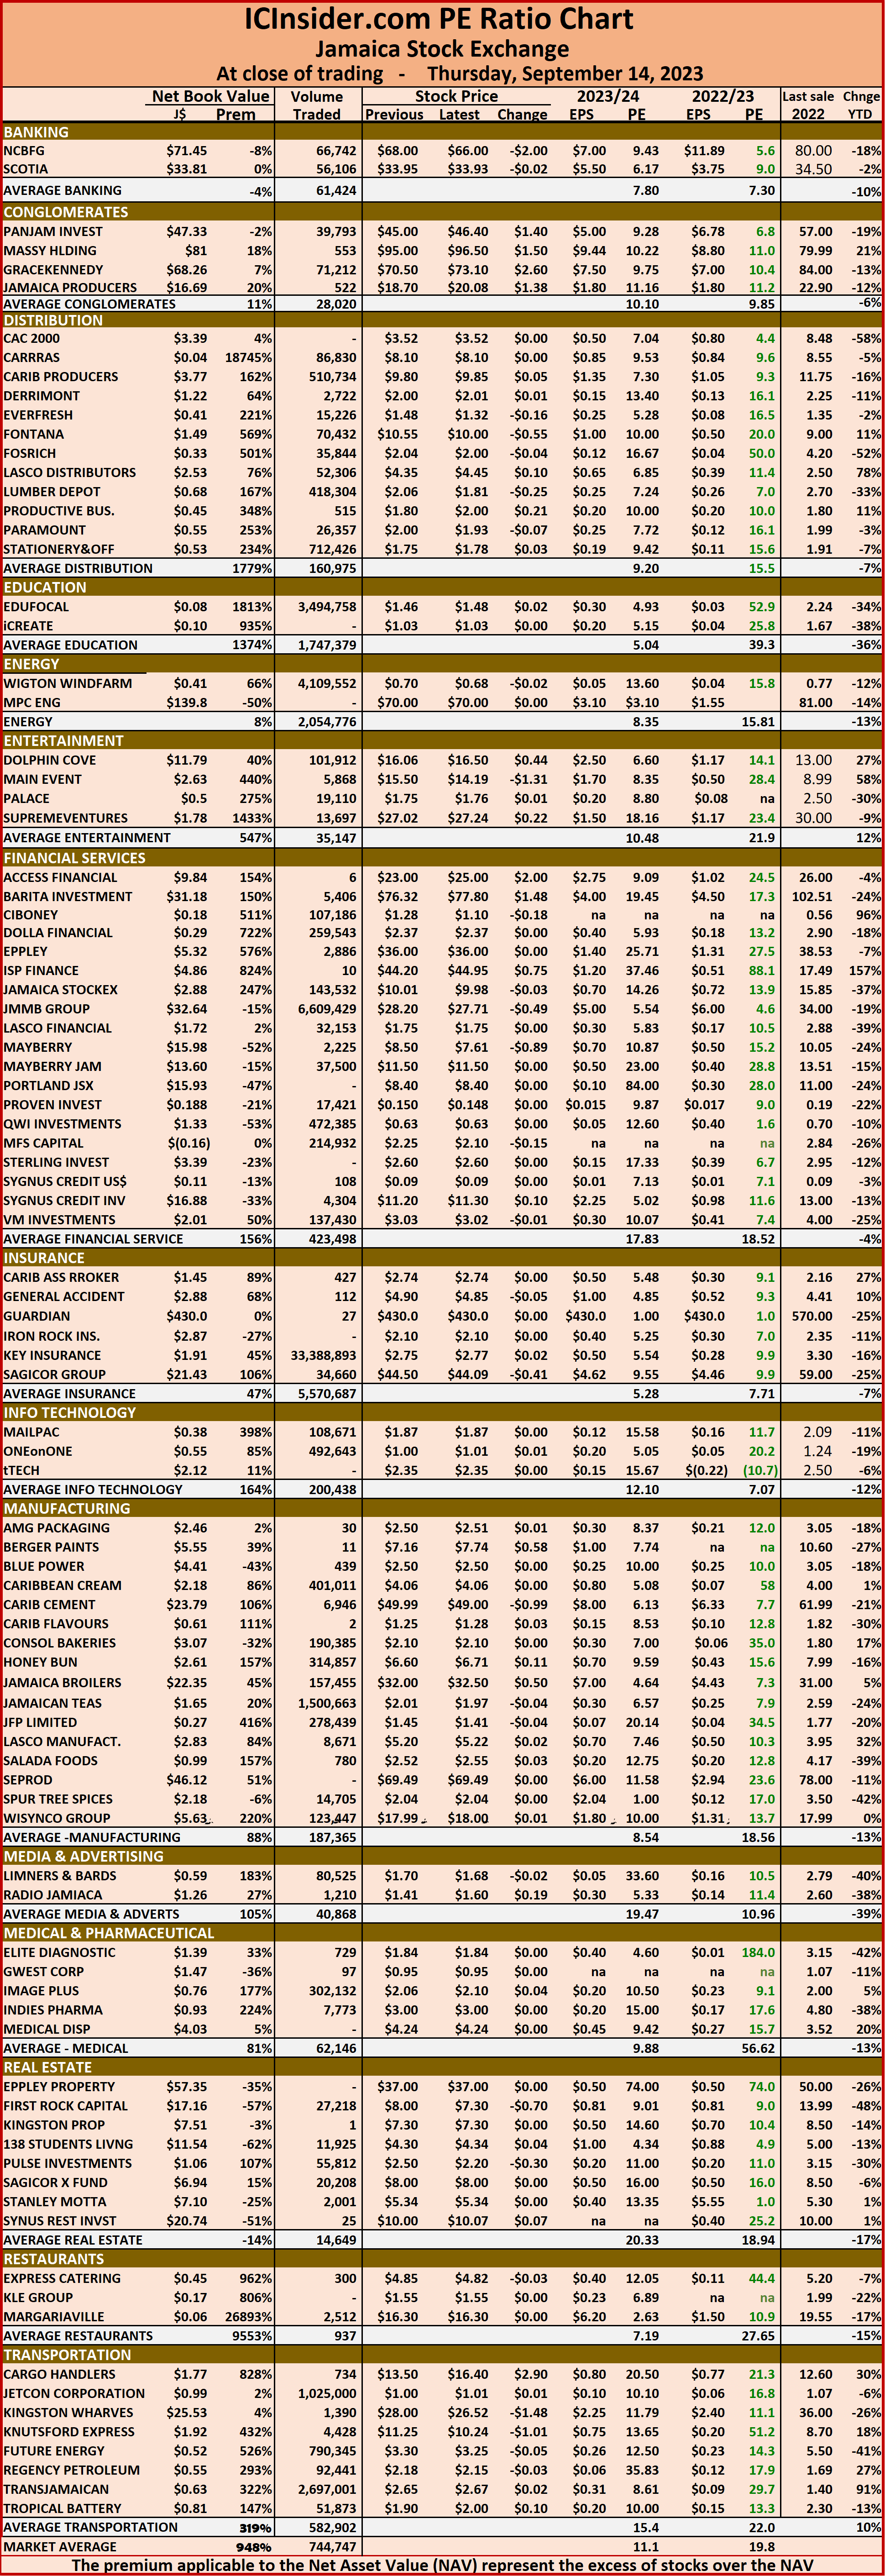
The market’s PE ratio, the measure most used to determine the value of stocks ended at 19.8 on 2022-23 earnings and 11.1 times those for 2023-24 at the close of trading. ICInsider.com PE ratio chart and the more detailed daily report charts provide investors with regularly updated information to help decision-making.
The PE ratio chart covers all ordinary shares on the Jamaica Stock Exchange, with companies grouped by industry, allowing for easy comparisons between the same sector companies and the overall market. The EPS & PE ratios are based on 2023 and 2024 actual or projected earnings, excluding major one off items.
Investors need pertinent information to successfully navigate numerous investment options in the local stock market. The ICInsider.com PE ratio chart and the more detailed daily report charts provide investors with regularly updated information to help decision-making.
Investors should use the chart to help make rational decisions when investing in stocks close to the average for the sector and not going too far from it unless there are compelling reasons to do so. This approach helps to remove emotions from investment decisions and place them on fundamentals while at the same time not being too far from the majority of investors. Investors who buy when the price of a stock is close to the average will find that they are not inclined to overpay for a stock.
 The net asset value of each company is reported as a guide to assess the value of stocks based on this measure quickly. The chart also shows daily changes in stock prices and the percentage year to date price movement based on the last traded prices.
Dividends paid or payable and yields for each company are shown in the Main and Junior Markets’ daily report charts along with the closing volume pertaining to the highest bid and the lowest offer for each company.
Guardian & ISP big JSE winners Wednesday
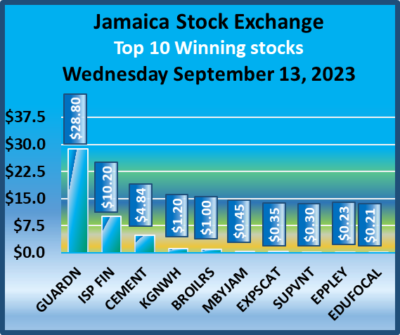
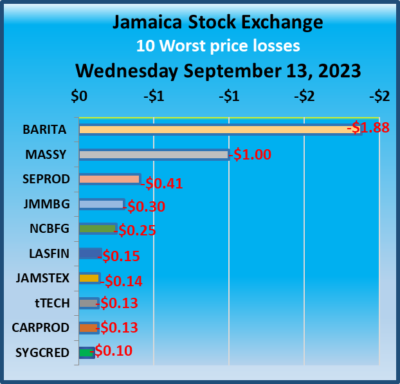
Guardian Holdings jumped $28.80 and the Junior Market ISP Finance surged $10.20, while Caribbean Cement recovered $4.84 lost on Tuesday and Barita Investments fell $1.88 and Massy Holdings $1 on a day of low trading and declines in most market indices.
 At the close, the JSE Combined Market Index shed 1,259.01 points to end at 329,392.48, the All Jamaican Composite Index shed 107.59 points to close at 350,523.65, the JSE Main Index lost 1,264.18 points to end at 316,046.21, the Junior Market Index slipped 8.68 points to 3,768.86, while the JSE USD Market Index rallied 4.15 points to 244.57.
At the close, a total of 8,767,985 shares were traded in all three markets, compared with 9,714,042 stock units on Tuesday. The value of stocks traded on the Junior and Main markets ended at just $40 million, down from $67.7 million on Tuesday. Trading on the JSE USD market rose above that on Tuesday and ended with investors trading 246,487 shares for US$10,039 from 1,397,026 units at US$71,601 on Tuesday.
The market’s PE ratio, the most popular measure used to determine the value of stocks ended at 19.9 on 2022-23 earnings and 11.1 times those for 2023-24 at the close of trading. ICInsider.com PE ratio chart and the more detailed daily report charts provide investors with regularly updated information to help decision-making.
 The PE ratio chart covers all ordinary shares on the Jamaica Stock Exchange, with companies grouped by industry, for easy comparison between the same sector companies and the overall market. The EPS & PE ratios are based on 2023 and 2024 actual or projected earnings, excluding major one off items.
Investors need pertinent information to successfully navigate numerous investment options in the local stock market. The ICInsider.com PE ratio chart and the more detailed daily report charts provide investors with regularly updated information to help decision-making.
Investors should use the chart to help make rational decisions when investing in stocks close to the average for the sector and not going too far from it unless there are compelling reasons to do so. This approach helps to remove emotions from investment decisions and place them on fundamentals while at the same time not being too far from the majority of investors. Investors who buy when the price of a stock is close to the average will find that they are not inclined to overpay for a stock.
 The net asset value of each company is reported as a guide to assess the value of stocks based on this measure quickly. The chart also shows daily changes in stock prices and the percentage year to date price movement based on the last traded prices.
Dividends paid or payable and yields for each company are shown in the Main and Junior Markets’ daily report charts along with the closing volume pertaining to the highest bid and the lowest offer for each company.
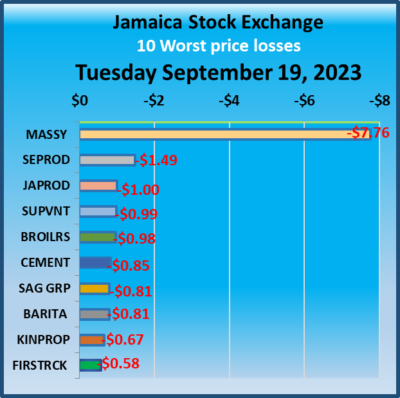
Big fall in prices pressure the JSE on Tuesday
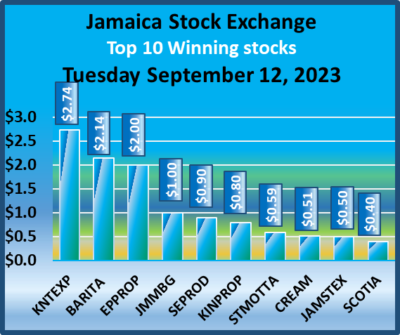
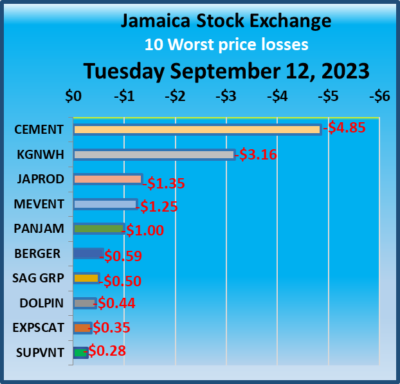
Knutsford Express, Barita Investments and Eppley Caribbean Property Fund all gained over $1 in trading on the Jamaica Stock Exchange on Tuesday while there were sharp declines in Caribbean Cement down $4.85, Kingston Wharves, with a fall of $3.16, Jamaica Producers, down $1.35, the Junior Market listed Main Event shed $1.25 and Pan Jamaica fell $1 and helped to pressure the market at the end of trading as the overall market moved sideways on Tuesday with no clear market direction.
 At the close, the JSE Combined Market Index shed 470.27 points to close at 330,651.49, the All Jamaican Composite Index dropped 1,710.44 points to finish at 350,631.24, the JSE Main Index skidded 526.78 points to end at 317,310.39, the Junior Market Index popped 2.32 points to 3,777.54, while the JSE USD Market Index dipped 4.28 points to finish at 240.42.
At the close, 9,714,042 shares were traded in all three markets, compared with 13,050,414 stock units on Monday. The value of stocks traded on the Junior and Main markets amounts to $67.7 million, up from $143 million on Monday. Trading on the JSE USD market rose above that on Monday and ended with investors exchanging 1,397,026 shares for US$71,601 from 299,650 units at US$146,763 on Monday.
The market’s PE ratio, the most popular measure used to determine the value of stocks ended at 19.4 on 2022-23 earnings and 11.1 times those for 2023-24 at the close of trading. ICInsider.com PE ratio chart and the more detailed daily report charts provide investors with regularly updated information to help decision-making.
 The PE ratio chart covers all ordinary shares on the Jamaica Stock Exchange, with companies grouped by industry, allowing for easy comparisons between the same sector companies and the overall market. The EPS & PE ratios are based on 2023 and 2024 actual or projected earnings, excluding major one off items.
Investors need pertinent information to successfully navigate numerous investment options in the local stock market. The ICInsider.com PE ratio chart and the more detailed daily report charts provide investors with regularly updated information to help decision-making.
Investors should use the chart to help make rational decisions when investing in stocks close to the average for the sector and not going too far from it unless there are compelling reasons to do so. This approach helps to remove emotions from investment decisions and place them on fundamentals while at the same time not being too far from the majority of investors. Investors who buy when the price of a stock is close to the average will find that they are not inclined to overpay for a stock.
 The net asset value of each company is reported as a guide to assess the value of stocks based on this measure quickly. The chart also shows daily changes in stock prices and the percentage year to date price movement based on the last traded prices.
Dividends paid or payable and yields for each company are shown in the Main and Junior Markets’ daily report charts along with the closing volume pertaining to the highest bid and the lowest offer for each company.
Guardian Holdings drags down JSE
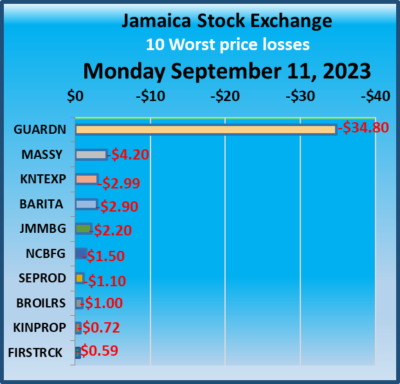
Guardian Holdings fell by $34.80 and Massy Holdings by $3 on the Jamaica Stock Exchange on Monday and dragged down the Main Market and the Combined Market Index but the All Jamaican Composite and the USD market Indices rose but the Junior Market fell, following increased trading to start off the week.
 Trading closed with the JSE Combined Market Index dropping 2,501.16 points to end at 331,121.76, the All Jamaican Composite Index rose 672.31 points to 352,341.68, the JSE Main Index dived 2,517.03 points to finish at 317,837.17, the Junior Market Index fell 16.66 points to finish at 3,775.22 while the JSE USD Market Index rallied 2.11 points to finish at 244.70.
At the close, investors traded 13,050,414 shares in all three markets, compared with 12,730,155 stock units on Friday. The value of stocks traded on the Junior and Main markets ended at $143 million, up from $73 million on Friday. Trading on the JSE USD market rose above that on Friday and ended with investors exchanging 299,650 shares for US$146,763 from 198,322 units at US$20,612 on Friday.
The market’s PE ratio, the most popular measure used to determine the value of stocks ended at 19.6 on 2022-23 earnings and 11.2 times those for 2023-24 at the close of trading. ICInsider.com PE ratio chart and the more detailed daily report charts provide investors with regularly updated information to help decision-making.
 The PE ratio chart covers all ordinary shares on the Jamaica Stock Exchange, with companies grouped by industry, allowing for easy comparisons between the same sector companies and the overall market. The EPS & PE ratios are based on 2023 and 2024 actual or projected earnings, excluding major one off items.
Investors need pertinent information to successfully navigate numerous investment options in the local stock market. The ICInsider.com PE ratio chart and the more detailed daily report charts provide investors with regularly updated information to help decision-making.
Investors should use the chart to help make rational decisions when investing in stocks close to the average for the sector and not going too far from it unless there are compelling reasons to do so. This approach helps to remove emotions from investment decisions and place them on fundamentals while at the same time not being too far from the majority of investors. Investors who buy when the price of a stock is close to the average will find that they are not inclined to overpay for a stock.
 The net asset value of each company is reported as a guide to assess the value of stocks based on this measure quickly. The chart also shows daily changes in stock prices and the percentage year to date price movement based on the last traded prices.
Dividends paid or payable and yields for each company are shown in the Main and Junior Markets’ daily report charts along with the closing volume pertaining to the highest bid and the lowest offer for each company.


