Transjamaican Highway traded 99 percent of all the shares traded on the Jamaica Stock Exchange US dollar market on Monday, driving the volume of stocks traded up by 2,402 percent with a 546 percent greater value than on Friday, resulting from an exchange of seven securities, compared with six on Friday with prices of three rising, one declining and three ending unchanged.
 The market closed with an exchange of 20,195,931 shares for US$634,902 well above the 807,161 stocks that were exchanged on Friday for US$98,342.
Trading averaged 2,885,133 shares at US$90,700, substantially surpassing the 134,527 stocks at just US$16,390 on Friday. Trading for the month to date averages 541,837 units at US$19,752 up from 44,775 stocks at US$4,703 on the previous day and March that ended with an average of 92,288 units for US$8,588.
The US Denominated Equities Index increased 3.15 points to 212.90. The Investor’s Choice bid-offer indicator shows four stocks ending with bids higher than their last selling prices and one with a lower offer.
The PE Ratio, one of the best known measures to determine appropriate stock values, averages 10.8. The PE ratio is calculated based on last traded prices divided by projected earnings, computed by ICInsider.com for companies with financial year ending around August 2025.
At the close of the market, Productive Business Solutions ended at US$1.45 with investors dealing in 23 shares, Proven Investments rose 1.5 cents to 10.5 US cents with 187 stock units clearing the market, Sygnus Credit Investments declined 0.31 of one cent and ended at 6 US cents with investors trading 76,228 shares and  Transjamaican Highway gained 0.09 of one cent to finish at 2.55 US cents with 20,050,886 units changing hands.
In the preference segment, JMMB Group 7.5% preferred share remained at US$2 with traders dealing in 60,000 stocks, JMMB Group US8.5% preference share ended at US$1.03 with 8,591 shares crossing the market and Sygnus Credit Investments US 8% popped 5 cents to US$8.25 in trading 16 stocks.
Prices of securities trading are those for the last transaction of each stock unless otherwise stated.
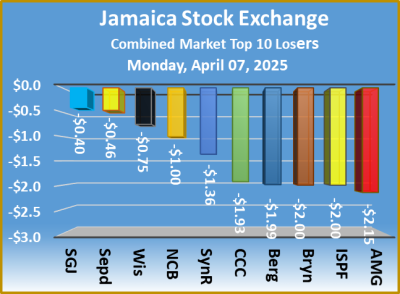
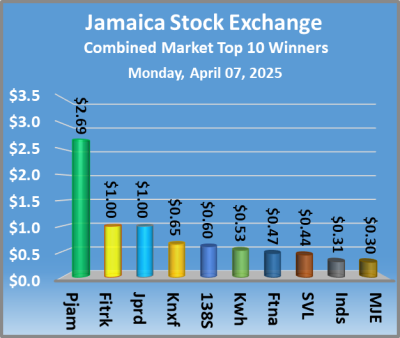 At the close of the market, the JSE Combined Market Index lost 2,429.88 points to 333,268.61, the All Jamaican Composite Index dropped 2,074.94 points to close at 372,966.31, while the JSE Main Index declined by 2,280.68 points to 322,094.84, the Junior Market Index skidded 34.58 points to finish at 3,522.92 and the JSE USD Market Index rallied 3.15 points to 212.95.
 The market’s PE ratio, the most popular measure used to value stocks, ended at 12.5 based on 2024-25 earnings and 19.4 based on 2024 historical earnings. The ICInsider.com PE ratio chart and the other more detailed daily charts provide investors with regularly updated information to help in decision-making. The PE ratio chart covers all ordinary shares listed on the Jamaica Stock Exchange, grouped by industry, allowing for easy comparisons within a sector and the overall market. The earnings per share (EPS) and PE ratios are based on 2024 and 2025 actual or projected earnings, excluding any major one-time income or expense.
 Investors who buy when the price of a stock is close to the average will find that they are not inclined to overpay for a stock. The net asset value of each company is incorporated into the chart. Investors can use this measure in assessing stock values. The chart also shows daily changes in stock prices and percentage year to date price movement based on the last traded prices. Dividends that are paid or are due to be paid and yields for each company are shown in the Main and Junior Markets’ daily report charts, along with the closing volume of the highest bid and the lowest offer for each company.
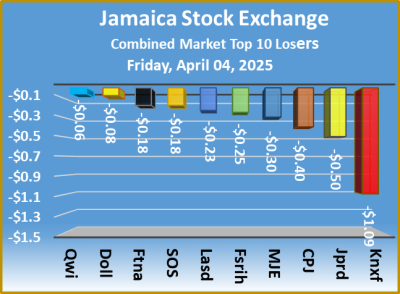
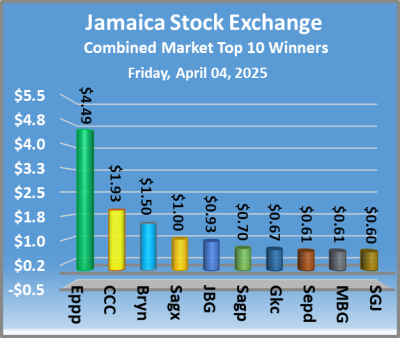 At the close of the market, the JSE Combined Market Index advanced 1,284.37 points to 335,698.49, the All Jamaican Composite Index increase by 1,379.00 points to settle at 375,041.25, the JSE Main Index rose 1,496.05 points to 324,375.52, the Junior Market Index dropped 19.86 points to 3,557.50 and the JSE USD Market Index lost 4.38 points to wrap up trading at 209.80.
 The market’s PE ratio, the most popular measure used to value stocks, ended at 12.6 based on 2024-25 earnings and 19.7 based on 2024 historical earnings. The ICInsider.com PE ratio chart and the other more detailed daily charts provide investors with regularly updated information to help decision-making. The PE ratio chart covers all ordinary shares listed on the Jamaica Stock Exchange, grouped by industry, allowing for easy comparisons within a sector and the overall market. The earnings per share (EPS) and PE ratios are based on 2024 and 2025 actual or projected earnings, excluding any major one-time income or expense.
 Investors who buy when the price of a stock is close to the average will find that they are not inclined to overpay for a stock. The net asset value of each company is incorporated into the chart. Investors can use this measure in assessing stock values. The chart also shows daily changes in stock prices and the percentage year to date price movement based on the last traded prices. Dividends that are paid or are due to be paid and yields for each company are shown in the Main and Junior Markets’ daily report charts, along with the closing volume of the highest bid and the lowest offer for each company.
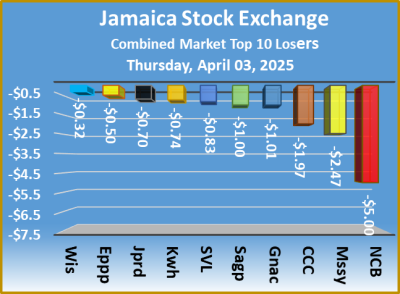
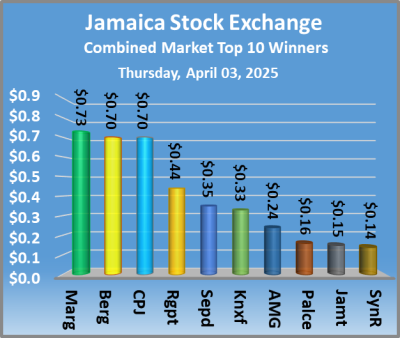 At the close of the market, the JSE Combined Market Index dropped 2,007.27 points to end at 334,414.12, the All Jamaican Composite Index shed 1,783.85 points to to finish at 373,662.25, the JSE Main Index shank 2,156.94 points to finish at 322,879.47, the Junior Market Index gained 7.76 points to conclude trading at 3,577.36 and the JSE USD Market Index declined 4.01 points to end at 214.18.
 The market’s PE ratio, the most popular measure used to value stocks, ended at 12.5 based on 2024-25 earnings and 20.1 based on 2024 historical earnings. The ICInsider.com PE ratio chart and the other more detailed daily charts provide investors with regularly updated information to help decision-making. The PE ratio chart covers all the ordinary shares listed on the Jamaica Stock Exchange, grouped by industry, allowing for easy comparisons within a sector and the overall market. The earnings per share (EPS) and the PE ratios are based on 2024 and 2025 actual or projected earnings, excluding any major one-time income or expense.
 Investors who buy when the price of a stock is close to the average will find that they are not inclined to overpay for a stock. The net asset value of each company is incorporated into the chart. Investors can use this measure in assessing stock values. The chart also shows daily changes in stock prices and the percentage year to date price movement based on the last traded prices. Dividends that are paid or are due to be paid and yields for each company are shown in the Main and Junior Markets’ daily report charts, along with the closing volume of the highest bid and the lowest offer for each company.
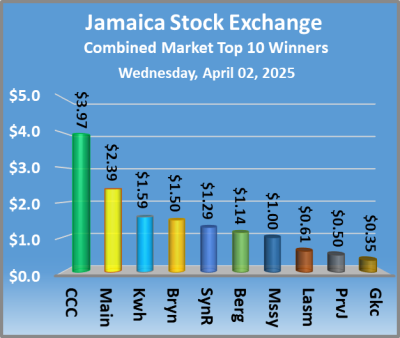 At the close of the market, the JSE Combined Market Index dipped 1,348.46 points to 336,421.39, the All Jamaican Composite Index skidded 2,749.97 points to finish at 375,446.10, the JSE Main Index dropped 1,665.25 points to close at 325,036.41, while the Junior Market Index climbed 34.11 points to end at 3,569.60 and the JSE USD Market Index rose 1.86 points to 218.19.
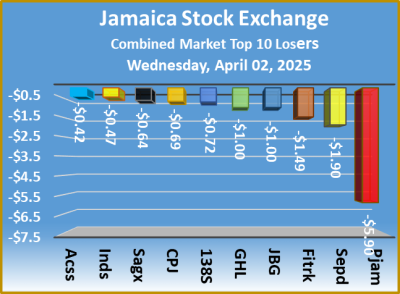 In the preferred segment, Eppley 7.25% preferred share slipped $2.99 to close at $17, 138 Student Living preference share climbed $30 to $230 and Sygnus Credit Investments C10.5% rose $14 to end at $105.
 Investors who buy when the price of a stock is close to the average will find that they are not inclined to overpay for a stock. The net asset value of each company is incorporated into the chart. Investors can use this measure in assessing stock values. The chart shows daily changes in stock prices and the percentage year to date price movement based on the last traded prices. Dividends that are paid or are due to be paid and yields for each company are shown in the Main and Junior Markets’ daily report charts, along with the closing volume of the highest bid and the lowest offer for each company.
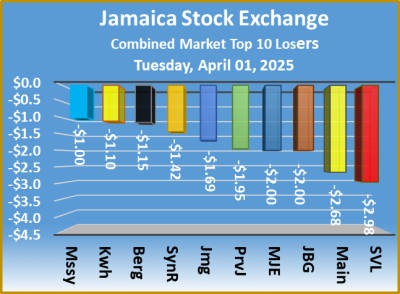
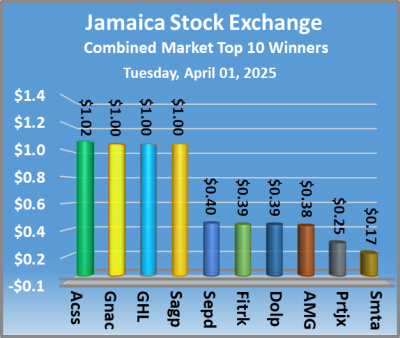 The JSE Combined Market Index sank 4,245.54 points to 337,769.85, as the All Jamaican Composite Index dropped 4,984.16 points to 378,196.07, the JSE Main Index declined 3,402.63 points to wrap up trading at 326,701.66, the Junior Market Index sank 138.45 points to end at 3,535.49 and the JSE USD Market Index skidded 8.51 points to 216.33.
 The market’s PE ratio, the most popular measure used to value stocks, ended at 12.8 based on 2024-25 earnings and 20.2 based on 2024 historical earnings. The ICInsider.com PE ratio chart and the other more detailed daily charts provide investors with regularly updated information to help decision-making. The PE ratio chart covers all ordinary shares listed on the Jamaica Stock Exchange, grouped by industry, allowing for easy comparisons within a sector and the overall market. The earnings per share (EPS) and PE ratios are based on 2024 and 2025 actual or projected earnings, excluding any major one time income or expense.
 Investors who buy when the price of a stock is close to the average will find that they are not inclined to overpay for a stock. The net asset value of each company is incorporated into the chart. Investors can use this measure in assessing stock values. The chart also shows daily changes in stock prices and the percentage year to date price movement based on the last traded prices. Dividends that are paid or are due to be paid and yields for each company are shown in the Main and Junior Markets’ daily report charts, along with the closing volume of the highest bid and the lowest offer for each company.
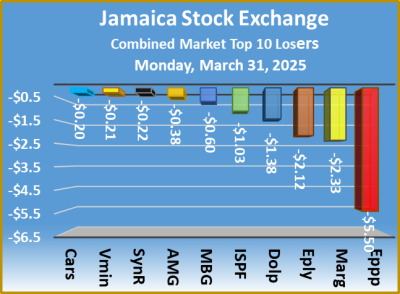
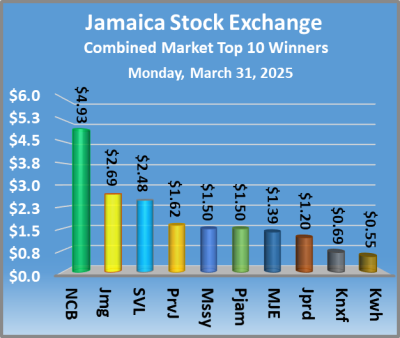 The JSE Combined Market Index surged by 4,678.69 points to end at 342,015.39, the All Jamaican Composite Index jumped 5,173.84 points to end at 383,180.23, the JSE Main Index climbed 4,365.05 points to finish at 330,104.29, the Junior Market Index popped 70.39 points to end trading at 3,673.94 and the JSE USD Market Index declined 2.04 points to 224.84.
 The market’s PE ratio, a frequently used measure to value stocks, ended at 15 based on 2024-25 earnings and 20.7 using 2024 historical earnings. The ICInsider.com PE ratio chart and the other more detailed daily charts provide investors with regularly updated information to help decision-making. The PE ratio chart covers all the ordinary shares on the Jamaica Stock Exchange and are grouped by industry, allowing investors to made easy comparisons within a sector and the overall market. The earnings per share (EPS) and PE ratios are based on 2024 and 2025 actual or projected earnings, excluding any major one time income or expense.
 The net asset value of each company is incorporated into the chart. Investors can use this measure in assessing stock values. The chart also shows daily changes in stock prices and the percentage year to date price movement based on the last traded prices. Dividends that are paid or are due to be paid and yields for each company are shown in the Main and Junior Markets’ daily report charts, along with the closing volume of the highest bid and the lowest offer for each company.
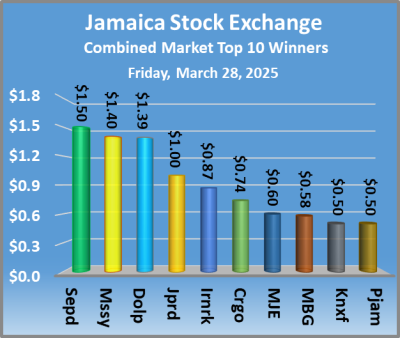 Trading resulted in all major indices in the three markets rising following the prices of 44 shares rising, 31 declining and 32 remaining firm.
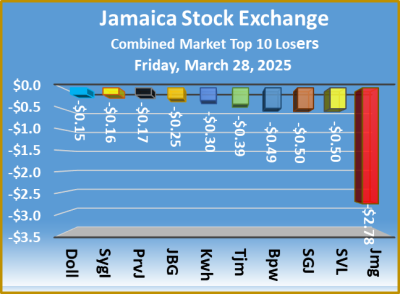 The market’s PE ratio, the most popular measure used to value stocks, ended at 12.7 based on 2024-25 earnings and 20.5 based on 2024 historical earnings. The ICInsider.com PE ratio chart and the other more detailed daily charts provide investors with regularly updated information to help in decision-making. The PE ratio chart covers all ordinary shares listed on the Jamaica Stock Exchange, grouped by industry, allowing for easy comparisons within a sector and the overall market. The earnings per share (EPS) and PE ratios are based on 2024 and 2025 actual or projected earnings, excluding any major one time income or expense.
 Investors who buy when the price of a stock is close to the average will find that they are not inclined to overpay for a stock. The net asset value of each company is incorporated into the chart. Investors can use this measure in assessing stock values. The chart also shows daily changes in stock prices and the percentage year to date price movement based on the last traded prices. Dividends that are paid or are due to be paid and yields for each company are shown in the Main and Junior Markets’ daily report charts, along with the closing volume of the highest bid and the lowest offer for each company.
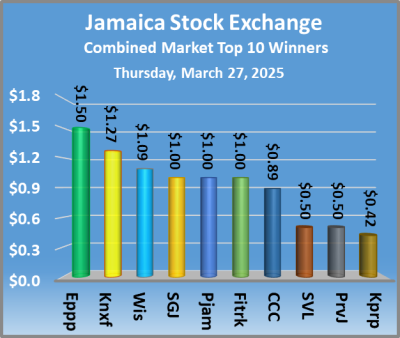 At the end of trading, prices of 47 shares advanced, 34 declined and 30 remained firm, resulting in the JSE Combined Market Index skidding 151.96 points to close at 336,012.10, the All Jamaican Composite Index declining 181.27 points to finish at 376,545.07, the JSE Main Index dropping 510.35 points to close at 324,484.66. The Junior Market Index rose 46.94 points to end at 3,586.13 and the JSE USD Market Index skidded 0.79 points to 214.37.
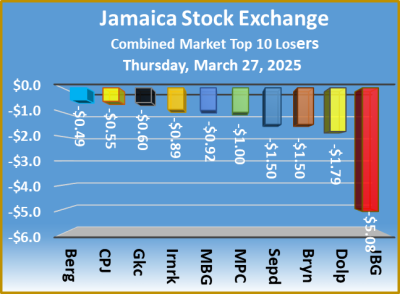 The earnings per share (EPS) and PE ratios are based on 2024 and 2025 actual or projected earnings, excluding any major one time income or expense.
 The chart also shows daily changes in stock prices and the percentage year to date price movement based on the last traded prices. Dividends that are paid or are due to be paid and yields for each company are shown in the Main and Junior Markets’ daily report charts, along with the closing volume of the highest bid and the lowest offer for each company.
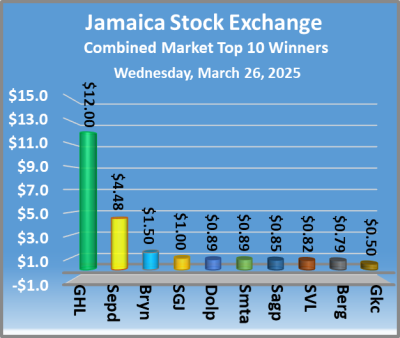 At the close of the market, the JSE Combined Market Index declined by 769.63 points to 336,164.06, the All Jamaican Composite Index shed 2,002.36 points to end trading at 376,726.34, the JSE Main Index dropped 680.33 points to finish at 324,995.01, as the Junior Market Index fell 16.61 points to conclude trading at 3,539.19 and the JSE USD Market Index shed 15.32 points to 215.16.
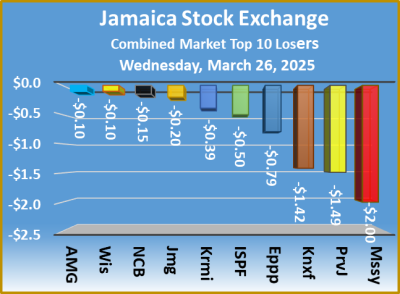 The market’s PE ratio, the most popular measure used to value stocks, ended at 12.8 based on 2024-25 earnings and 19.7 based on 2024 historical earnings. The ICInsider.com PE ratio chart and the other more detailed charts are posted daily to provide investors with regularly updated information to help decision-making. The PE ratio chart covers all the ordinary shares listed on the Jamaica Stock Exchange and grouped by industry, allowing for easy comparisons within a sector and the overall market. The earnings per share (EPS) and PE ratios are based on 2024 and 2025 actual or projected earnings, excluding any major one time income or expense.
 The net asset value of each company is incorporated into the chart. Investors can use this measure in assessing stock values. The chart also shows daily changes in stock prices and the percentage year to date price movement based on the last traded prices. Dividends that are paid or are due to be paid and yields for each company are shown in the Main and Junior Markets’ daily report charts, along with the closing volume of the highest bid and the lowest offer for each company.