Trading was mixed on Friday on the Jamaica Stock Exchange, with the volume and value of stocks traded rising compared to Thursday helped by the newly listed Image Plus Consultants on the Junior market.
 Trading ended, with an exchange of 30,350,965 shares compared to 24,723,664 units on Thursday, with newly listed Image Plus contributing 12.4 million of Friday’s volume, and $26.4 million to the value of trading of $178.7 million compared to $62.7 million on the previous day. Trading on the JSE USD market resulted in investors exchanging US$81,708 versus US$23,978 on Thursday.
At the close, the Combined Market Index dropped 79.20 points to end at 354,517.71, the All Jamaican Composite Index dipped 921.76 points to 386,062.55, the JSE Main Index declined 214.32 points to settle at 340,731.16, the Junior Market popped 30.02 points to settle at 3,993.91 and the JSE US dollar market lost 0.89 points to close at 218.24.
The market’s PE ratio ended at 23 based on 2021-22 earnings and 13.7 times those for 2022-23 at the close of trading.
 Investors need pertinent information to successfully navigate many investment options in the local stock market. The ICInsider.com PE ratio chart and the more detailed daily report charts provide investors with regularly updated information to help decision-making.
Investors should use the chart to help make rational investment decisions by investing in stocks close to the average for the sector and not going too far from it unless there are compelling reasons to do so. This approach helps to remove emotions from investment decisions and put in on fundamentals while at the same time not being too far from the majority of investors. Investors who buy when the price of a stock is close to the average will find that they are not inclined to overpay for a stock.
The ICInsider.com PE Ratio chart covers all ordinary shares on the Jamaica Stock Exchange. It shows companies grouped on an industry basis, allowing easy comparisons between the same sector companies and the overall market.
The net asset value of each company is reported as a guide to assess the value of stocks based on this measure quickly. The chart also shows daily changes in stock prices and the percentage year to date price movement based on the last traded prices.  Dividends payable and yields for each company are shown in the Main and Junior Markets’ daily report charts that show the closing volume for the bids and offers.
The EPS & PE ratios are based on 2021 and 2022 actual or projected earnings, excluding major one off items. The PE Ratio is the most popular measure used to determine the value of stocks.
Mixed JSE trading on Friday
All JSE markets drop on Thursday
All of the Jamaica Stock Exchange markets declined on Thursday with the volume and value of stocks traded rising compared to that on Wednesday, with the volume more than doubling that of Wednesday as the value climbed moderately.
 Trading ended, with an exchange of 24,723,664 shares compared to 11,612,526 units on Wednesday, with the value ending at $62.7 million from $50.4 million the previous day. The JSE USD market ended with US$23,978 worth of stocks traded versus US$50,829 on Wednesday.
At the close, the Combined Market Index dropped 1,992.86 points to finish at 354,438.51, the All Jamaican Composite Index fell 1,548.29 points to 386,984.31, the JSE Main Index dropped 1,426.90 points to 340,945.48, the Junior Market dived 72.06 points to end at 3,963.89 and the JSE US dollar market lost 10.15 points to close at 219.13.
The market’s PE ratio ended at 22.6 based on 2021-22 earnings and 13.6 times those for 2022-23 at the close of trading.
 Investors need pertinent information to successfully navigate many investment options in the local stock market. The ICInsider.com PE ratio chart and the more detailed daily report charts provide investors with regularly updated information to help decision-making.
Investors should use the chart to help make rational investment decisions by investing in stocks close to the average for the sector and not going too far from it unless there are compelling reasons to do so. This approach helps to remove emotions from investment decisions and put in on fundamentals while at the same time not being too far from the majority of investors. Investors who buy when the price of a stock is close to the average will find that they are not inclined to overpay for a stock.
The ICInsider.com PE Ratio chart covers all ordinary shares on the Jamaica Stock Exchange. It shows companies grouped on an industry basis, allowing easy comparisons between the same sector companies and the overall market.
The net asset value of each company is reported as a guide to assess the value of stocks based on this measure quickly. The chart also shows daily changes in stock prices and the percentage year to date price movement based on the last traded prices.  Dividends payable and yields for each company are shown in the Main and Junior Markets’ daily report charts that show the closing volume for the bids and offers.
The EPS & PE ratios are based on 2021 and 2022 actual or projected earnings, excluding major one off items. The PE Ratio is the most popular measure used to determine the value of stocks.
Gains for Junior & USD markets losses for majors
The Junior Market of the Jamaica Stock Exchange made another attempt to break out of a market squeeze to the upside on Wednesday while the JSE USD Market climbed but the JSE Main Market continues to struggle and declined to close out the day with the value of stocks traded dropping sharply compared to that on Tuesday.
 Trading ended, with an exchange of 11,612,526 shares compared with 19,683,685 units on Tuesday, with the value, traded ending at $50.4 million from $173.9 million the previous day. The JSE USD market ended with US$50,829 worth of stocks traded versus US$9,034 on Tuesday.
At the close, the Combined Market Index dropped 896.49 points to 356,431.37, the All Jamaican Composite Index shed 1,685.66 points to settle at 388,532.60, the JSE Main Index fell 1,249.20 points to 342,372.38, the Junior Market popped 29.27 points to end at 4,035.96 and the JSE US dollar market rose 1.87 points to close at 229.28.
The market’s PE ratio ended at 23 based on 2021-22 earnings and 13.5 times those for 2022-23 at the close of trading.
 Investors need pertinent information to successfully navigate many investment options in the local stock market. The ICInsider.com PE ratio chart and the more detailed daily report charts provide investors with regularly updated information to help decision-making.
Investors should use the chart to help make rational investment decisions by investing in stocks close to the average for the sector and not going too far from it unless there are compelling reasons to do so. This approach helps to remove emotions from investment decisions and put in on fundamentals while at the same time not being too far from the majority of investors. Investors who buy when the price of a stock is close to the average will find that they are not inclined to overpay for a stock.
The ICInsider.com PE Ratio chart covers all ordinary shares on the Jamaica Stock Exchange. It shows companies grouped on an industry basis, allowing easy comparisons between the same sector companies and the overall market.
The net asset value of each company is reported as a guide to assess the value of stocks based on this measure quickly. The chart also shows daily changes in stock prices and the percentage year to date price movement based on the last traded prices.  Dividends payable and yields for each company are shown in the Main and Junior Markets’ daily report charts that show the closing volume for the bids and offers.
The EPS & PE ratios are based on 2021 and 2022 actual or projected earnings, excluding major one off items. The PE Ratio is the most popular measure used to determine the value of stocks.
Gains for all Jamaica Stock Exchange markets
Markets rose at the close of trading on the Jamaica Stock Exchange on Tuesday as trading levels jumped over Monday’s outturn with the Junior Market recording gains, as it continues to slowly recover from losses earlier in the month, the JSE Main Market recovered some of Monday’s sharp losses and the JSE USD Market popped to be slightly higher than Monday.
 Trading ended, with an exchange of 19,683,685 shares compared with 17,871,853 units on Monday, with the value traded rising to $173.9 million from $83.75 million the previous day. The JSE USD market ended with US$9,034 worth of stocks traded versus US$26,630 on Monday.
At the close, the Combined Market Index climbed 1,966.36 points to 357,327.86, the All Jamaican Composite Index rallied 1,643.83 points to settle at 390,218.26, the JSE Main Index jumped 1,861.07 points to 343,622.12, the Junior Market popped 25.13 points to end at 4006.69 and the JSE US dollar market rose 0.19 points to close at 227.41.
The market’s PE ratio ended at 23.1 based on 2021-22 earnings and 13.5 times those for 2022-23 at the close of trading.
 Investors need pertinent information to successfully navigate many investment options in the local stock market. The ICInsider.com PE ratio chart and the more detailed daily report charts provide investors with regularly updated information to help decision-making.
Investors should use the chart to help make rational investment decisions by investing in stocks close to the average for the sector and not going too far from it unless there are compelling reasons to do so. This approach helps to remove emotions from investment decisions and put in on fundamentals while at the same time not being too far from the majority of investors. Investors who buy when the price of a stock is close to the average will find that they are not inclined to overpay for a stock.
The ICInsider.com PE Ratio chart covers all ordinary shares on the Jamaica Stock Exchange. It shows companies grouped on an industry basis, allowing easy comparisons between the same sector companies and the overall market.
The net asset value of each company is reported as a guide to assess the value of stocks based on this measure quickly. The chart also shows daily changes in stock prices and the percentage year to date price movement based on the last traded prices.  Dividends payable and yields for each company are shown in the Main and Junior Markets’ daily report charts that show the closing volume for the bids and offers.
The EPS & PE ratios are based on 2021 and 2022 actual or projected earnings, excluding major one off items. The PE Ratio is the most popular measure used to determine the value of stocks.
Investors not properly protected
In light of the news regarding Usain Bolt and other investors at Stocks and Securities, this publication reproduces an article posted in 2018 on ICInsider.com about the financial sector’s danger signs. The article warned of the tsunami that exists in the financial system that no one wants to deal with. The following article is reproduced for all to see the latest development is a clear indication that the Minister in charge must take on board directly to correct some bad practices in the sector so as to build a resilient and thriving sector.
All concerned should be pleased that good sense has prevailed and the Elite IPO has been put off for now, the IPO while they correct the errors in the prospectus, in keeping with this publication’s recommendation.
The matter brings to the fore once again, the inadequacy of capital market monitoring leaving investors with a false sense of security that they are led to believe.

Usain Bolt’s high rise on Halfway Tree Road
What are some of the facts? The rules for takeover on paper are meant to protect minority shareholders, in fact, they hardly do. Minority shareholders in many cases are not in a strong position to assess if they should or should not surrender their shares in a takeover bid. Worse the directors’ recommendations are fraught with problems. Most directors are not serious stock market investors and are not equipped to make a proper assessment of the company’s value in order to make a proper recommendation to shareholders.
A good example of this is the takeover attempts for all the shares of Berger Paints last year which was accompanied by directors’ report recommending acceptance of the offer and contained false information which was used to try and convince shareholders that they should surrender their shares. No one in authority seems to have called for proof of the information in the circular to support their view or asked to correct the error. Nor was the company required to provide shareholders with up to date financial information, which is not now a requirement but ought to be.
Cable & Wireless directors are recommending the sale of the shares to the majority owner but have not provided shareholders with results to December, last year or forecast earnings. There is no rationale for this critical information to be provided to valuators but not to the persons who count – shareholders. So Why have the shareholders not been given such pertinent information?
The C&W offer is being made at a time when the company’s fortunes have improved considerably and could end with a profit or small loss in 2017. From IC Insider.com assessment, the company is in a very good position to report a good level of profit in 2018 with interest cost set to fall by around $1 billion per year and revenues set to rise. Investors should get more information as to the 2017 results and forecast for two or so years to enable them to make an informed decision.
The marketplace has dealers who blatantly breach agreements with clients but no regulator in the sector does anything about it. So while the Minister of Finance is proud of the success of the Junior Market, he is unaware of the tsunami that lies just below in the system that he is minster over and one day could explode.
Solid Junior Market gains as Main Market falls
Stocks traded mixed on Monday with the Junior Market putting in solid gains and the JSE Main Market and the JSE USD Market falling as the volume of stock traded rose but at a lower value than Friday
 Trading ended, with an exchange of 17,871,853 shares versus 11,034,785 units on Friday, with the value falling to $83.75 million from $166.7 million on the previous trading day. The JSE USD market ended with the value of stocks traded amounting to US$26,630 from US$6,623 on Friday.
At the close, the Combined Market Index dropped 3,181.14 points to 355,361.50, the All Jamaican Composite Index dived 4,412.33 points to 388,574.43, the JSE Main Index shed 3,736.04 points to finish at 341,761.06, the Junior Market popped 33.09 points to end at 3,981.56 and the JSE US dollar market slipped 0.10 points to 227.22.
The market’s PE ratio ended at 23 based on 2021-22 earnings and 13.5 times those for 2022-23 at the close of trading.
 Investors need pertinent information to successfully navigate many investment options in the local stock market. The ICInsider.com PE ratio chart and the more detailed daily report charts provide investors with regularly updated information to help decision-making.
Investors should use the chart to help make rational investment decisions by investing in stocks close to the average for the sector and not going too far from it unless there are compelling reasons to do so. This approach helps to remove emotions from investment decisions and put in on fundamentals while at the same time not being too far from the majority of investors. Investors who buy when the price of a stock is close to the average will find that they are not inclined to overpay for a stock.
The ICInsider.com PE Ratio chart covers all ordinary shares on the Jamaica Stock Exchange. It shows companies grouped on an industry basis, allowing easy comparisons between the same sector companies and the overall market.
 The net asset value of each company is reported as a guide to assess the value of stocks based on this measure quickly. The chart also shows daily changes in stock prices and the percentage year to date price movement based on the last traded prices. Dividends payable and yields for each company are shown in the Main and Junior Markets’ daily report charts that show the closing volume for the bids and offers.
The EPS & PE ratios are based on 2021 and 2022 actual or projected earnings, excluding major one off items. The PE Ratio is the most popular measure used to determine the value of stocks.
JSE majors rise Juniors fall on Friday
Stocks traded mixed on Friday after the funds entering the market jumped sharply over Thursday’s level with trading resulting in a rise of the JSE Main Market but lower than the previous week’s close, while the Junior Market and the JSE USD Market fell, with the Junior market ending higher than the previous week while the JSE USD market closed lower than the prior week.
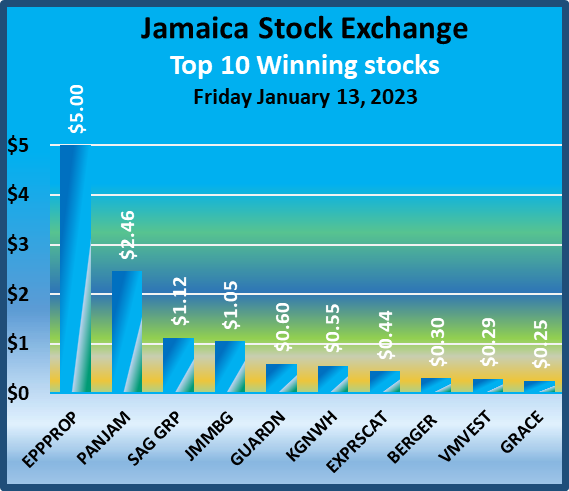 Trading ended, with an exchange of 11,034,785 shares versus 12,548,350 units on Thursday, with the value falling to $166.7 million from $55.7 million on the previous trading day. The JSE USD market ended with the value of stocks traded falling to US$6,623 from US$99,750 on Thursday.
At the close, the Combined Market Index popped 1,746.27 points to 358,542.64, the All Jamaican Composite Index jumped 3,343.14 points to 392,986.76, the JSE Main Index rose 2,244.00 points to 345,497.10, the Junior Market dropped 37.78 points to end at 3,948.47 and the JSE US dollar market lost 1.47 points to close at 227.32.
The market’s PE ratio ended at 22.4 based on 2021-22 earnings and 13.4 times those for 2022-23 at the close of trading.
Investors need pertinent information to successfully navigate many investment options in the local stock market. 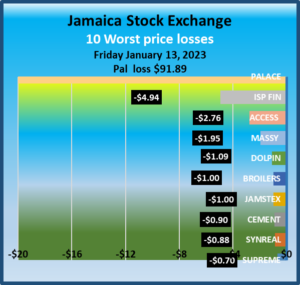 The ICInsider.com PE ratio chart and the more detailed daily report charts provide investors with regularly updated information to help decision-making.
Investors should use the chart to help make rational investment decisions by investing in stocks close to the average for the sector and not going too far from it unless there are compelling reasons to do so. This approach helps to remove emotions from investment decisions and put in on fundamentals while at the same time not being too far from the majority of investors. Investors who buy when the price of a stock is close to the average will find that they are not inclined to overpay for a stock.
The ICInsider.com PE Ratio chart covers all ordinary shares on the Jamaica Stock Exchange. It shows companies grouped on an industry basis, allowing easy comparisons between the same sector companies and the overall market.
The net asset value of each company is reported as a guide to assess the value of stocks based on this measure quickly. The chart also shows daily changes in stock prices and the percentage year to date price movement based on the last traded prices. 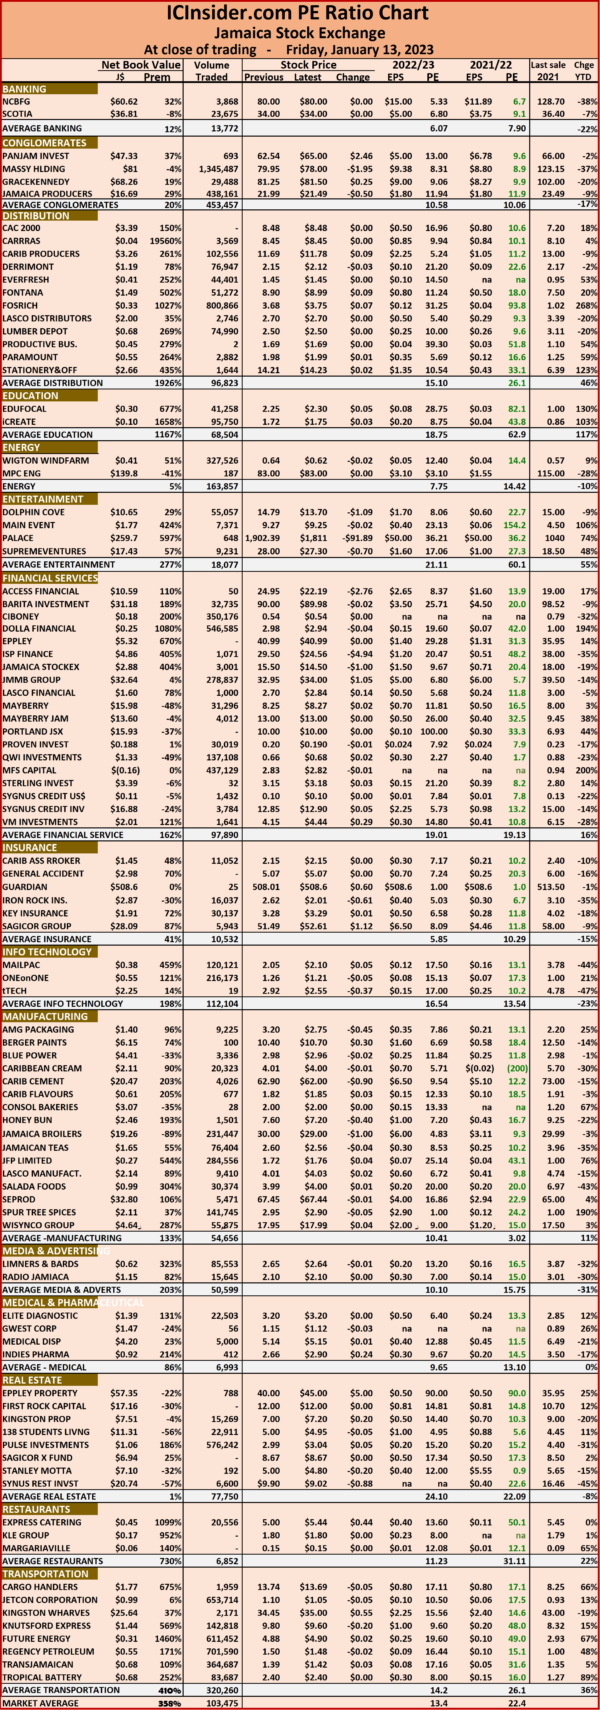 Dividends payable and yields for each company are shown in the Main and Junior Markets’ daily report charts that show the closing volume for the bids and offers.
The EPS & PE ratios are based on 2021 and 2022 actual or projected earnings, excluding major one off items. The PE Ratio is the most popular measure used to determine the value of stocks.
Jamaica Stock Exchange mostly gained Thursday
Stocks traded sharply higher at the commencement of trading on Thursday with the JSE Main Index rising 4,219.58 points to 345,303.90, the Junior Market jumping 88.70 points to 4,001.98 within 15 minutes of opening and the market kept most of the early gains to deliver a positive end to trading on Thursday and the JSE USD Market fell moderately to close out the day.
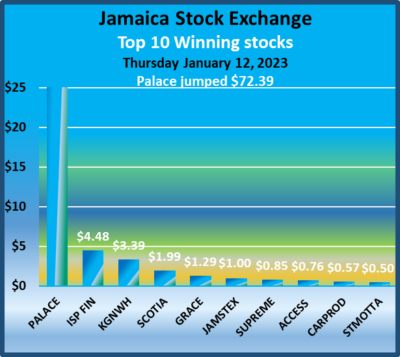 Trading ended, with an exchange of 12,548,35 shares versus 21,678,787 units on Wednesday, with the value falling to $55.7 million from $155.5 million on the previous trading day. The JSE USD market ended with the value of stocks traded falling to US$99,750 from US$9,740 on Wednesday.
At the close, the Combined Market Index popped 2,693.16 points to 356,796.37, the All Jamaican Composite Index jumped 2,760.22 points to 389,643.62, the JSE Main Index rose 2,168.78 points to end at 343,253.10, the Junior Market surged 72.97 points to end at 3,986.25 and the JSE USdollar market rose 1.25 points to close at 228.79.
The market’s PE ratio ended at 22.3 based on 2021-22 earnings and 13.3 times those for 2022-23 at the close of trading.
Investors need pertinent information to successfully navigate many investment options in the local stock market. 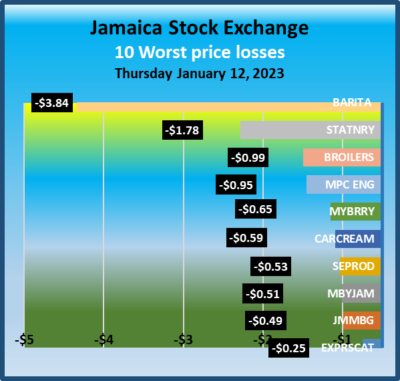 The ICInsider.comPE ratio chart and the more detailed daily report charts provide investors with regularly updated information to help decision-making.
Investors should use the chart to help make rational investment decisions by investing in stocks close to the average for the sector and not going too far from it unless there are compelling reasons to do so. This approach helps to remove emotions from investment decisions and put in on fundamentals while at the same time not being too far from the majority of investors. Investors who buy when the price of a stock is close to the average will find that they are not inclined to overpay for a stock.
The ICInsider.com PE Ratio chart covers all ordinary shares on the Jamaica Stock Exchange. It shows companies grouped on an industry basis, allowing easy comparisons between the same sector companies and the overall market.
The net asset value of each company is reported as a guide to assess the value of stocks based on this measure quickly. The chart also shows daily changes in stock prices and the percentage year to date price movement based on the last traded prices. 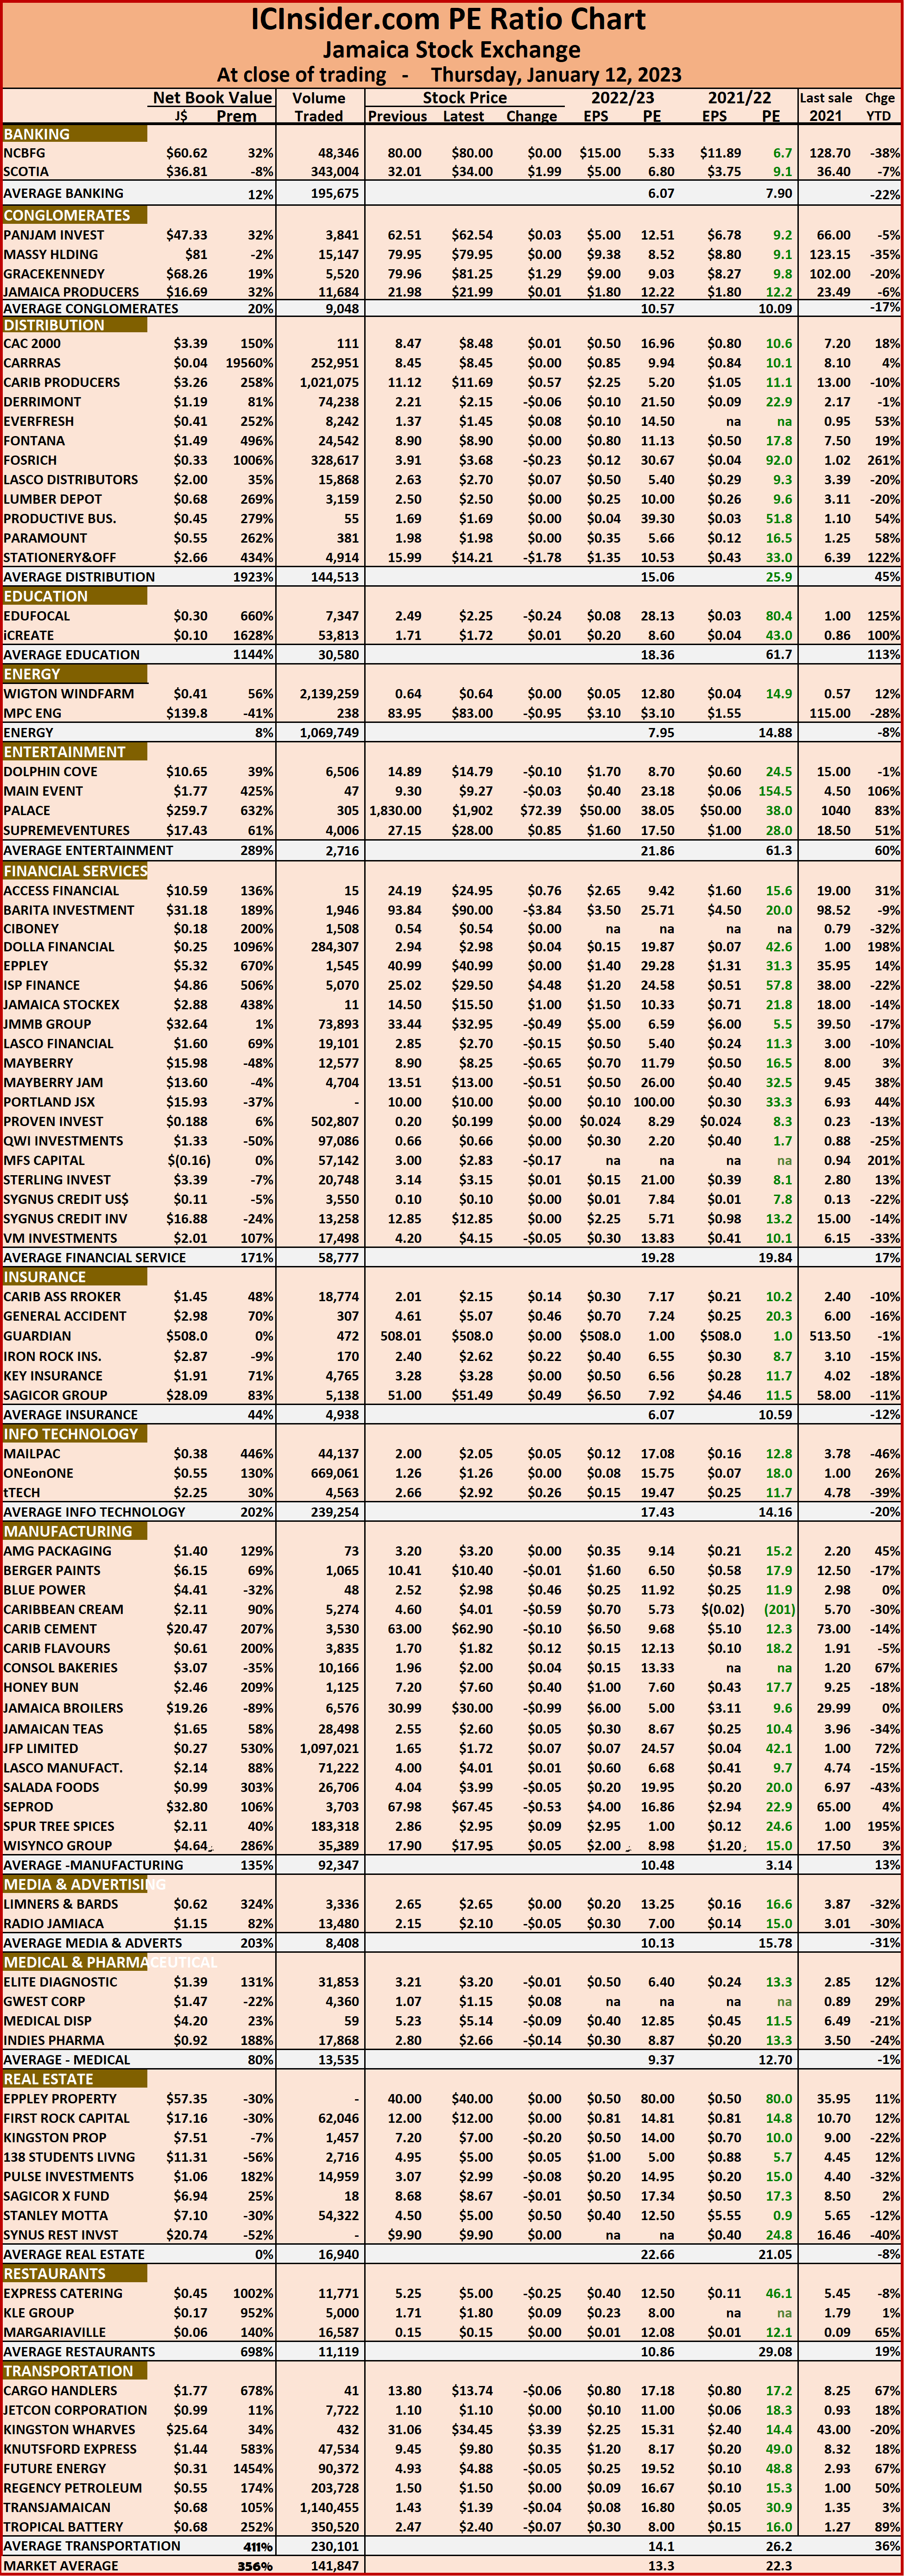 Dividends payable and yields for each company are shown in the Main and Junior Markets’ daily report charts that show the closing volume for the bids and offers.
The EPS & PE ratios are based on 2021 and 2022 actual or projected earnings, excluding major one off items. The PE Ratio is the most popular measure used to determine the value of stocks.
Trading rises on Jamaica Stock Exchange as prices fall
The value of stocks trading picked up on the Jamaica Stock Exchange on Wednesday well over the sub-par levels on Monday and Tuesday. However, the Main Market and the Junior Market indices declined and the JSE USD Market enjoyed a bounce.
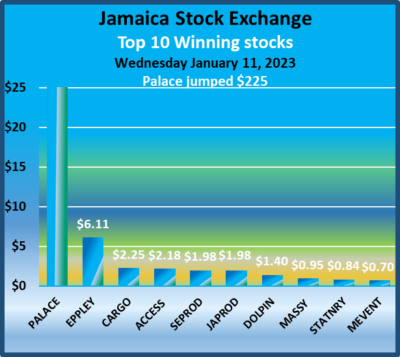 Trading ended with an exchange of 21,678,787 shares compared with 16,753,008 units on Tuesday, with the value falling to $155.5 million from $57.5 million on the previous trading day. The JSE USD market ended with the value of stocks traded falling to US$9,740 from US$22,972 on Tuesday.
At the close, the Combined Market Index dived 3078.85 points to 354,103.21, the All Jamaican Composite Index dropped 3,634.92 points to 386,883.40, the JSE Main Index fell 2,841.02 points to 341,084.32, the Junior Market dived 46.69 points to end at 3,913.28 and the JSE US dollar market rose 4.02 points to close at 230.04.
The market’s PE ratio ended at 22.4 based on 2021-22 earnings and 13.3 times those for 2022-23 at the close of trading.
Investors need pertinent information to successfully navigate many investment options in the local stock market. 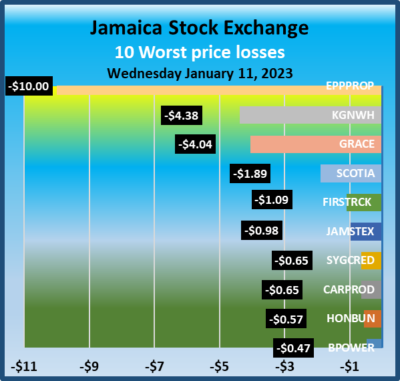 The ICInsider.com PE ratio chart and the more detailed daily report charts provide investors with regularly updated information to help decision-making.
Investors should use the chart to help make rational investment decisions by investing in stocks close to the average for the sector and not going too far from it unless there are compelling reasons to do so. This approach helps to remove emotions from investment decisions and put in on fundamentals while at the same time not being too far from the majority of investors. Investors who buy when the price of a stock is close to the average will find that they are not inclined to overpay for a stock.
The ICInsider.com PE Ratio chart covers all ordinary shares on the Jamaica Stock Exchange. It shows companies grouped on an industry basis, allowing easy comparisons between the same sector companies and the overall market.
The net asset value of each company is reported as a guide to assess the value of stocks based on this measure quickly. The chart also shows daily changes in stock prices and the percentage year to date price movement based on the last traded prices.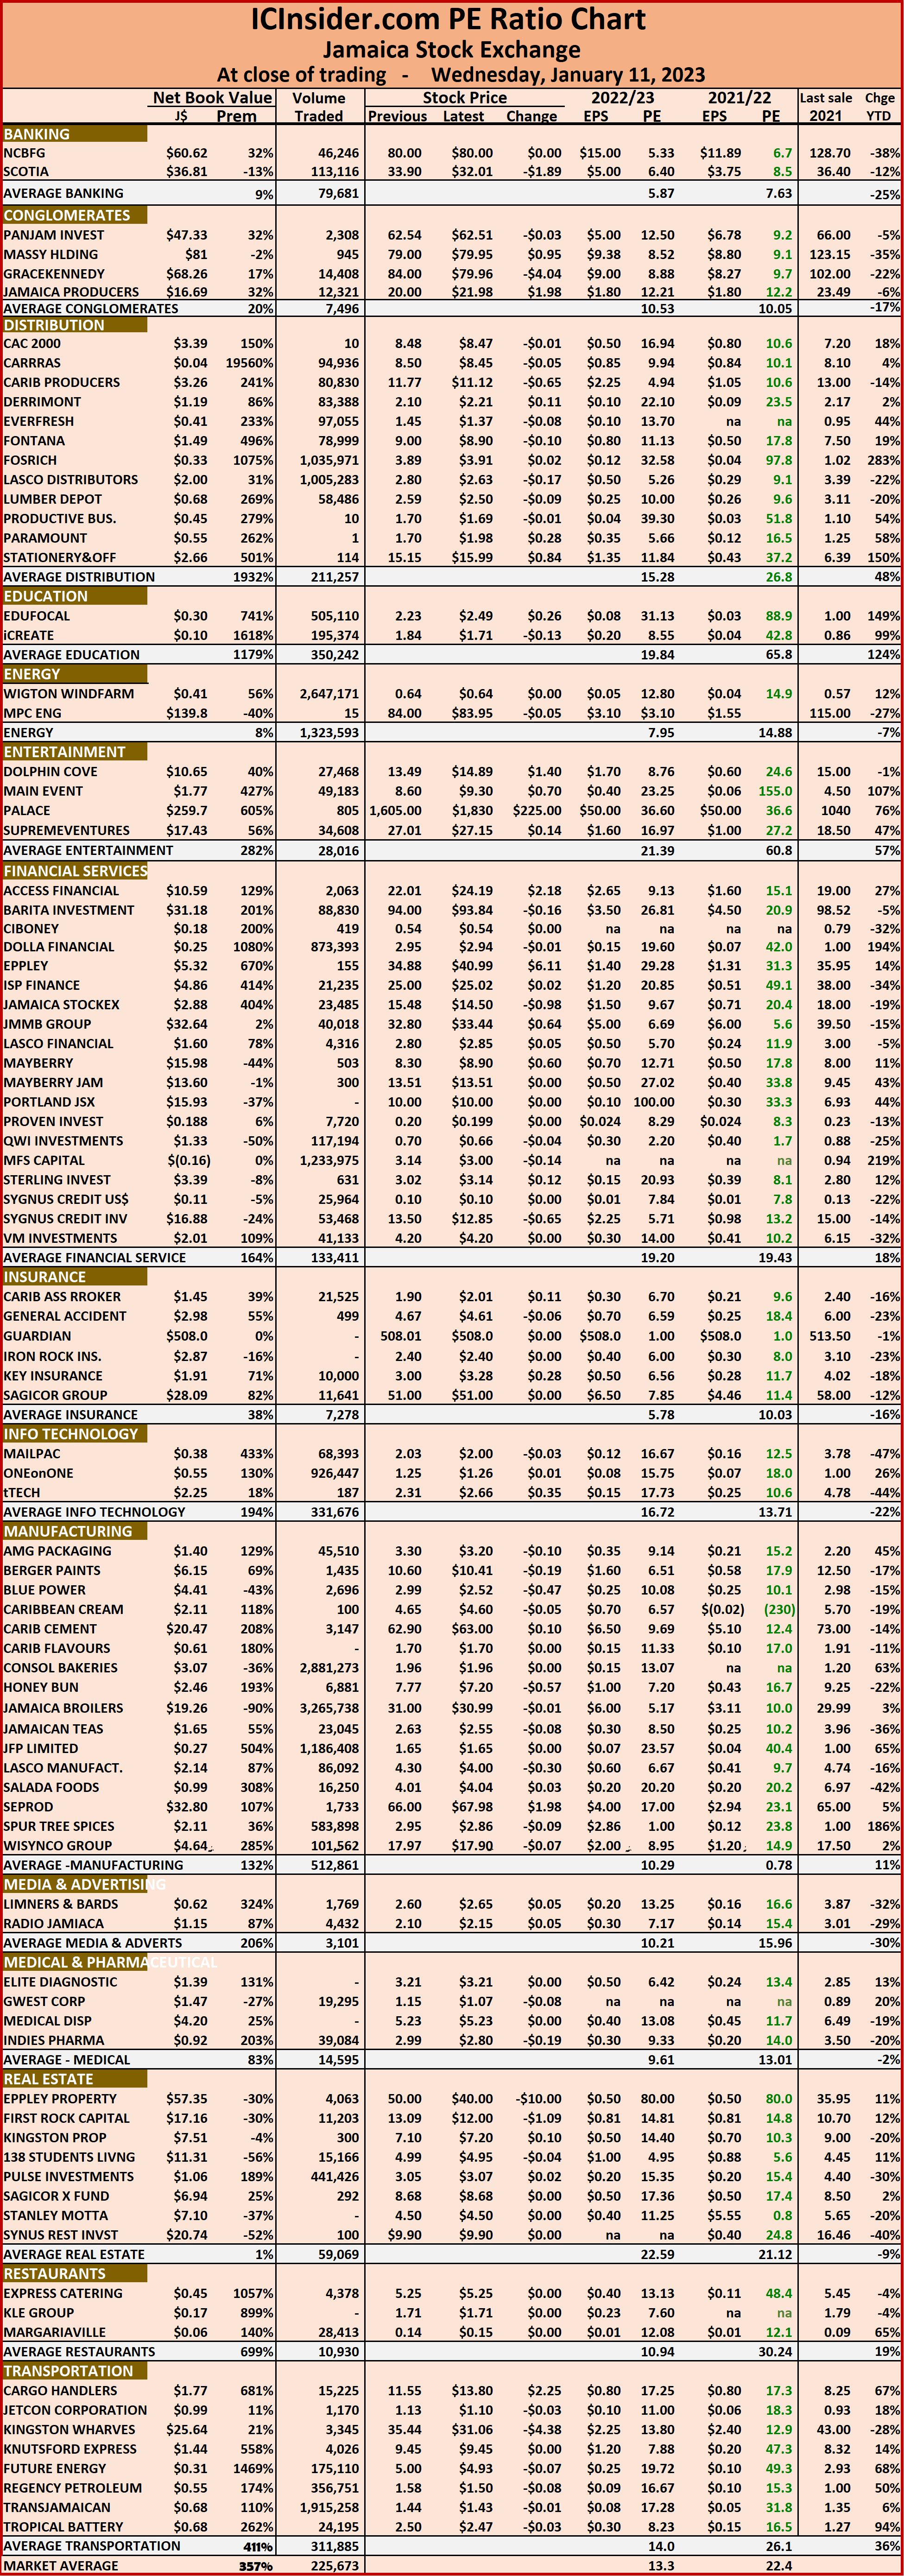 Dividends payable and yields for each company are shown in the Main and Junior Markets’ daily report charts that show the closing volume for the bids and offers.
The EPS & PE ratios are based on 2021 and 2022 actual or projected earnings, excluding major one off items. The PE Ratio is the most popular measure used to determine the value of stocks.
JSE Main Market trading falls
The value of stocks trading continues to be low on the Jamaica Stock Exchange, with value traded on Tuesday falling below Monday’s level, leading to a jump in the Junior Market index and modest increases for that of the Main Market and slippage for the JSE USD Market.
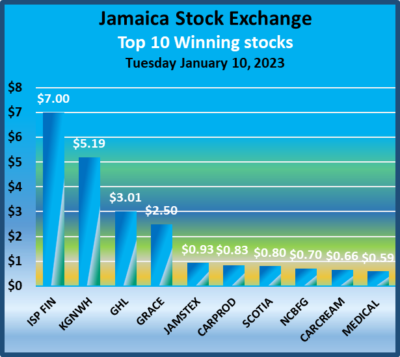 Trading ended with an exchange of 16,753,008 shares versus 16,619,413 units on Monday, with the value falling to $57.5 million from $68 million on the previous trading day. The JSE USD market ended with the value of stocks traded amounting to US$22,972 down from US$74,761 on Monday.
At the close, the Combined Market Index popped 905.12 points to 357,182.06, the All Jamaican Composite Index rose 397.74 points to close at 390,518.32, the JSE Main Index gained 417.79 points to 343,923.34, the Junior Market jumped 56.12 points as it gave back some of the early trading gains to end at 3,959.97 and the JSE US dollar market fell 5.76 to 226.02.
The market’s PE ratio ended at 22 based on 2021-22 earnings and 13.3 times those for 2022-23 at the close of trading.
Investors need pertinent information to successfully navigate many investment options in the local stock market. 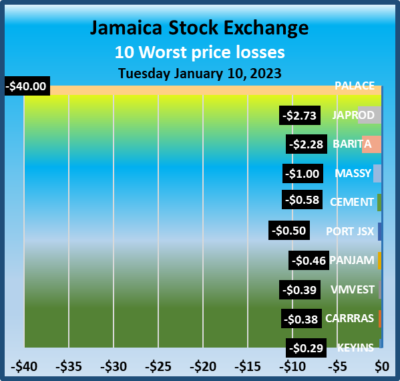 The ICInsider.com PE ratio chart and the more detailed daily report charts provide investors with regularly updated information to help decision-making.
Investors should use the chart to help make rational investment decisions by investing in stocks close to the average for the sector and not going too far from it unless there are compelling reasons to do so. This approach helps to remove emotions from investment decisions and put in on fundamentals while at the same time not being too far from the majority of investors. Investors who buy when the price of a stock is close to the average will find that they are not inclined to overpay for a stock.
The ICInsider.com PE Ratio chart covers all ordinary shares on the Jamaica Stock Exchange. It shows companies grouped on an industry basis, allowing easy comparisons between the same sector companies and the overall market.
The net asset value of each company is reported as a guide to assess the value of stocks based on this measure quickly. The chart also shows daily changes in stock prices and the percentage year to date price movement based on the last traded prices. 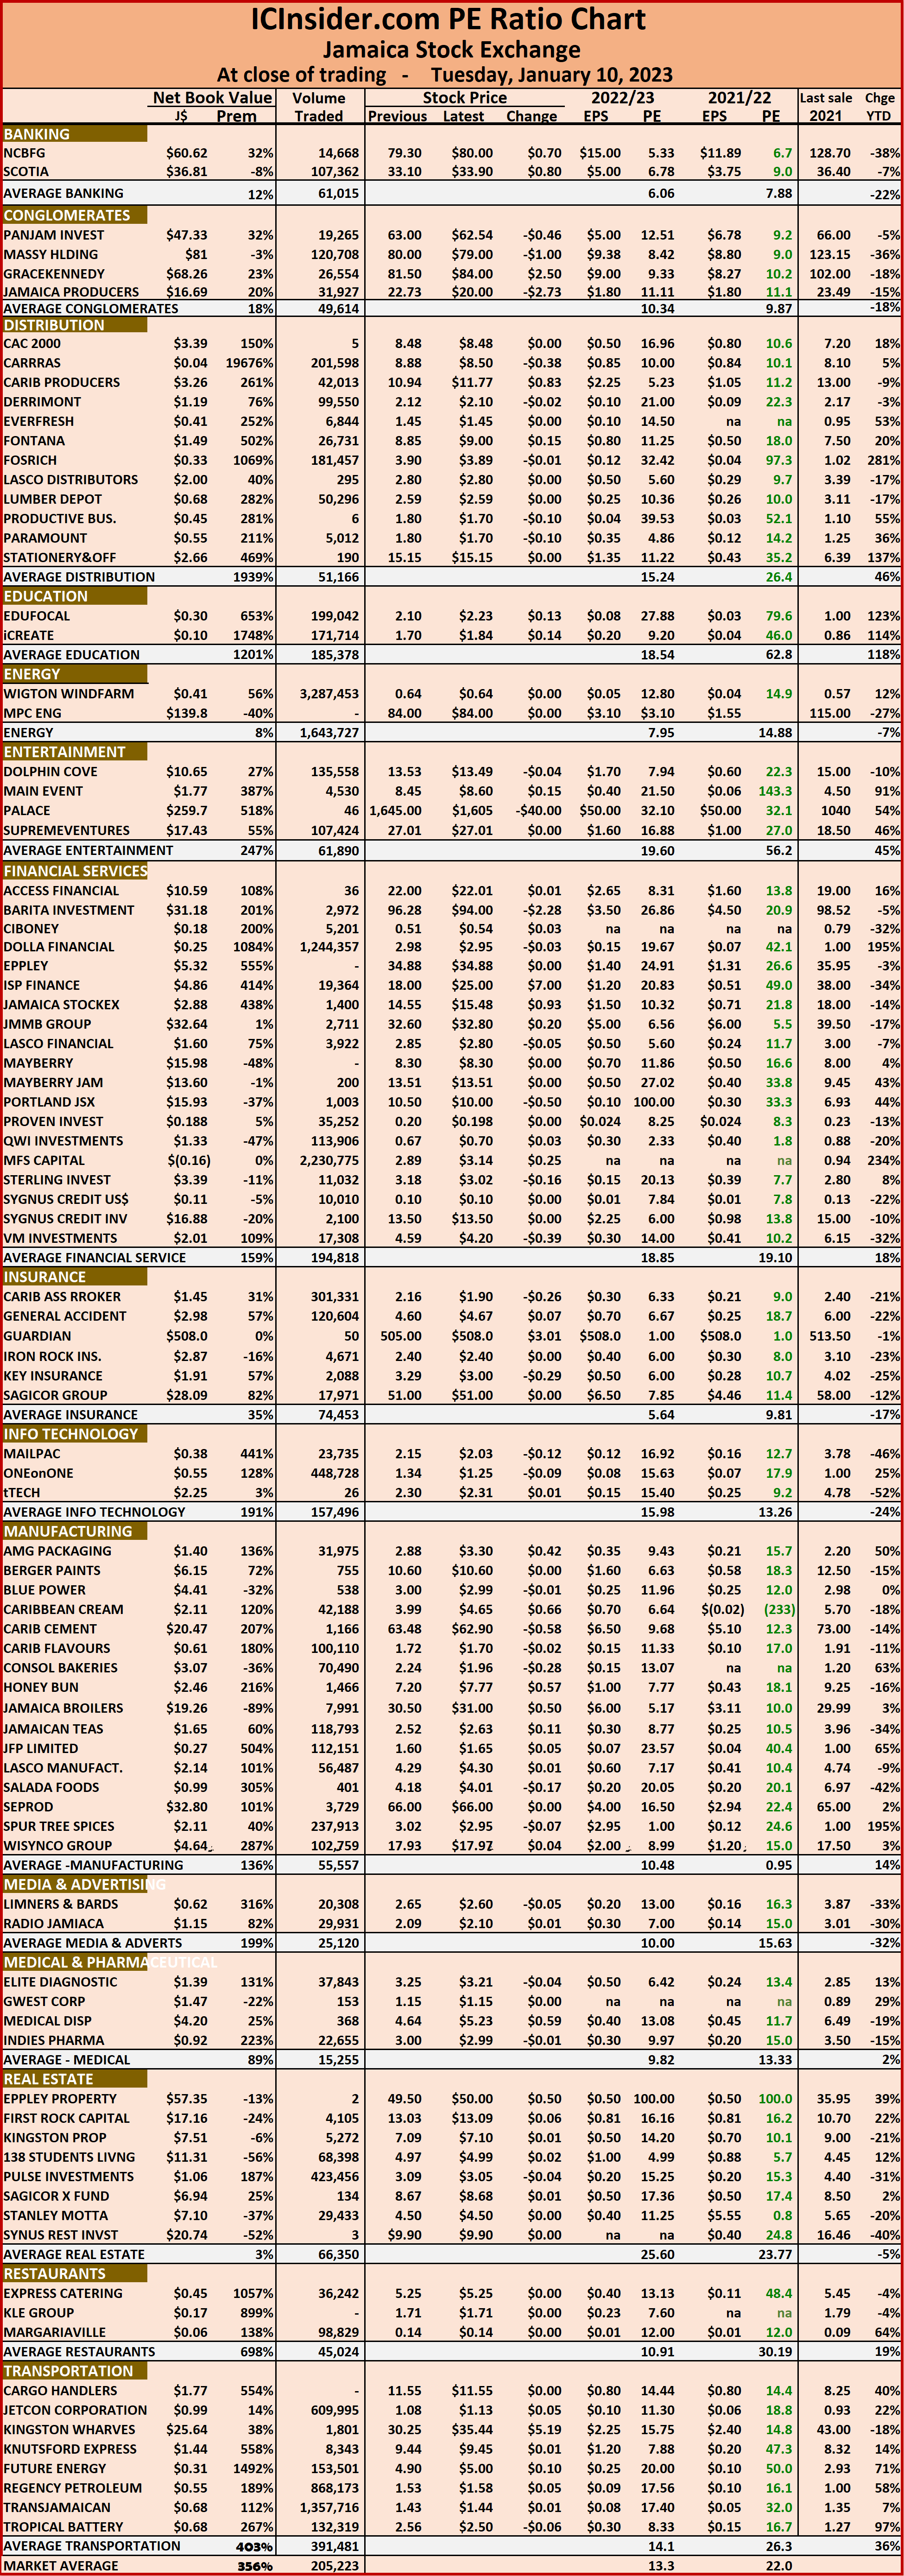 Dividends payable and yields for each company are shown in the Main and Junior Markets’ daily report charts that show the closing volume for the bids and offers.
The EPS & PE ratios are based on 2021 and 2022 actual or projected earnings, excluding major one off items. The PE Ratio is the most popular measure used to determine the value of stocks.