Activity surged on the Jamaica Stock Exchange on Wednesday with a giant rise in the volume and value of stocks exchanged, compared to Tuesday, resulting in Main Market indices and the Junior Market index declining and the JSE USD Market rising. At the end of trading the prices of 28 shares rose, 60 declined and 21 remained firm.
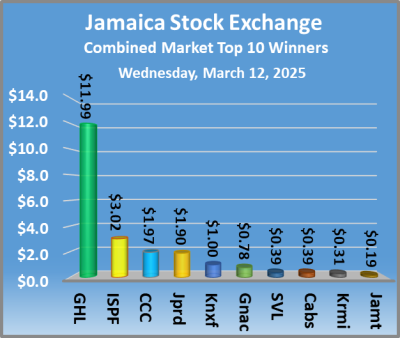 At the close of the market, the JSE Combined Market Index declined 1,664.06 points to 338,112.08, the All Jamaican Composite Index shed 2,456.91 points to 378,896.13, the JSE Main Index dropped by 1,497.96 points to 327,116.35, the Junior Market Index skidded 32.31 points to 3,527.89 and the JSE USD Market Index climbed 2.53 points to finish at 240.09.
At the close of trading, 51,449,996 shares were exchanged in all three markets, up from 29,654,488 units on Tuesday, with the value of stocks traded on the Junior and Main markets amounting to $498.42 million, up from $90 million on the previous day and the JSE USD market closed with an exchange of 648,148 shares for US$24,798 compared to 266,132 units at US$92,122 on Tuesday.
In Main Market activity, JMMB Group 10% preferred shares led with 21.52 million shares followed by Transjamaican Highway with 6.98 million stocks and GraceKennedy with 5.21 million units.
In Junior Market trading, MFS Capital Partners led with 2.02 million shares followed by Kintyre Holdings with 1.74 million stocks and ONE on ONE Educational with 934,062 units.
In the preference segment, 138 Student Living preference share dropped $40.07 to finish at $255, Productive Business Solutions 10.5% preference share sank $50 and ended at $1,000 and Sygnus Credit Investments C10.5% declined $3.95 to $96.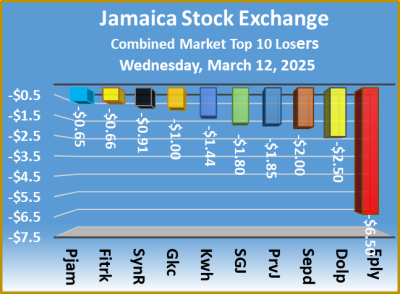 The market’s PE ratio, the most popular measure used to value stocks, ended at 12.6 based on 2024-25 earnings and 19.5 based on 2024 historical earnings. The ICInsider.com PE ratio chart and the other more detailed daily charts provide investors with regularly updated information to help decision-making. The PE ratio chart covers all ordinary shares listed on the Jamaica Stock Exchange, grouped by industry, allowing for easy comparisons within a sector and the overall market. The earnings per share (EPS) and PE ratios are based on 2024 and 2025 actual or projected earnings, excluding any major one time income or expense.
Pertinent information is required to navigate numerous investment options successfully in the stock market. The chart should be used in making rational decisions when investing in stocks close to the sector average, not going too far from it unless there are compelling reasons to do so. This approach helps to remove emotions from investment decisions and place them on fundamentals while at the same time not being too far from the majority of investors. Investors who buy when the price of a stock is close to the average will find that they are not inclined to overpay for a stock.  The net asset value of each company is incorporated into the chart. Investors can use this measure in assessing stock values. The chart also shows daily changes in stock prices and the percentage year to date price movement based on the last traded prices. Dividends that are paid or are due to be paid and yields for each company are shown in the Main and Junior Markets’ daily report charts, along with the closing volume of the highest bid and the lowest offer for each company.
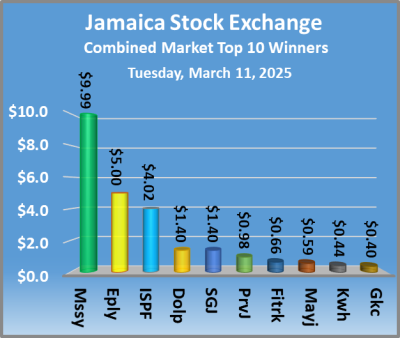 At the close of the market, the JSE Combined Market Index advanced 2,735.95 points to close at 339,776.14, the All Jamaican Composite Index dropped 881.85 points to end at 381,353.04, the JSE Main Index climbed 2,744.12 points to settle at 328,614.31, the Junior Market Index rose 15.57 points to 3,560.20 and the JSE USD Market Index declined 0.30 points to 237.56.
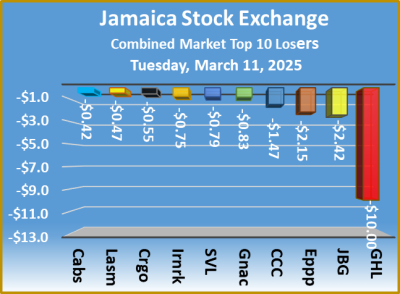 In the preferred segment, Eppley 7.25% preference share increased $2.03 to close at $19, at the same time 138 Student Living preference share climbed $35.83 to end at $295 and Productive Business Solutions 10.5% preference share rose $50 and ended at $1,050.

 The market closed with an exchange of 699,719 shares for US$22,846 down from 1,177,910 stocks at US$32,735 on Friday.
Trading averaged 99,960 shares at US$3,264 compared to 196,318 stocks at US$5,456 on Friday, with a month to date average of 79,294 units at US$3,558 in line with 74,471 stocks at US$3,626 on the previous day but below February that ended with an average of 115,433 units for US$5,430.
The US Denominated Equities Index jumped 16.36 points to cease trading at 237.86. The Investor’s Choice bid-offer indicator shows four stocks ending with bids higher than their last selling prices and none with a lower offer.
The PE Ratio, one of the best known measures to determine appropriate stock values, averages 11.6. The PE ratio is calculated based on last traded prices divided by projected earnings, computed by ICInsider.com for companies with financial year ending around August 2025.
 At the close, First Rock Real Estate USD share dropped 0.47 of one cent in closing at 1.62 US cents after 18,320 stock units passed through the market, Productive Business Solutions rallied 40 cents to US$1.85 with investors trading just 5 shares, Proven Investments remained at 10 US cents after a transfer of 13,855 stocks. Sterling Investments rose 0.17 of a cent to end at 1.87 US cents as investors exchanged 5,474 units, Sygnus Credit Investments sank 0.4 of a cent to finish at 6.6 US cents with a transfer of 8,400 shares and Transjamaican Highway ended at 2.5 US cents with 653,165 stock units crossing the market.
In the preference segment, Sygnus Credit Investments US 8% gained US$1.50 to end at US$10 with investors trading 500 units.
Prices of securities trading are those for the last transaction of each stock unless otherwise stated.
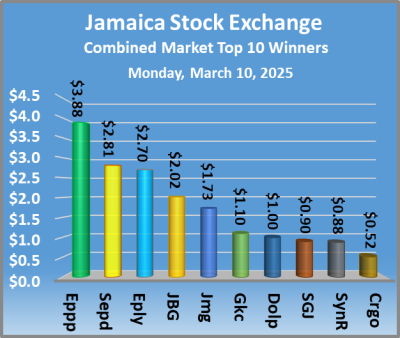
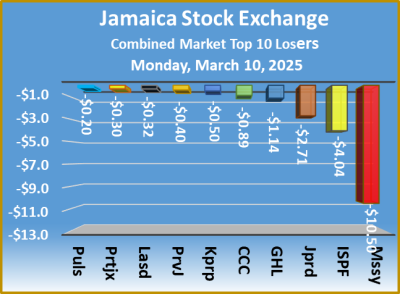 In Junior Market trading, EduFocal led with 1.91 million shares followed by Fosrich with 1.21 million stocks and Kintyre Holdings with 1.14 million units.

 At the close of the market, the JSE Combined Market Index increased 1,760.22 points to wrap up trading at 339,950.43, the All Jamaican Composite Index climbed 1,628.08 points to 381,038.54, the JSE Main Index gained 1,734.11 points to end at 328,873.32, the Junior Market Index rose 14.21 points to settle at 3,549.95 and the JSE USD Market Index slipped 1.26 points to 221.50.
 The market’s PE ratio, the most popular measure used to value stocks, ended at 13.6 based on 2024-25 earnings and 19.5 based on 2023-24 historical earnings. The ICInsider.com PE ratio chart and the other more detailed daily charts provide investors with
 The net asset value of each company is incorporated into the chart. Investors can use this measure in assessing stock values. The chart also shows daily changes in stock prices and the percentage year to date price movement based on the last traded prices. Dividends that are paid or are due to be paid and yields for each company are shown in the Main and Junior Markets’ daily report charts, along with the closing volume of the highest bid and the lowest offer for each company.

 Sygnus Credit Investments skidded 0.69 of one cent to close at 6.31 US cents trading 55,000 shares and Transjamaican Highway fell 0.07 of one cent to end at 2.31 US cents after a transfer of 178,647 units.
 At the close of the market, the JSE Combined Market Index slipped 648.47 points to conclude trading at 338,190.21, the All Jamaican Composite Index sank 1,140.91 points to end at 379,410.46, the JSE Main Index declined 470.75 points to 327,139.21, the Junior Market Index fell 27.68 points to end at 3,535.74 and the JSE USD Market Index slipped 1.13 points to finish at 222.76.
 The market’s PE ratio, the most popular measure used to value stocks, ended at 13.6 based on 2024-25 earnings and 19.6 based on 2023-24 historical earnings. The ICInsider.com PE ratio chart and the other more detailed daily charts provide investors with regularly updated information to help decision-making. The PE ratio chart covers all the ordinary shares that are quoted on the Jamaica Stock Exchange and grouped by industry, allowing for easy comparisons within a sector and the overall market. The earnings per share (EPS) and PE ratios are based on 2024 and 2025 actual or projected earnings, excluding any major one time income or expense.
 Investors who buy when the price of a stock is close to the average will find that they are not inclined to overpay for a stock. The net asset value of each company is incorporated into the chart. Investors can use this measure in assessing stock values. The chart also shows daily changes in stock prices and the percentage year to date price movement based on the last traded prices. Dividends that are paid or are due to be paid and yields for each company are shown in the Main and Junior Markets’ daily report charts, along with the closing volume of the highest bid and the lowest offer for each company.
 The market closed with an exchange of 233,083 shares for US$9,836 compared to 245,926 stocks at US$7,499 on Monday. Trading averaged 33,298 shares at US$1,405 up from 30,741 units at US$937 on Monday, with a month to date average of 31,934 shares at US$1,156 compared with an average of 115,433 units for US$5,430 in February
 Proven Investments dipped 0.2 of a cent to 11.3 US cents with investors dealing in 6,663 shares, Sterling Investments shed 0.02 of one cent and ended at 1.88 US cents in an exchange of 235 stocks. Sygnus Credit Investments ended at 7 US cents and closed with an exchange of 3,490 stock units and Transjamaican Highway fell 0.02 of one cent in closing at 2.38 US cents after 202,134 shares passed through the market.
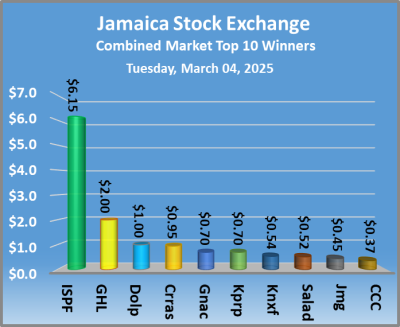 At the end of trading the prices of 32 shares rose, 40 declined and 28 remained firm.
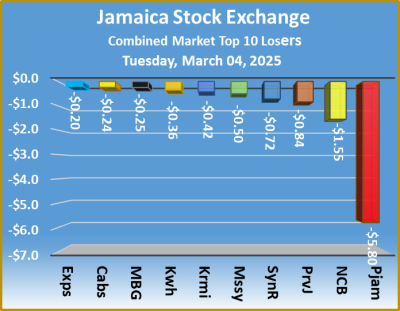 The market’s PE ratio, the most popular measure used to value stocks, ended at 13.8 based on 2024-25 earnings and 19.8 based on 2024 historical earnings. The ICInsider.com PE ratio chart and the other more detailed daily charts provide investors with regularly updated data to assist in decision-making. The PE ratio chart covers all the ordinary shares quoted on the Jamaica Stock Exchange and are grouped by industry, allowing for ease in comparisons within a sector and the overall market. The earnings per share (EPS) and PE ratios are based on 2024 and 2025 actual or projected earnings, excluding any major one time income or expense.
 The net asset value of each company is incorporated into the chart. Investors can use this measure in assessing stock values. The chart also shows daily changes in stock prices and the percentage year to date price movement based on the last traded prices. Dividends that are paid or are due to be paid and yields for each company are shown in the Main and Junior Markets’ daily report charts, along with the closing volume of the highest bid and the lowest offer for each company.
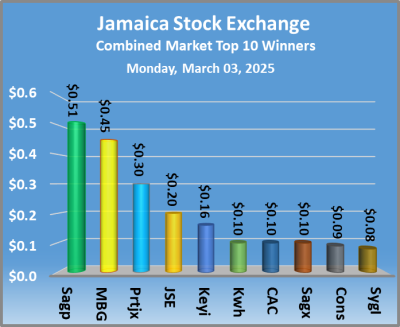
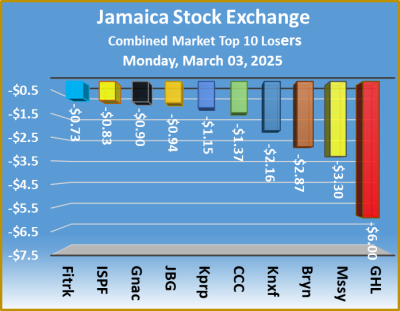 The market’s PE ratio, the most popular measure used to value stocks, ended at 13.7 based on 2023-24 earnings and 20 based on 2024-25 historical earnings. The ICInsider.com PE ratio chart and the other more detailed daily charts provide investors with regularly updated information to help decision making. The PE ratio chart covers all ordinary shares listed on the Jamaica Stock Exchange, grouped by industry, allowing for easy comparisons within a sector and the overall market. The earnings per share (EPS) and PE ratios are based on 2024 and 2025 actual or projected earnings, excluding any major one time income or expense.
 The net asset value of each company is incorporated into the chart. Investors can use this measure in assessing stock values. The chart also shows daily changes in stock prices and the percentage year to date price movement based on the last traded prices. Dividends that are paid or are due to be paid and yields for each company are shown in the Main and Junior Markets’ daily report charts, along with the closing volume of the highest bid and the lowest offer for each company.