In a slow trading session on Thursday, the Main Market of the Jamaica Stock Exchange resulted in marginal changes to the primary indices as the Junior Market finished down from Wednesday’s close and the JSE USD ended marginally lower with the volume and value of stocks changing hands falling, resulting in prices of only 24 shares rising and 43 declining.
 At the close of the market, the JSE Combined Market Index climbed 727.53 points to 328,374.19, the All Jamaican Composite Index gained 961.07 points to 353,433.03, the JSE Main Index dropped 477.47 points to 315,932.85. The Junior Market Index fell 38.18 points to end trading at 3,660.89 and the JSE USD Market Index slipped 0.74 points to 219.12.
At the close of trading, 12,816,438 shares were exchanged in all three markets, from 14,069,009 units on Wednesday, with the value of stocks traded on the Junior and Main markets amounted to $58.16 million, below the $70.97 million on the previous trading day and the JSE USD market closed with an exchange of 63,388 shares for US$42,622 compared to 105,065 units at US$5,087 on Wednesday.
In Main Market activity, Sagicor Select Financial Fund led trading with 1.82 million shares followed by Transjamaican Highway with 1.37 million stock units and QWI Investments with 1.0 million units.
In Junior Market trading, iCreate led trading with 1.92 million shares after the lifting of suspension on Wednesday followed by the recently listed Omni Industries with 1.20 million stocks and One Great Studio with 550,803 units.
In the preference segment, Eppley 7.50% preference share rose $1 and ended at $6.50 and Jamaica Public Service 7% rallied $1.99 to end at $47.99.
 The market’s PE ratio, the most popular measure used to determine the value of stocks, ended at 21.1 on 2023-24 earnings and 13.3 times those for 2024-25 at the close of trading. ICInsider.com PE ratio chart and the more detailed daily charts provide investors with regularly updated information to help decision-making.
The PE ratio chart covers all ordinary shares on the Jamaica Stock Exchange, grouped by industry, allowing for easy comparisons within a sector and the overall market. The EPS and PE ratios are based on 2023 and 2024 actual or projected earnings, excluding major one off items.
Pertinent information is required to navigate numerous investment options successfully in the stock market. The ICInsider.com PE ratio chart and the more detailed daily report charts provide investors with regularly updated information to help decision-making.
The chart should be used in making rational decisions when investing in stocks close to the average for the sector, not going too far from it unless there are compelling reasons to do so. This approach helps to remove emotions from investment decisions and place them on fundamentals while at the same time not being too far from the majority of investors. Investors who buy when the price of a stock is close to the average will find that they are not inclined to overpay for a stock.
 The net asset value of each company is reported as a guide for investors to quickly assess the value of stocks based on this measure. The chart also shows daily changes in stock prices and the percentage year to date price movement based on the last traded prices.
Dividends paid or payable and yields for each company are shown in the Main and Junior Markets’ daily report charts, along with the closing volume of the highest bid and the lowest offer for each company.
Mixed out turn for Jamaica Stock Exchange
Prices of 50 stocks rose and 32 declined at the close of trading on the Jamaica Stock Exchange on Wednesday even as the number and value of stocks changing hands fell, below that of the previous day and ended with a solid rise in the Junior Market and a modest increase in JSE USD market, in contrast, the Main market lost ground at the close.
 At the close of trading, the JSE Combined Market Index shed 894.41 points to close at 329,101.72, the All Jamaican Composite Index declined 1,016.07 points to end at 352,471.96, the JSE Main Index dropped 1,265.04 points to 316,410.32. The Junior Market Index jumped 44.70 points to wrap up trading at 3,699.07 and the JSE USD Market Index rose 0.88 points to wrap-up trading at 219.86.
At the close of trading, 14,069,009 shares were exchanged in all three markets, down from 18,079,463 units on Tuesday, with the value of stocks traded on the Junior and Main markets amounted to $70.97 million, well below the $98.07 million on the previous trading day and the JSE USD market closed with an exchange of 105,065 shares for US$5,087 compared to 184,675 units at US$7,820 on Tuesday.
In Main Market activity, Sagicor Select Financial Fund led trading with 3.24 million shares followed by JMMB Group with 1.26 million stock units and Wigton Windfarm with 949,260 units
In Junior Market trading, Omni Industries that was listed last week and led trading with 1.98 million shares followed by iCreate that was trading for the first time since the suspension in the shares was lifted ended with 810,288 stocks and Dolla Financial with 586,952 units.
 In the preference segment, Eppley 7.50% preference share shed $1 to end at $5.50, Jamaica Public Service 7% added $1 to finish at $46 and Productive Business Solutions 10.5% preference share dropped $50.03 to $1,050.
The market’s PE ratio, the most popular measure used to determine the value of stocks, ended at 21.2 on 2023-24 earnings and 13.4 times those for 2024-25 at the close of trading. ICInsider.com PE ratio chart and the more detailed daily charts provide investors with regularly updated information to help decision-making.
The PE ratio chart covers all ordinary shares on the Jamaica Stock Exchange, grouped by industry, allowing for easy comparisons within a sector and the overall market. The EPS & PE ratios are based on 2023 and 2024 actual or projected earnings, excluding major one off items.
Pertinent information is required to navigate numerous investment options successfully in the stock market. The ICInsider.com PE ratio chart and the more detailed daily report charts provide investors with regularly updated information to help decision-making.
The chart should be used in making rational decisions when investing in stocks close to the average for the sector, not going too far from it unless there are compelling reasons to do so. This approach helps to remove emotions from investment decisions and place them on fundamentals while at the same time not being too far from the majority of investors.  Investors who buy when the price of a stock is close to the average will find that they are not inclined to overpay for a stock.
The net asset value of each company is reported as a guide for investors to quickly assess the value of stocks based on this measure. The chart also shows daily changes in stock prices and the percentage year to date price movement based on the last traded prices.
Dividends paid or payable and yields for each company are shown in the Main and Junior Markets’ daily report charts, along with the closing volume of the highest bid and the lowest offer for each company.
AS Bryden jumps $5 as JSE markets cooled
Junior Market stocks suffered a sizable fall at the close of the Jamaica Stock Exchange trading on Tuesday but the Main Market JSE index recorded a mild rise and the JSE USD market closed marginally down as trading ended with the number and value of stocks changing hands fell below the previous day, resulting in prices of 23 shares rising including AS Bryden that jumped by $5 and 45 declining.
 At the close of the market, the JSE Combined Market Index declined 166.40 points to close at 329,996.13, the All Jamaican Composite Index dipped 2,008.17 points to conclude trading at 353,488.03, the JSE Main Index popped some 304.05 points to 317,675.36. The Junior Market Index dropped 64.59 points to 3,654.37 and the JSE USD Market Index dipped 0.93 points to conclude trading at 218.98.
At the close of trading, 18,079,463 shares were exchanged in all three markets, down from 18,502,297 units on Monday, with the value of stocks traded on the Junior and Main markets amounted to $98.07 million, well below the $220.98 million on the previous trading day and the JSE USD market closed with an exchange of 184,675 shares for US$7,820 compared to 533,385 units at US$13,379 on Monday.
In Main Market activity, Sygnus Credit Investments led trading with 1.46 million shares followed by JMMB 9.5% preference share with 1.37 million stock units and Transjamaican Highway with 1.18 million units.
In Junior Market trading, Express Catering led trading with 6.03 million shares followed by Omni Industries with 2.78 million units and Dolla Financial with 525,516 stocks.
In the preference segment, Eppley 7.50% preference share increased $1 to $6.50 and Jamaica Public Service 7% dipped $3 to finish at $45.
 The market’s PE ratio, the most popular measure used to value stocks, ended at 20.9 on 2023-24 earnings and 13.3 times those for 2024-25 at the close of trading. ICInsider.com PE ratio chart and the more detailed daily charts provide investors with regularly updated information to help decision-making.
The PE ratio chart covers all ordinary shares on the Jamaica Stock Exchange, grouped by industry, allowing for easy comparisons within a sector and the overall market. The EPS & PE ratios are based on 2023 and 2024 actual or projected earnings, excluding major one off items.
Pertinent information is required to navigate numerous investment options successfully in the stock market. The ICInsider.com PE ratio chart and the more detailed daily report charts provide investors with regularly updated information to help decision-making.
The chart should be used in making rational decisions when investing in stocks close to the average for the sector, not going too far from it unless there are compelling reasons to do so. This approach helps to remove emotions from investment decisions and place them on fundamentals while at the same time not being too far from the majority of investors. Investors who buy when the price of a stock is close to the average will find that they are not inclined to overpay for a stock.
 The net asset value of each company is reported as a guide for investors to quickly assess the value of stocks based on this measure. The chart also shows daily changes in stock prices and the percentage year to date price movement based on the last traded prices.
Dividends paid or payable and yields for each company are shown in the Main and Junior Markets’ daily report charts, along with the closing volume of the highest bid and the lowest offer for each company.
Stocks struggled on Jamaica Stock Exchange
Stocks recorded marginal gains for the Junior Market of the Jamaica Stock Exchange with the Main Market and JSE USD market closing moderately lower as trading ended with the number of stocks changing hands falling, but with a higher value than on the previous Friday, resulting in prices of 40 shares rising and 35 declining.
 At the close of trading, the JSE Combined Market Index climbed 4,477.60 points to 330,162.54, the All Jamaican Composite Index dived 1,074.34 points to 355,496.20, the JSE Main Index shed 4,686.69 points to end trading at 317,371.31. The Junior Market Index popped 1.27 points to close at 3,718.96 and the JSE USD Market Index lost 2.04 points to end the day at 219.91.
At the close of trading, 18,502,297 shares were exchanged in all three markets, down from 25,075,060 units on Friday, with the value of stocks traded on the Junior and Main markets amounted to $220.98 million, well above the $160.33 million on the previous trading day and the JSE USD market closed with an exchange of 533,385 shares for US$13,379 compared to 36,637 units at US$5,319 on Friday.
In Main Market activity, NCB Financial led trading with 3.04 million shares followed by Transjamaican Highway with 2.29 million units, Wigton Windfarm was next with 1.42 million stock units, JMMB 9.5% preference share closed with 1.38 million shares and Sagicor Select Financial Fund with 1.17 million stocks.
In Junior Market trading, Omni Industries led trading with 2.27 million shares followed by Future Energy with 535,987 units and Dolla Financial with 534,594 stocks.
In the preference segment, Eppley 7.50% preference share shed $1.49 to end at $5.50, Jamaica Public Service 7% climbed $3 to end at $48, Productive Business Solutions 10.5% preference share dropped $99.99 to close at $1100 and Sygnus Credit Investments C10.5% rallied $12.55 and ended at $108
 The market’s PE ratio, the most popular measure used to determine the value of stocks, ended at 21.4 on 2023-24 earnings and 13.4 times those for 2024-25 at the close of trading. ICInsider.com PE ratio chart and the more detailed daily charts provide investors with regularly updated information to help decision-making.
The PE ratio chart covers all ordinary shares on the Jamaica Stock Exchange, grouped by industry, allowing for easy comparisons within a sector and the overall market. The EPS & PE ratios are based on 2023 and 2024 actual or projected earnings, excluding major one off items.
Pertinent information is required to navigate numerous investment options successfully in the stock market. The ICInsider.com PE ratio chart and the more detailed daily report charts provide investors with regularly updated information to help decision-making.
The chart should be used in making rational decisions when investing in stocks close to the average for the sector, not going too far from it unless there are compelling reasons to do so. This approach helps to remove emotions from investment decisions and place them on fundamentals while at the same time not being too far from the majority of investors. Investors who buy when the price of a stock is close to the average will find that they are not inclined to overpay for a stock.
 The net asset value of each company is reported as a guide for investors to quickly assess the value of stocks based on this measure. The chart also shows daily changes in stock prices and the percentage year to date price movement based on the last traded prices.
Dividends paid or payable and yields for each company are shown in the Main and Junior Markets’ daily report charts, along with the closing volume of the highest bid and the lowest offer for each company.
Gains for all JSE Markets
Rising stocks pushed the Jamaica Stock Exchange three markets higher on Friday to end the week, resulting in prices of 29 shares rising and 32 declining as the market closed with an increase in the number of stocks changing hands, with a higher value over the previous trading day after Guardian Holdings dropped $15 to be the leading price mover.
 At the close of trading on Friday, the JSE Combined Market Index rallied 2,179.26 points to 334,640.14, the All Jamaican Composite Index slipped 158.45 points to close at 356,570.54, the JSE Main Index rose 2,061.91 points to end trading at 322,058.00. The Junior Market Index climbed 29.00 points to close at 3,717.69, after hitting 3760 points in the morning session and the JSE USD Market Index rose 2.09 points to end the day at 221.95.
At the close of trading, 25,075,060 shares were exchanged in all three markets, up from 24,103,951 units on Thursday, with the value of stocks traded on the Junior and Main markets amounted to $160.33 million, a fraction more than the $153 million on the previous trading day and the JSE USD market closed with an exchange of 36,637 shares for US$5,319 compared to 456,359 units at US$13,103 on Thursday.
In Main Market activity, Wigton Windfarm led trading with 7.43 million shares followed by Sagicor Select Financial Fund with 5.13 million units, GraceKennedy was next with 1.51 million shares, Sagicor Select Manufacturing & Distribution Fund closed with 1.46 million stock and JMMB 9.5% preference share with 1.23 million units.
 In the Junior Market, Omni Industries was the leading traded stock with 2.45 million units, to be followed by Lasco Financial with 575,941 stock units and Dolla Financial with 569,701 units.
In the preference segment, no stock ended with a notable price change.
The market’s PE ratio, the most popular measure used to determine the value of stocks, ended at 21.4 based on 2023-24 earnings and 13.3 times those for 2024-25 at the close of trading. ICInsider.com PE ratio chart and the more detailed daily charts provide investors with regularly updated information to help decision-making.
The PE ratio chart covers all ordinary shares on the Jamaica Stock Exchange, grouped by industry, allowing for easy comparisons within a sector and the overall market. The EPS & PE ratios are based on 2023 and 2024 actual or projected earnings, excluding major one off items.
Pertinent information is required to navigate numerous investment options successfully in the stock market. The ICInsider.com PE ratio chart and the more detailed daily report charts provide investors with regularly updated information to help decision-making.
The chart should be used in making rational decisions when investing in stocks close to the average for the sector, not going too far from it unless there are compelling reasons to do so. This approach helps to remove emotions from investment decisions and place them on fundamentals while at the same time not being too far from the majority of investors. Investors who buy when the price of a stock is close to the average will find that they are not inclined to overpay for a stock.
 The net asset value of each company is reported as a guide for investors to quickly assess the value of stocks based on this measure. The chart also shows daily changes in stock prices and the percentage year to date price movement based on the last traded prices.
Dividends paid or payable and yields for each company are shown in the Main and Junior Markets’ daily report charts, along with the closing volume of the highest bid and the lowest offer for each company.
More money poured into the JSE Markets
More funds chased after stocks on the Jamaica Stock Exchange on Thursday as investors received far fewer shares for their money than the previous day, resulting in Main Market stocks pushing the market index higher at the close, with the Junior and the JSE USD markets closing moderately lower, resulting in prices of 26 shares rising and 32 declining.
 At the close of trading, the JSE Combined Market Index climbed 1,158.09 points to 332,460.88, the All Jamaican Composite Index rallied 2,126.19 points to 356,728.99, the JSE Main Index jumped 1,388.74 points to 319,996.09. The Junior Market Index dipped 24.19 points to 3,688.69 and the JSE USD Market Index sank 0.15 points to cease trading at 219.86.
At the close of trading, 24,103,951 shares were exchanged in all three markets, down from 35,215,094 units on Wednesday, with the value of stocks traded on the Junior and Main markets amounted to $153 million, well over the $116.12 million on the previous trading day and the JSE USD market closed with an exchange of 456,359 shares for US$13,103 compared to 75,761 units at US$14,761 on Wednesday.
In Main Market activity, Transjamaican Highway led trading with 6.77 million shares followed by Carreras with 2.01 million units and Sagicor Select Financial Fund with 1.27 million stock units.
In Junior Market trading, Omni Industries led trading with 4.40 million shares followed by Dolla Financial with 692,171 units and Fontana with 631,273 stock units.
 In the preference segment, Sygnus Credit Investments C10.5% slipped $16.86 and ended at $95.45
The market’s PE ratio, the most popular measure used to determine the value of stocks, ended at 21.5 on 2023-24 earnings and 13.2 times those for 2024-25 at the close of trading. ICInsider.com PE ratio chart and the more detailed daily charts provide investors with regularly updated information to help decision-making.
The PE ratio chart covers all ordinary shares on the Jamaica Stock Exchange, grouped by industry, allowing for easy comparisons within a sector and the overall market. The EPS & PE ratios are based on 2023 and 2024 actual or projected earnings, excluding major one off items.
Pertinent information is required to navigate numerous investment options successfully in the stock market. The ICInsider.com PE ratio chart and the more detailed daily report charts provide investors with regularly updated information to help decision-making.
The chart should be used in making rational decisions when investing in stocks close to the average for the sector, not going too far from it unless there are compelling reasons to do so. This approach helps to remove emotions from investment decisions and place them on fundamentals while at the same time not being too far from the majority of investors. Investors who buy when the price of a stock is close to the average will find that they are not inclined to overpay for a stock.
 The net asset value of each company is reported as a guide for investors to quickly assess the value of stocks based on this measure. The chart also shows daily changes in stock prices and the percentage year to date price movement based on the last traded prices.
Dividends paid or payable and yields for each company are shown in the Main and Junior Markets’ daily report charts, along with the closing volume of the highest bid and the lowest offer for each company.
Junior Market bounces Main others steady
The Junior Market of the Jamaica Stock Exchange bounced back sharply at the close of trading on Wednesday as the Main and JSE USD markets slipped, with the number of stocks changing hands jumping, with a slightly higher value over the previous day, with newly listed Omni Industries accounting for close to half of the day’s volume, with the overall value of the trades rising over that on Tuesday and resulting in prices of 39 shares rising and 33 declining.
 At the close of the market, the JSE Combined Market Index popped 542.32 points to 331,302.79, the All Jamaican Composite Index sank 1,772.18 points to 354,602.80, the JSE Main Index slipped 9.30 points to finish at 318,607.35. The Junior Market Index jumped 77.82 points to close trading at 3,712.88 and the JSE USD Market Index dipped by just 0.13 points to 220.01.
At the close of trading, 35,215,094 shares were exchanged in all three markets, up from 20,644,795 units on …day, with the value of stocks traded on the Junior and Main markets amounted to $116.12 million, compared to $112.91 million on the previous trading day and the JSE USD market closed with an exchange of 75,761 shares for US$14,761 compared to 89,247 units at US$3,105 on Tuesday.
In Main Market activity, Sagicor Select Financial Fund led trading with 2.13 million shares followed by Transjamaican Highway with 1.78 million units, Wigton Windfarm with 1.27 million stocks and Sygnus Credit Investments with 1.03 million shares.
In Junior Market trading, newly listed Omni Industries led trading with 15.80 million shares followed by Lasco Financial with 2.64 million units and Future Energy with 2.50 million stocks.
 There were no preference shares with notable price changes.
The market’s PE ratio, the most popular measure used to determine the value of stocks, ended at 21.4 on 2023-24 earnings and 13.3 times those for 2024-25 at the close of trading. ICInsider.com PE ratio chart and the more detailed daily charts provide investors with regularly updated information to help decision-making.
The PE ratio chart covers all ordinary shares on the Jamaica Stock Exchange, grouped by industry, allowing for easy comparisons within a sector and the overall market. The EPS & PE ratios are based on 2023 and 2024 actual or projected earnings, excluding major one off items.
Pertinent information is required to navigate numerous investment options successfully in the stock market. The ICInsider.com PE ratio chart and the more detailed daily report charts provide investors with regularly updated information to help decision-making.
The chart should be used in making rational decisions when investing in stocks close to the average for the sector, not going too far from it unless there are compelling reasons to do so. This approach helps to remove emotions from investment decisions and place them on fundamentals while at the same time not being too far from the majority of investors. Investors who buy when the price of a stock is close to the average will find that they are not inclined to overpay for a stock.
 The net asset value of each company is reported as a guide for investors to quickly assess the value of stocks based on this measure. The chart also shows daily changes in stock prices and the percentage year to date price movement based on the last traded prices.
Dividends paid or payable and yields for each company are shown in the Main and Junior Markets’ daily report charts, along with the closing volume of the highest bid and the lowest offer for each company.
Trading dipped on JSE as Omni lists
Shares of the Jamaica Stock Exchange, the latest initial public offer of stocks were listed on the Junior Market on Tuesday and jumped 30 percent in closing at $1.30, with investors trading 3.9 million shares declined in trading on Tuesday as the Junior Market declined. The Main market eked out a modest rise but the JSE USD market closed lower as trading ended with the number and the value of stocks changing hands falling, resulting in prices of 39 shares declining and 28 rising.
 At the close of trading, the JSE Combined Market Index rose 189.22 points to close at 330,760.47, the All Jamaican Composite Index skidded 975.19 points to wrap up trading at 356,374.98, the JSE Main Index popped 526.71 points to end the day at 318,616.65. The Junior Market Index dropped 44.47 points to 3,635.06, with FESCO dropping in the morning session to a 52 weeks’ low of $2.50, with an average price of $2.90 and would have had a major pull on the index. The JSE USD Market Index fell 2.98 points to lock up trading at 220.14.
At the close of trading, 20,644,795 shares were exchanged in all three markets, down from 35,226,914 units on Monday, with the value of stocks traded on the Junior and Main markets amounting to $112.91 million, well below the $192.21, million on the previous trading day and the JSE USD market closed with an exchange of 89,247 shares for US$3,105 compared to 147,490 units at US$59,542 on Monday.
In Main Market activity, Palace Amusement led trading with 1.72 million shares followed by Sagicor Select Manufacturing & Distribution Fund with 1.56 million units and Sagicor Select Financial Fund with 1.47 million stocks.
 In Junior Market trading, Omni Industries led trading with 3.90 million shares followed by Future Energy with 1.33 million units, then Dolla Financial with 1.15 million shares and Fosrich with 1.04 million units.
In the preference segment, 138 Student Living preference share dipped $28.18 and ended at $159.70 with investors swapping 46 units and Sygnus Credit Investments C10.5% lost $2.69 to finish at $112.31
The market’s PE ratio, the most popular measure used to determine the value of stocks, ended at 21.1 on 2023-24 earnings and 13.2 times those for 2024-25 at the close of trading. ICInsider.com PE ratio chart and the more detailed daily charts provide investors with regularly updated information to help decision-making.
The PE ratio chart covers all ordinary shares on the Jamaica Stock Exchange, grouped by industry, allowing for easy comparisons within a sector and the overall market. The EPS & PE ratios are based on 2023 and 2024 actual or projected earnings, excluding major one off items.
Pertinent information is required to navigate numerous investment options successfully in the stock market. The ICInsider.com PE ratio chart and the more detailed daily report charts provide investors with regularly updated information to help decision-making.
The chart should be used in making rational decisions when investing in stocks close to the average for the sector, not going too far from it unless there are compelling reasons to do so. This approach helps to remove emotions from investment decisions and place them on fundamentals while at the same time not being too far from the majority of investors. Investors who buy when the price of a stock is close to the average will find that they are not inclined to overpay for a stock.
 The net asset value of each company is reported as a guide for investors to quickly assess the value of stocks based on this measure. The chart also shows daily changes in stock prices and the percentage year to date price movement based on the last traded prices.
Dividends paid or payable and yields for each company are shown in the Main and Junior Markets’ daily report charts, along with the closing volume of the highest bid and the lowest offer for each company.
Decline for JSE markets
Falling prices pushed down all three Jamaica Stock Exchange markets in trading on Monday as trading ended with the number and value of stocks changing hands rising over the previous trading day, resulting in prices of 44 shares falling and only 22 rising.
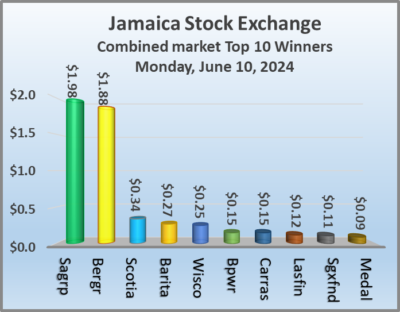 At the close of trading, the JSE Combined Market Index dropped 2,762.38 points to 330,571.24, the All Jamaican Composite Index dived 3,400.86 points to 357,350.17, the JSE Main Index sank 2,739.68 points to 318,089.94. The Junior Market Index lost 19.53 points to conclude trading at 3,679.53 and the JSE USD Market Index dipped 0.93 points to wrap up trading at 223.12.
At the close of trading, 35,226,914 shares were exchanged in all three markets, up from 32,074,516 units on Friday, with the value of stocks traded on the Junior and Main markets amounted to $192.21 million, well above the $108.76 million on the previous trading day and the JSE USD market closed with an exchange of 147,490 shares for US$59,542 compared to 20,041 units at US$2,072 on Friday.
In Main Market activity, Wigton Windfarm led trading with 8.40 million shares followed by JMMB 9.5% preference share with 5.63 million units, Sagicor Select Financial Fund closed with 4.89 million stock units, Sagicor Select Manufacturing & Distribution Fund traded 2.47 million units, Palace Amusement ended with 1.58 million shares and Transjamaican Highway with 1.33 million units.
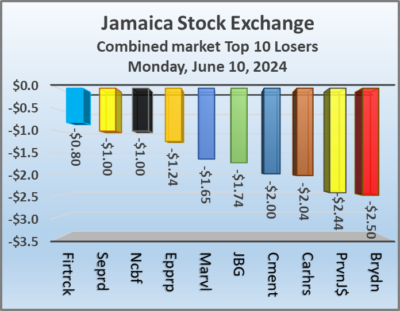 In Junior Market trading, JFP Ltd led trading with 981,369 shares followed by Express Catering with 676,059 units and Derrimon Trading with 495,470 shares.
In the preference segment, no stocks closed with a notable price change.
The market’s PE ratio, the most used measure to determine the value of stocks, ended at 21.3 on 2023-24 earnings and 13.3 times those for 2024-25 at the close of trading. ICInsider.com PE ratio chart and the more detailed daily charts provide regularly updated information to help decision-making.
The PE ratio chart covers all ordinary shares on the Jamaica Stock Exchange, grouped by industry, allowing for easy comparisons within a sector and the overall market. The EPS & PE ratios are based on 2023 and 2024 actual or projected earnings, excluding major one off items.
Pertinent information is required to navigate numerous investment options successfully in the stock market. The ICInsider.com PE ratio chart and the more detailed daily report charts provide investors with regularly updated information to help decision-making.
The chart should be used in making rational decisions when investing in stocks close to the average for the sector, not going too far from it unless there are compelling reasons to do so. This approach helps to remove emotions from investment decisions and place them on fundamentals while at the same time not being too far from the majority of investors. Investors who buy when the price of a stock is close to the average will find that they are not inclined to overpay for a stock.
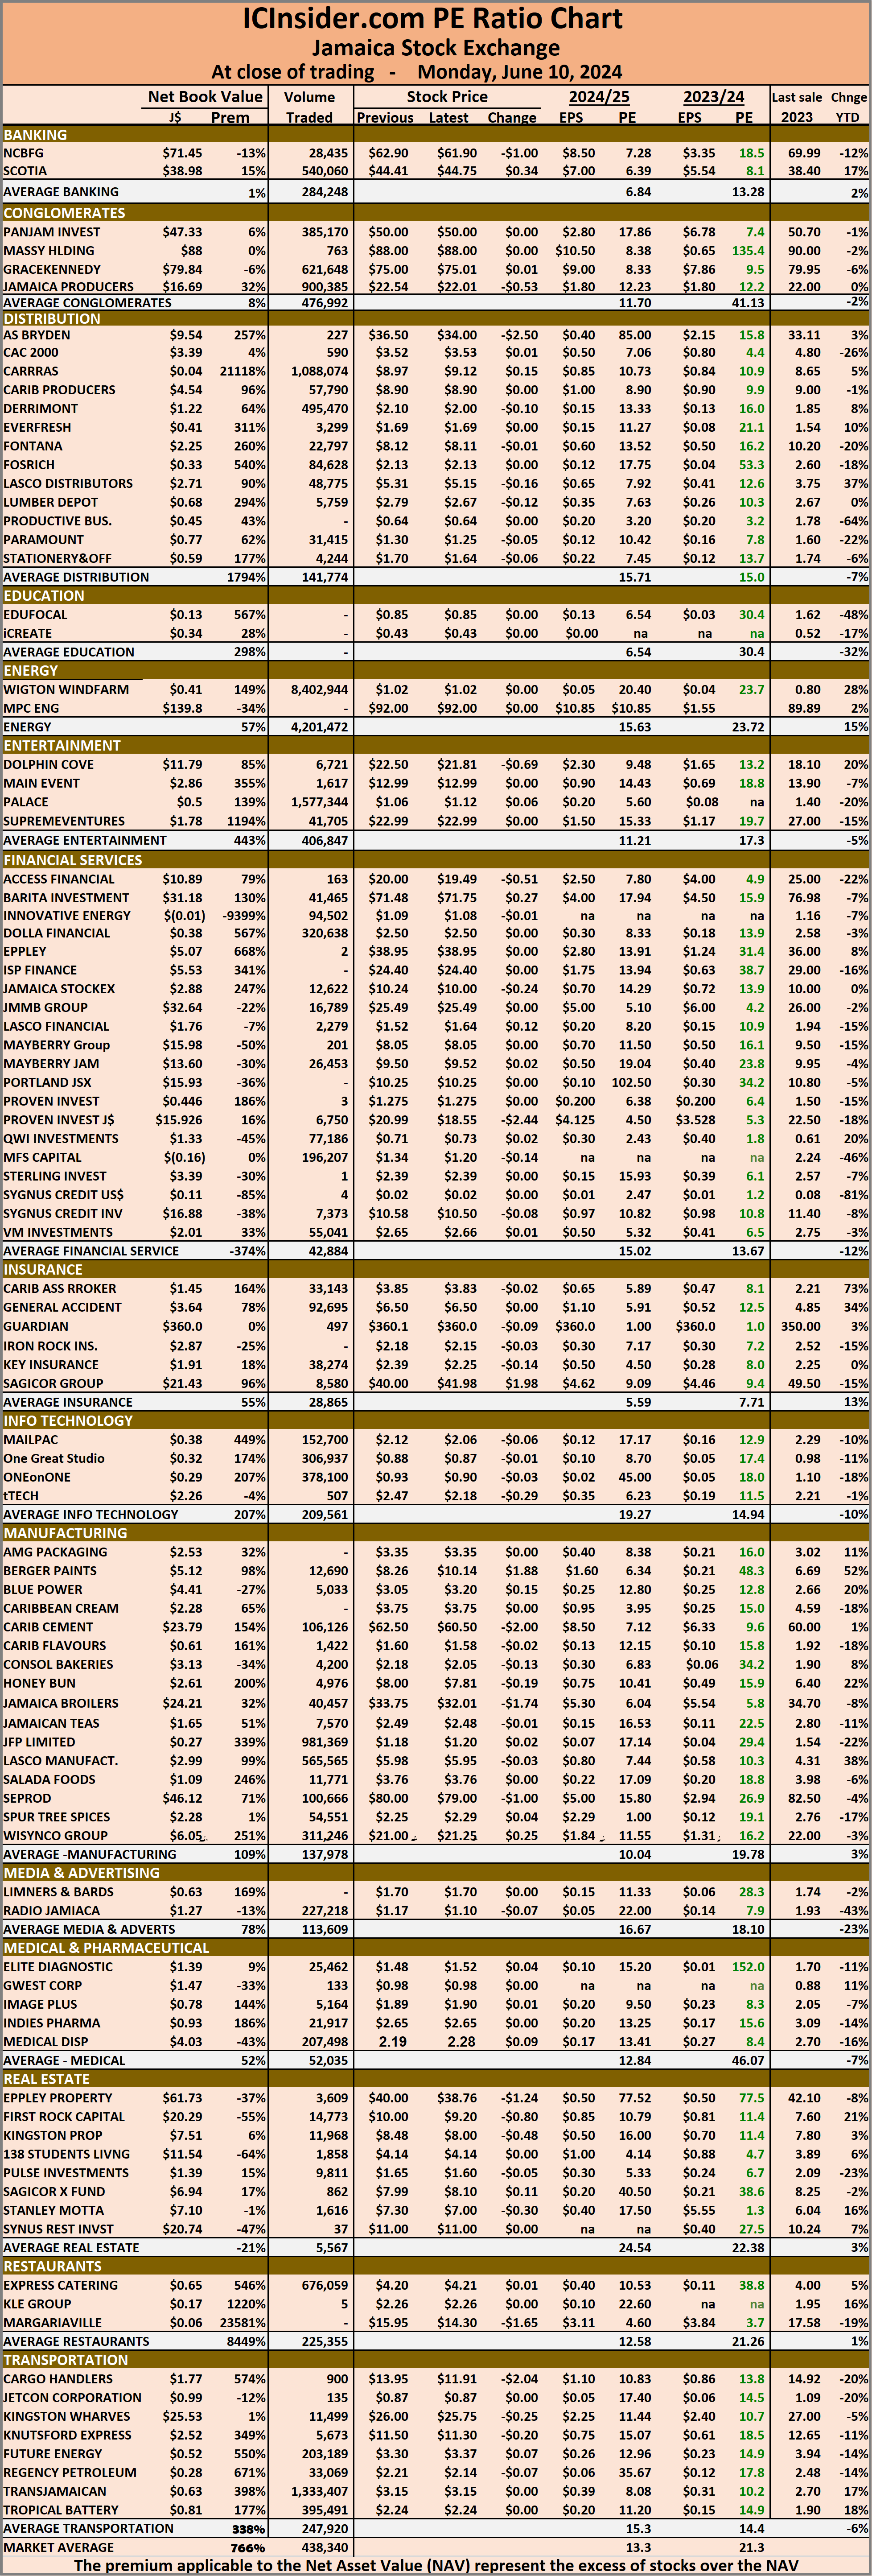 The net asset value of each company is reported as a guide for investors to quickly assess the value of stocks based on this measure. The chart also shows daily changes in stock prices and the percentage year to date price movement based on the last traded prices.
Dividends paid or payable and yields for each company are shown in the Main and Junior Markets’ daily report charts, along with the closing volume of the highest bid and the lowest offer for each company.
Transjamaican & Wigton dominate JSE trading
Transjamaican Highway dominated trading on the Jamaica Stock Exchange with nearly 17 million shares followed by Wigton Windfarm with 8 million units as trading on Friday exceeded Thursday’s outturn as investors moved the Main Market higher, as the Junior Market and the JSE USD market closed lower and resulting in prices of 31 shares rising and 32 declining.
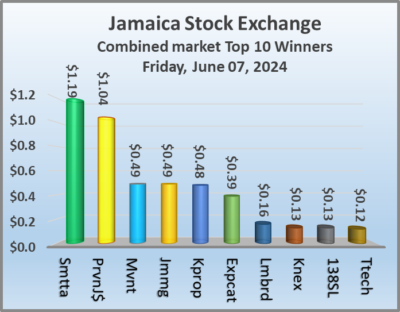 At the close of trading, the JSE Combined Market Index dropped 1,091.82 points to 333,333.62, the All Jamaican Composite Index popped 409.02 points to 360,751.03, the JSE Main Index sank 854.79 points to 320,829.62. The Junior Market fell 39.08 points to 3,699.06 and the JSE USD Market Index dipped 0.14 points to close at 224.05.
At the close of trading, 32,074,516 shares were exchanged in all three markets, up from 16,806,355 units on Thursday, with the value of stocks traded on the Junior and Main markets amounted to $108.76 million, well above the $46.99 million on the previous trading day and the JSE USD market closed with an exchange of a mere 20,041 shares for US$2,072 compared to 238,919 units at US$7,681 on Thursday.
In Main Market activity, Transjamaican Highway led trading with 16.87 million shares followed by Wigton Windfarm with 7.92 million stock units and JMMB Group 7.35% – 2028 with 832,520 units.
In Junior Market trading, Fosrich led trading with 1.15 million shares followed by Dolla Financial with 763,547 units and Spur Tree Spices with 534,396 shares.
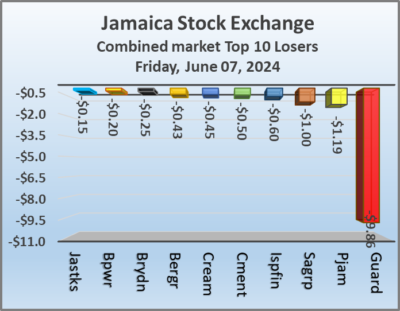 In the preference segment, Sygnus Credit Investments C10.5% increased $5 and ended at $115.
The market’s PE ratio, the most popular measure used to determine the value of stocks, ended at 21.3 on 2023-24 earnings and 13.5. times those for 2024-25 at the close of trading. ICInsider.com PE ratio chart and the more detailed daily charts provide investors with regularly updated information to help decision-making.
The PE ratio chart covers all ordinary shares on the Jamaica Stock Exchange, grouped by industry, allowing for easy comparisons within a sector and the overall market. The EPS & PE ratios are based on 2023 and 2024 actual or projected earnings, excluding major one off items.
Pertinent information is required to navigate numerous investment options successfully in the stock market. The ICInsider.com PE ratio chart and the more detailed daily report charts provide investors with regularly updated information to help decision-making.
The chart should be used in making rational decisions when investing in stocks close to the average for the sector, not going too far from it unless there are compelling reasons to do so. This approach helps to remove emotions from investment decisions and place them on fundamentals while at the same time not being too far from the majority of investors. Investors who buy when the price of a stock is close to the average will find that they are not inclined to overpay for a stock.
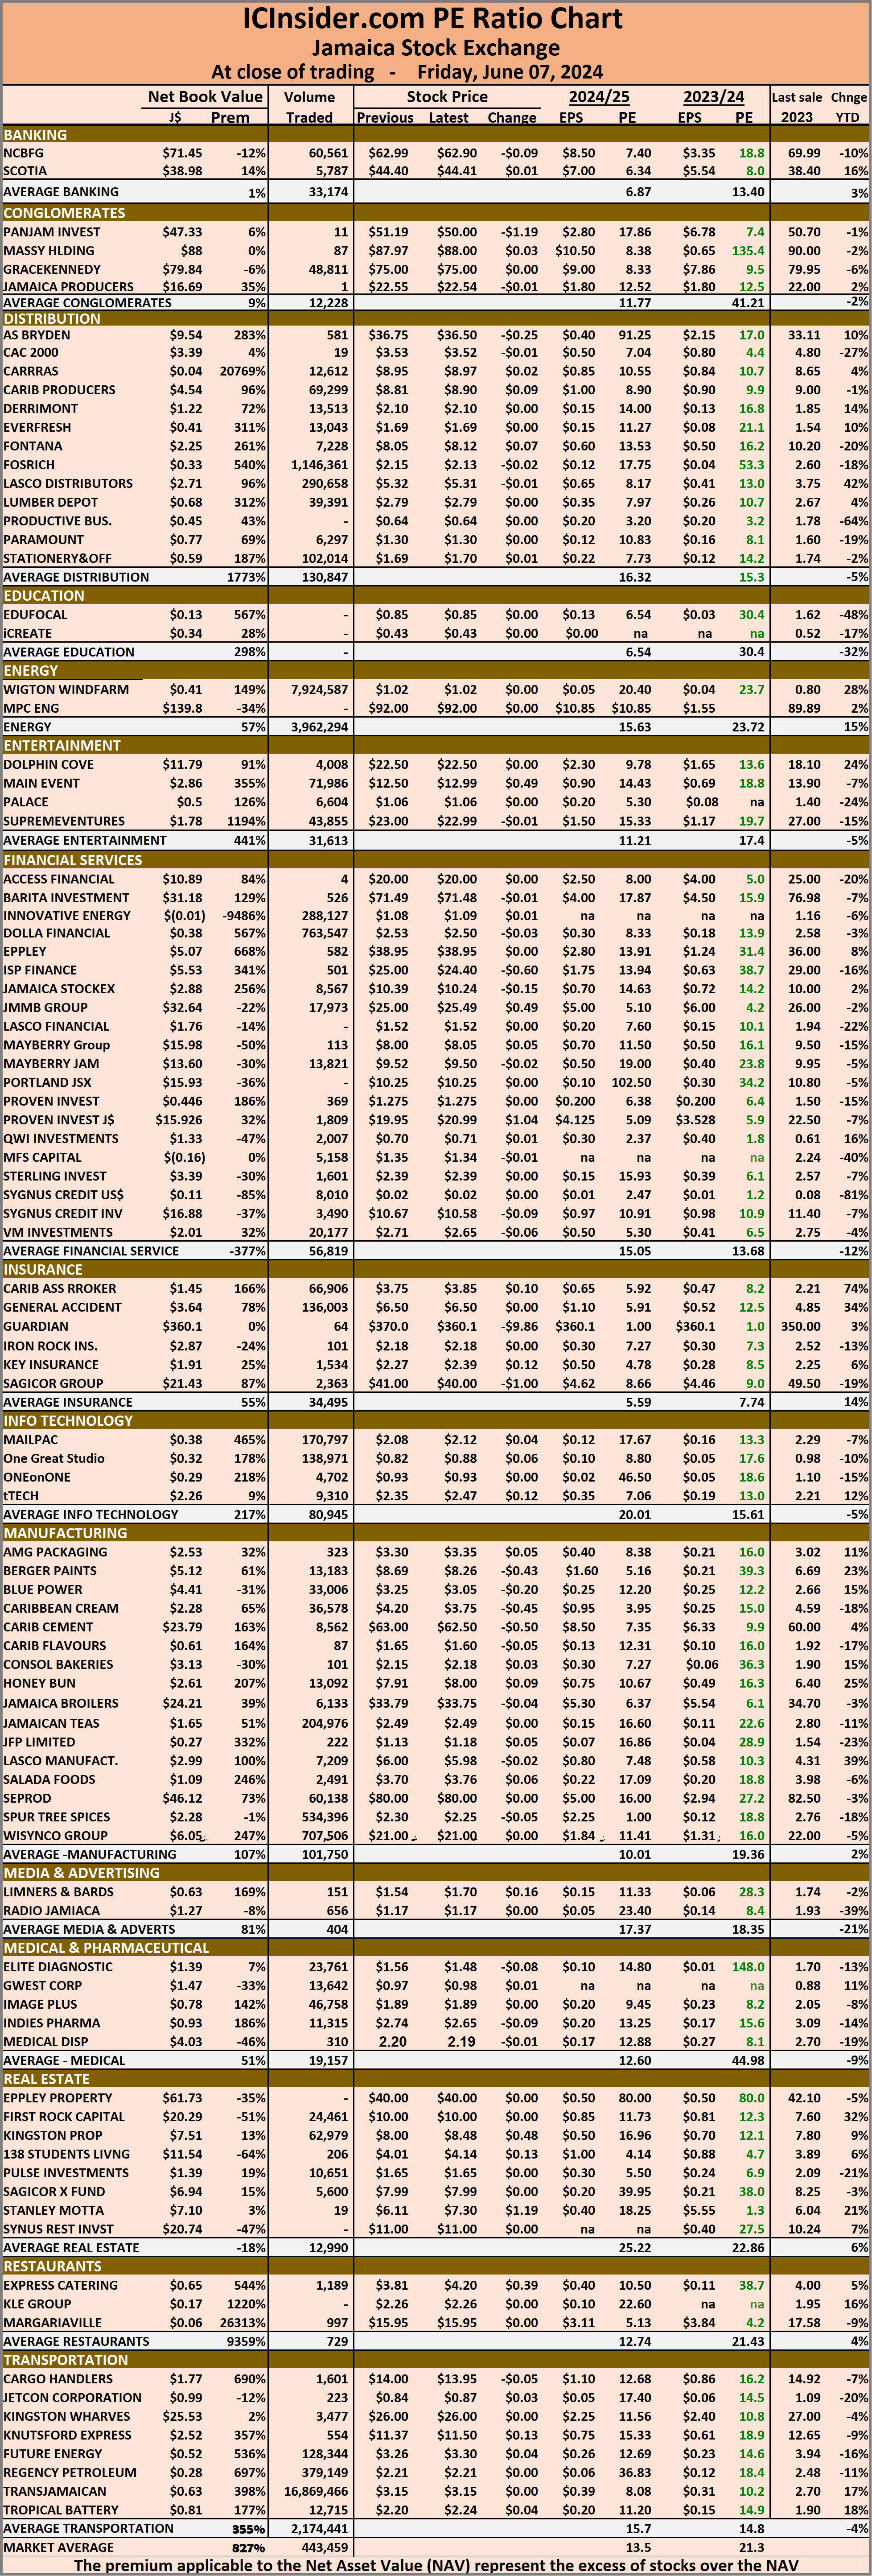 The net asset value of each company is reported as a guide for investors to quickly assess the value of stocks based on this measure. The chart also shows daily changes in stock prices and the percentage year to date price movement based on the last traded prices.
Dividends paid or payable and yields for each company are shown in the Main and Junior Markets’ daily report charts, along with the closing volume of the highest bid and the lowest offer for each company.