JSE Main Market falls, Junior Market rises


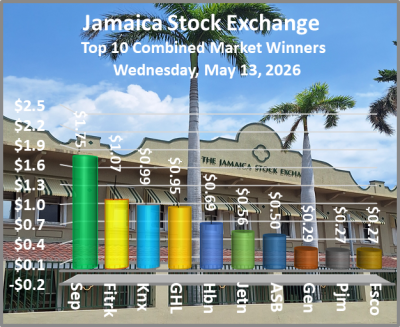
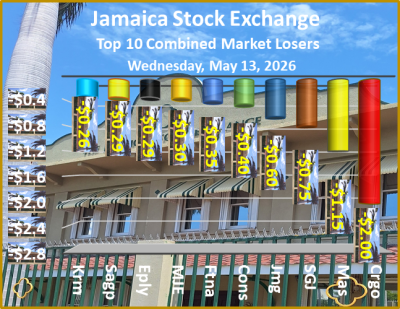
The Jamaica Stock Exchange closed on Wednesday, following a sharp fall in the volume and value of stocks traded, than on Tuesday, resulting in the major indices of the Main Market falling, the Junior Market index eking out a minor rally and the JSE USD Market Index ended with a narrow decline. At the end of trading the prices of 43 shares rose, 49 declined and 25 remained firm.

At the close of the market, the JSE Combined Market Index dropped by 3,562.08 points to 346,514.45, the All Jamaican Composite Index fell 4,752.39 points to 400,570.12, the JSE Main Index dived by 3,746.53 points to conclude trading at 339,191.54, the Junior Market Index rallied by a mere 2.68 points to 3,092.43 and the JSE USD Market Index fell by 1.38 points to end at 248.66.
Trading ended with 54,403,550 shares changing hands in all three markets, down from 123,423,084 units on Tuesday, with the value of stocks traded on the Junior and Main markets amounted to $123.57 million, down from $287.91 million on the previous day and the JSE USD market closed with an exchange of 459,211 shares for US$23,917 compared to 1,332,877 units at US$67,999 on Tuesday.
In Main Market activity, Wigton Energy led trading with 5.41 million shares followed by Transjamaican Highway with 4.61 million stocks and Supreme Ventures with 721,516 units.
In Junior Market trading, Kintyre Holdings led continued heavy trading, with 33.97 million shares followed by ONE on ONE Educational with 1.20 million stocks and Derrimon Trading with 794,499 units.
In the preference share segment, Productive Business Solutions 10.5% climbed $4.78 to end at $1,160.
At the close of trading, the market’s current year’s PE ratio, which is compiled with projected 2026-27 earnings is 12.5 and 15 based on 2025 historical earnings, excluding major one-time income or expenses. The PE ratio is one of the more popular measures used in valuing shares and is calculated by dividing the stock price by the company’s earnings per share. The ICInsider.com PE ratio chart and the detailed daily charts provide investors with regularly updated information to assist in decision-making. The PE ratio chart includes all ordinary shares listed on the Jamaica Stock Exchange, grouped by industry, with easy comparisons within sectors and the overall market.
Pertinent information is needed to navigate the numerous options in the stock market. The chart should be used to help in decision-making, especially when investing around the market or sector averages, and not going too far from it unless compelling reasons exist. This approach reduces emotion from investment decisions and places them on fundamentals, without straying far from the majority of investors. Investors who buy stocks near the average will not overpay. The net asset value of each company is incorporated into the chart. Investors can use this measure in assessing stock values. The chart also includes daily changes in stock prices and percentage year to date price movements based on the last traded price. Dividends that are paid or due to be paid and yields for each company are shown in the Main and Junior Markets’ daily report charts, along with the closing volume of the highest bid and the lowest offer for each company.

Trading jumps on Jamaica Stock Exchange 


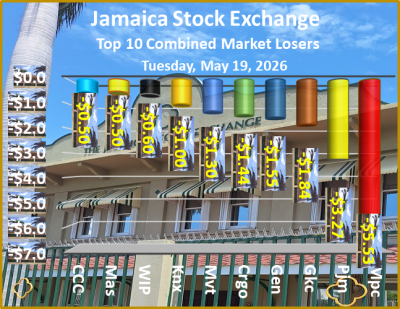
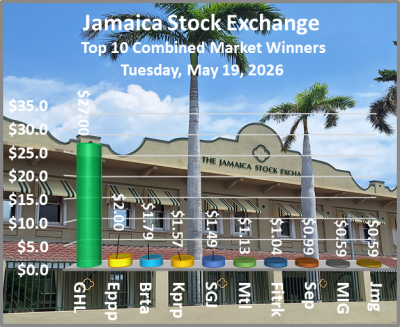
Trading closed Tuesday on the Jamaica Stock Exchange with a sharp rise in the volume and value of stocks exchanged, compared to Friday, resulting in Main Market major indices rising, the Junior Market index rising and the JSE USD Market falling. At the end of trading the prices of 33 shares rose, 62 declined and 22 remained firm.

At the close of the market, the JSE Combined Market Index declined by 2,125.22 points to 350,076.53, the All Jamaican Composite Index lost 2,217.57 points to end at 405,322.51, the JSE Main Index declined by 2,050.18 points to 342,938.07, the Junior Market Index shed 22.97 points to end at 3,089.75 and JSE USD Market Index dropped 11.96 points to 250.04.
At the close of market activity, with 123,423,084 shares being exchanged in all three markets, up sharply from only 30,519,205 units on Friday, with the value of stocks traded on the Junior and Main markets amounting to $287.91 million, up from $150.83 million on the previous trading day. The JSE USD market closed with an exchange of 1,332,877 shares for US$67,999 compared to 1,507,840 units at US$93,434 on Friday.
In Main Market activity, JMMB Group 7.35% – 2028 led with 33.34 million shares followed by Transjamaican Highway with 9.23 million stocks and Carreras with 1.91 million units.
In Junior Market trading, Kintyre Holdings led with 52.48 million shares followed by ONE on ONE Educational with 12.41 million stocks and Woodcats International with 2.47 million units.
In the preference segment, Jamaica Public Service 9.5% rose $201 and ended at $2,596, 138 Student Living preference share sank $8 to $212 and Productive Business Solutions 10.5% advanced $20 in closing at $1,155.
At the close of trading, the market’s current year’s PE ratio, which is compiled with projected 2026-27 earnings is 12.5 and 15 based on 2025 historical earnings, excluding major one-time income or expenses. The PE ratio is one of the more popular measures used in valuing shares and is calculated by dividing the stock price by the company’s earnings per share. The ICInsider.com PE ratio chart and the detailed daily charts provide investors with regularly updated information to assist in decision-making. The PE ratio chart includes all ordinary shares listed on the Jamaica Stock Exchange, grouped by industry, with easy comparisons within sectors and the overall market.
Pertinent information is needed to navigate the numerous options in the stock market. The chart should be used to help in decision-making, especially when investing around the market or sector averages, and not going too far from it unless compelling reasons exist. This approach reduces emotion from investment decisions and places them on fundamentals, without straying far from the majority of investors. Investors who buy stocks near the average will not overpay. The net asset value of each company is incorporated into the chart. Investors can use this measure in assessing stock values. The chart also includes daily changes in stock prices and percentage year to date price movements based on the last traded price. Dividends that are paid or due to be paid and yields for each company are shown in the Main and Junior Markets’ daily report charts, along with the closing volume of the highest bid and the lowest offer for each company.
Steady trading on Jamaica Stock Exchange


Trading was steady on Friday with a moderate fall in the volume and value of stocks changing hands on Thursday at the close of the Jamaica Stock Exchange, resulting in major indices of the Main Market falling, the Junior Market index and the JSE USD Market index climbing. At the end of trading the prices of 54 shares rose, 36 declined and 26 remained firm.

At the close of the market, the JSE Combined Market Index advanced 687.59 points to 352,201.75, the All Jamaican Composite Index rallied 1,540.69 points to 407,540.08, the JSE Main Index rose 198.55 points to finish at 344,988.25, the Junior Market Index jumped 69.11 points to settle at 3,112.72 and the JSE USD Market Index rose 6.06 points to 262.00.
At the close of trading, 30,519,205 shares were exchanged in all three markets, down from 31,567,367 units on Thursday, with the value of stocks traded on the Junior and Main markets amounting to $150.83 million, down slightly from $153.71 million on the previous day. The JSE USD market closed with an exchange of 1,507,840 shares for US$93,434, up from 916,015 units at US$44,643 on Thursday.
In Main Market activity, Transjamaican Highway led trading with 11.52 million shares followed by QWI Investments with 3.0 million stocks and Wigton Energy with 1.04 million units.
In Junior Market trading, Kintyre Holdings again led with 3.88 million shares followed by Future Energy with 1.13 million stocks and Dolla Financial with 907,970 units.
In the preference segment, Jamaica Public Service 7% gained $3.50 to close at $41, Jamaica Public Service 9.5% rose $6 and ended at $2,395 and Sygnus Credit Investments C10.5% skidded $1.03 in closing at $108.
At the conclusion of trading, the market’s current year’s PE ratio, which is compiled with projected 2026-27 earnings is 12.5 and 14.6 based on 2025 historical earnings, excluding major one-time income or expenses. The PE ratio is one of the more popular measures used in valuing shares and is calculated by dividing the stock price by the company’s earnings per share. The ICInsider.com PE ratio chart and the detailed daily charts provide investors with regularly updated information to assist in decision-making. The PE ratio chart includes all ordinary shares listed on the Jamaica Stock Exchange, grouped by industry, with easy comparisons within sectors and the overall market.
Pertinent information is needed to navigate the numerous options in the stock market. The chart should be used to help in decision-making, especially when investing around the market or sector averages, and not going too far from it unless compelling reasons exist. This approach reduces emotion from investment decisions and places them on fundamentals, without straying far from the majority of investors. Investors who buy stocks near the average will not overpay. The net asset value of each company is incorporated into the chart. Investors can use this measure in assessing stock values. The chart also includes daily changes in stock prices and percentage year to date price movements based on the last traded price. Dividends that are paid or due to be paid and yields for each company are shown in the Main and Junior Markets’ daily report charts, along with the closing volume of the highest bid and the lowest offer for each company.

Big fall for JSE Main market, Juniors rise


Trading pulled back on the Jamaica Stock Exchange on Thursday with a fall in the volume of stocks that were exchanged, but with a greater value than on Wednesday, and ended with the major indices Main Market falling, the Junior Market index rising modestly and the JSE USD Market slipping. At the end of trading the prices of 41 shares rose, 45 declined and 24 remained firm.

At the close of the market, the JSE Combined Market Index sank by 4,453.37 points to wrap up trading at 351,514.16, the All Jamaican Composite Index dived 5,473.74 points in finishing at 405,999.39, the JSE Main Index dropped by 4,705.24 points to finish trading at 344,789.70. The Junior Market Index climbed 6.17 points to close at 3,043.61, mean time the JSE USD Market Index declined 8.43 points to end at 255.94.
At the close of trading, a total of  31,567,367 shares were exchanged in all three markets, down from 43,404,559 units on Wednesday, with the value of stocks traded on the Junior and Main markets amounting to $153.71 million, up from $113.29 million on the previous day. The JSE USD market closed with an exchange of 916,015 shares for US$44,643, up from 690,528 units at US$34,802 on Wednesday.
In Main Market activity, Transjamaican Highway led trading with 4.86 million shares followed by Kingston Wharves with 1.20 million stocks and JMMB Group 7.35% – 2028 with an exchange of 1.05 million units.
In Junior Market trading, Kintyre Holdings led with 12.01 million shares, followed by Omni Industries with 3.20 million stocks and Woodcats International with 2.08 million units.
In the preference segment, Jamaica Public Service 7% sank $3.98 to finish at $37 and Sygnus Credit Investments C10.5% gained $8 to finish at $109.
At the close of trading, the market’s current year’s PE ratio, which is compiled using projected 2026-27 earnings is 13.5 and 14.3 based on 2025 historical earnings, excluding one-time income or expenses.
The PE ratio is one of the more popular measures used in valuing shares, is computed by dividing the stock price by earnings per share. The ICInsider.com PE ratio chart and the more detailed daily charts provide investors with regularly updated information to assist in decision-making. The PE ratio chart includes all ordinary shares listed on the Jamaica Stock Exchange, grouped by industry, with easy comparisons within sectors and the overall market.
Pertinent information is needed to navigate the numerous options in the stock market. The chart should be used to help in decision-making, especially when investing around the market or sector averages, and not going too far from it unless compelling reasons exist. This approach reduces emotion from investment decisions and places them on fundamentals, without straying far from the majority of investors. Investors who buy stocks near the average will not overpay. The net asset value of each company is incorporated into the chart. Investors can use this measure in assessing stock values. The chart also includes daily changes in stock prices and percentage year to date price movements based on the last traded price. Dividends that are paid or due to be paid and yields for each company are shown in the Main and Junior Markets’ daily report charts, along with the closing volume of the highest bid and the lowest offer for each company.

Steady trading on JSE Stock Exchange


Trading volumes slipped on Wednesday but finished marginally lower than with a greater value than Tuesday on the Jamaica Stock Exchange, resulting in the major indices of the Main Market rising, the Junior Market index suffering another sizeable fall and the JSE USD Market slipping mildly. At the end of trading the prices of 41 shares rose, 45 declined and 25 remained firm.

The market closed with, the JSE Combined Market Index rising by 67.42 points to 55,967.53, the All Jamaican Composite Index gained 624.83 points to settle at 411,473.13, the JSE Main Index rallied 301.76 points to finish at 349,494.94, the Junior Market Index declined by 30.68 points to 3,037.44 and the JSE USD Market Index shed 1.81 points to finish at 264.37.
The market ended following an exchange of 43,404,559 shares in all three markets, just below 43,609,389 units on Tuesday, with the value of stocks traded on the Junior and Main markets amounting to $113.29 million, up from $98.01 million on the previous day. The JSE USD market closed with an exchange of 690,528 shares for US$34,802 compared to 324,062 units at US$16,054 on Tuesday.
In Main Market activity, Transjamaican Highway led trading with 7.09 million shares, followed by QWI Investments with 3.45 million stocks and Wigton Energy with 1.89 million units.
In Junior Market trading, Kintyre Holdings led with 14.36 million shares, followed by Omni Industries with 4.11 million stocks and Atlantic Hardware with 3.23 million units.
In the preference share segment, Productive Business Solutions 10.5% rose $5 to close at $1,135.
At the close of trading, the market’s current year’s PE ratio, compiled with projected 2026-27 earnings is 12.8 and 14.6 based on 2025 historical earnings, with the exclusion of any major one-time income or expenses.
PE ratios are one of the more popular measures used by investors in valuing stocks, which is computed by dividing stock prices by earnings per share. The ICInsider.com PE ratio chart and the detailed daily charts provide investors with regularly updated information to assist in decision-making. The PE ratio chart includes all ordinary shares listed on the Jamaica Stock Exchange, grouped by industry, with easy comparisons within sectors and the overall market.
Pertinent information is needed to navigate the numerous options in the stock market. The chart should be used to help in decision-making, especially when investing around the market or sector averages, and not going too far from it unless compelling reasons exist. This approach reduces emotion from investment decisions and places them on fundamentals, without straying far from the majority of investors. Investors who buy stocks near the average will not overpay. The net asset value of each company is incorporated into the chart. Investors can use this measure in assessing stock values. The chart also includes daily changes in stock prices and percentage year to date price movements based on the last traded price. Dividends that are paid or due to be paid and yields for each company are shown in the Main and Junior Markets’ daily report charts, along with the closing volume of the highest bid and the lowest offer for each company.

Kintyre – biggest trader on JSE market


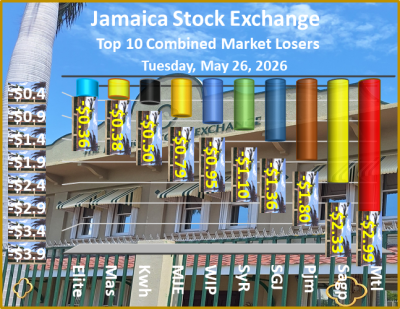
Trading closed Tuesday on the Jamaica Stock Exchange resulting in the major indices of the Main Market rising, the Junior and the JSE USD markets falling. At the end of trading the prices of 33 shares rose, 56 declined and 25 remained firm following with a rise in the volume of stocks traded, with a slightly lower value than on Monday.

The close of the market, the JSE Combined Market Index climbed 1,317.08 points to 355,900.11, the All Jamaican Composite Index rallied 1,083.01 points to finish at 410,848.30, the JSE Main Index popped by 1,691.13 points to end at 349,193.18, the Junior Market Index sank 41.58 points to close trading at 3,068.12 and the JSE USD Market Index shed 6.75 points to finish at 266.18.
At the close of trading, 43,609,389 shares were exchanged in all three markets, up from 26,567,559 units on Monday, with the value of stocks traded on the Junior and Main markets amounting to $98.01 million, down from $102.38 million on the previous day. The JSE USD market closed with an exchange of 324,062 shares for US$16,054, down from 442,856 units at US$23,193 on Monday.
In Main Market activity, Lasco Distributors took on the leader role after trading of 5.96 million shares, followed by Transjamaican Highway with 3.34 million stocks and Wigton Energy with 985,231 units.
In Junior Market trading, Kintyre Holdings led with 18.90 million shares followed by Woodcats International with 3.89 million stocks and Omni Industries with 2.06 million units.
In the preference share segment, 138 Student Living preference share gained $8 to close at $220, Sygnus Credit Investments 10% rose $4.50 to $109 and Sygnus Credit Investments C10.5% sank $8 to finish at $101.
The market’s PE ratio ended the day at 12.8 computed with the use of projected 2026-27 earnings and 14.6, compiled with 2025 historical earnings, excluding major one-time income or expenses.
The PE ratio is one of the more popular measures used in valuing shares and is calculated by dividing the stock price by the earnings per share. The ICInsider.com PE ratio chart and the detailed daily charts provide investors with regularly updated information to assist in decision-making. The PE ratio chart includes all ordinary shares listed on the Jamaica Stock Exchange, grouped by industry, with easy comparisons within sectors and the overall market.
Pertinent information is needed to navigate the numerous options in the stock market. The chart should be used to help in decision-making, especially when investing around the market or sector averages, and not going too far from it unless compelling reasons exist. This approach reduces emotion from investment decisions and places them on fundamentals, without straying far from the majority of investors. Investors who buy stocks near the average will not overpay. The net asset value of each company is incorporated into the chart. Investors can use this measure in assessing stock values. The chart also includes daily changes in stock prices and percentage year to date price movements based on the last traded price. Dividends that are paid or due to be paid and yields for each company are shown in the Main and Junior Markets’ daily report charts, along with the closing volume of the highest bid and the lowest offer for each company.
Transjam & Genac hit yearly highs


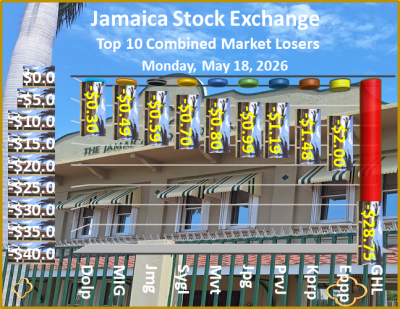
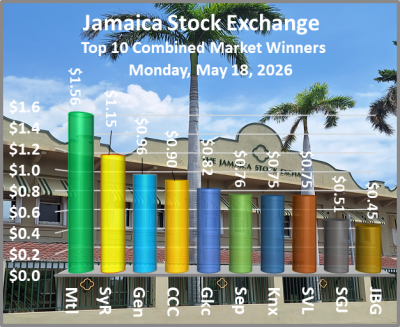
The Jamaica Stock Exchange closed on Monday with Transjamaican Highway and insurance company, General Accident hitting yearly highs at the close of trading on the JSE Main market, with both companies reporting big gains in the first quarter results, but investors punished Caribbean Producers with a 34.5 percent drop following the release of first quarter results showing a US dollar million loss.

Elsewhere in the market, trading ended on the Jamaica Stock Exchange with a sharp fall in the volume of stocks changing hands, with a moderately lower value than on Friday, resulting in the major indices of the Main Market falling, while the Junior Market index inched higher and the JSE USD Market slipped. At the end of trading the prices of 39 shares rose, 48 declined and 22 remained firm.
At the close of the market, the JSE Combined Market Index declined 2,036.24 points to 354,583.03, the All Jamaican Composite Index sank 1,444.32 points to wrap up trading at 409,765.29, the JSE Main Index fell 2,160.53 points to finish at 347,502.05, the Junior Market Index gained 4.03 points to end at 3,109.70 and the JSE USD Market Index dropped 2.34 points to finish at 272.93.
At the close of trading, 26,567,559 shares were exchanged in all three markets, down from 121,491,748 units on Friday, with the value of stocks traded on the Junior and Main markets amounted to $102.38 million, down from $123.11 million on the previous day and the JSE USD market closed with an exchange of 442,856 shares for US$23,193 compared to 433,362 units at US$20,839 on Friday.
At the end of Main Market activity, Transjamaican Highway led trading with 3.22 million shares, followed by Sagicor Select Financial Fund with 1.75 million stock units and Wigton Energy with 1.18 million shares.
In Junior Market trading, Woodcats International led with 5.05 million shares, Kintyre Holdings followed with 3.50 million stock units and MFS Capital Partners with an exchange of 1.37 million shares.
In the preferred share segment, Jamaica Public Service 9.5% skidded $11 and ended at $2,389, 138 Student Living preference share sank $8 to $212 and Sygnus Credit Investments 10% declined $5 in closing at $104.
At the close of trading, the market’s PE ratio ended at 13.1. The PE is computed using projected 2026-27 earnings and 14.7 based on 2025 historical earnings, excluding major one-time income or expenses. The PE ratio is one of the more popular measures used iin valuing shares and is calculated by dividing the stock price by the company’s earnings per share. The ICInsider.com PE ratio chart and the detailed daily charts provide investors with regularly updated information to assist in decision-making. The PE ratio chart includes all ordinary shares listed on the Jamaica Stock Exchange, grouped by industry, with easy comparisons within sectors and the overall market.
Pertinent information is needed to navigate the numerous options in the stock market. The chart should be used to help in decision-making, especially when investing around the market or sector averages, and not going too far from it unless compelling reasons exist. This approach reduces emotion from investment decisions and places them on fundamentals, without straying far from the majority of investors. Investors who buy stocks near the average will not overpay. The net asset value of each company is incorporated into the chart. Investors can use this measure in assessing stock values. The chart also includes daily changes in stock prices and percentage year to date price movements based on the last traded price. Dividends that are paid or due to be paid and yields for each company are shown

Kintyre Holdings top trade in all JSE markets


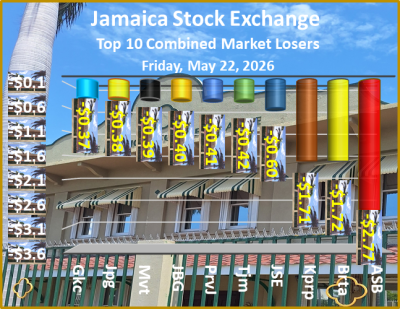
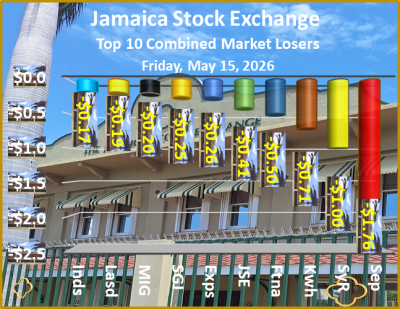
Trading closed Friday on the Jamaica Stock Exchange with a rise in the volume of stocks that changed, hands with a lower value than on Thursday, resulting in the major indices of the Main Market, the Junior Market index and the JSE USD Market all rising. At the end of trading the prices of 44 shares rose, 34 declined and 25 remained firm.

At the close of the market, the JSE Combined Market Index climbed 896.51 points to 356,619.27, the All Jamaican Composite Index advanced 195.23 points to end at 411,209.61, the JSE Main Index rose 692.11 points to 349,662.58, the Junior Market Index gained 32.61 points to 3,105.67 and the JSE USD Market Index rose 2.47 points to finish at 275.27.
At the close of the market on Friday, a total of 121,491,748 shares that included 105.44 million shares of Kintyre Holdings were exchanged in all three markets, up from 51,641,126 units on Thursday, with the value of stocks traded on the Junior and Main markets amounting to $123.11 million, down from $262.74 million on the previous day. The JSE USD market closed with an exchange of 433,362 shares for US$20,839 compared to 895,151 units at US$41,146 on Thursday.
In Main Market activity, Transjamaican Highway led trading with 4.66 million shares followed by Sagicor Select Financial Fund with 2.0 million stocks and General Accident with 1.34 million units, following release of their first quarter results showing a 50 percent increase in earnings per share of 22 cents versus 14 cents in 2025.
In Junior Market trading, Kintyre Holdings led with 105.44 million shares followed by Woodcats International with 691,726 stocks and Express Catering with 620,506 units.
In the preference segment, Sygnus Credit Investments C10.5% rose $6 to close at $109.
At the close of trading for the week, the market’s PE ended at 13.7. The PE is computed using projected 2026-27 earnings and 14.5 based on 2025 historical earnings, excluding major one-time income or expenses. The PE ratio is one of the more popular measures used in valuing shares and is calculated by dividing the stock price by the earnings per share. The ICInsider.com PE ratio chart and the detailed daily charts provide investors with regularly updated information to assist in decision-making. The PE ratio chart includes all ordinary shares listed on the Jamaica Stock Exchange, grouped by industry, with easy comparisons within sectors and the overall market.
Pertinent information is needed to navigate the numerous options in the stock market. The chart should be used to help in decision-making, especially when investing around the market or sector averages, and not going too far from it unless compelling reasons exist. This approach reduces emotion from investment decisions and places them on fundamentals, without straying far from the majority of investors. Investors who buy stocks near the average will not overpay. The net asset value of each company is incorporated into the chart. Investors can use this measure in assessing stock values. The chart also includes daily changes in stock prices and percentage year to date price movements based on the last traded price. Dividends that are paid or due to be paid and yields for each company are shown in the Main and Junior Markets’ daily report charts, along with the closing volume of the highest bid and the lowest offer for each company.
Derrimon is the leading traded JSE stock


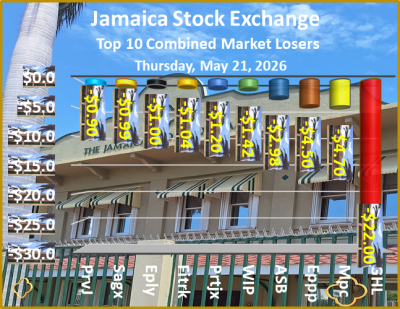
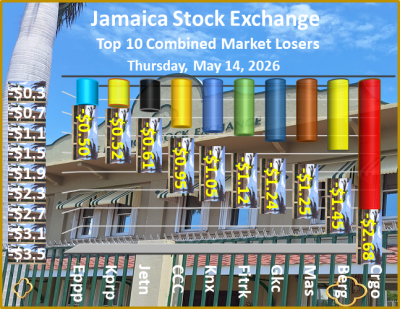
The Junior Market listed Derrimon Trading was the had the largest trading volume at the close of the Jamaica Stock Exchange on Thursday, resulting in a rise in the volume of stocks changing hands, with a lower value than on Wednesday. At the close of the market, the major indices of the Main Market rose, the Junior Market index dropped to a new multi-year low and the JSE USD Market slipped. At the end of trading prices of 35 shares rose, 45 declined and 28 remained firm.

At the close of the market, the JSE Combined Market Index rallied by 671.50 points to 355,722.76, while All Jamaican Composite Index popped 938.16 points to close at 411,014.38, the JSE Main Index rose 994.80 points to 348,970.47, the Junior Market Index dipped 38.79 points to settle at 3,073.06 and the JSE USD Market Index lost 1.61 points to 272.80.
At the close of trading, 51,641,126 shares were exchanged in all three markets, up from 29,457,762 units on Wednesday, with the value of stocks traded on the Junior and Main markets amounting to $262.74 million, down from $470.4 million on the previous day. The JSE USD market closed with an exchange of 895,151 shares for US$41,146, up from 355,844 units at US$18,142 on Wednesday.
In Main Market activity, Transjamaican Highway led trading with 4.52 million shares followed by Wigton Energy with 2.38 million stocks and Sagicor Select Manufacturing & Distribution Fund with 2.35 million units.
In Junior Market trading, Derrimon Trading led with 19.31 million shares followed by Regency Petroleum with 6.63 million stocks and Atlantic Hardware with 1.95 million units.
In the preference segment, Productive Business Solutions 10.5% fell $5 to $1,130 and Sygnus Credit Investments 10% popped $2.50 to $109.
At the close of trading, the market’s PE ratio ended at 13.5. The PE is computed using projected 2026-27 earnings and 14.6 based on 2025 historical earnings, excluding major one-time income or expenses. The PE ratio is one of the most popular tools used in valuing shares and is calculated by dividing the stock price by the company’s earnings per share. The ICInsider.com PE ratio chart and the detailed daily charts provide investors with regularly updated information to assist in decision-making. The PE ratio chart includes all ordinary shares listed on the Jamaica Stock Exchange, grouped by industry, with easy comparisons within sectors and the overall market.
Pertinent information is needed to navigate the numerous options in the stock market. The chart should be used to help in decision-making, especially when investing around the market or sector averages, and not going too far from it unless compelling reasons exist. This approach reduces emotion from investment decisions and places them on fundamentals, without straying far from the majority of investors. Investors who buy stocks near the average will not overpay. The net asset value of each company is incorporated into the chart. Investors can use this measure in assessing stock values. The chart also includes daily changes in stock prices and percentage year to date price movements based on the last traded price. Dividends that are paid or due to be paid and yields for each company are shown in the Main and Junior Markets’ daily report charts, along with the closing volume of the highest bid and the lowest offer for each company.

JSE markets falter, Juniors at 5 year low


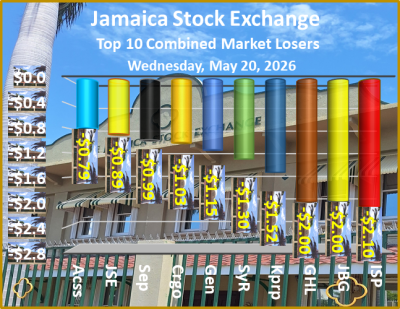
Jamaica Stock Exchange trading activity jumped sharply on Wednesday, compared to Tuesday with the volume more than twice that on Tuesday and value surging 455 percent, resulting in the major indices of the Main Market slipping, the Junior Market index declining and the JSE USD Market rising. At the end of trading the prices of only 35 shares rose, 46 declined and 24 remained firm.

At the close of the market, the JSE Combined Market Index lost 202.13 points to close trading at 355,051.26, the All Jamaican Composite Index slipped 138.75 points to end at 410,076.22, the JSE Main Index dipped 33.99 points to end at 347,975.67, the Junior Market Index shed 23.55 points to finish at 3,111.85, the lowest in more than five years and the JSE USD Market Index popped 2.21 points to settle at 274.41.
At the close of the market, 29,457,762 shares were exchanged in all three markets, up from 13,612,841 units on Tuesday, with the value of stocks traded on the Junior and Main markets amounted to $470.4 million, up from $84.79 million on the previous day and the JSE USD market closed with an exchange of 355,844 shares for US$18,142 compared to 118,617 units at US$8,845 on Tuesday.
In Main Market activity, GraceKennedy led with 5.27 million shares followed by JMMB 9.5% with 3.71 million stocks and Transjamaican Highway with 3.58 million units.
In Junior Market trading, Kintyre Holdings led with 4.94 million shares followed by Omni Industries with 1.15 million stocks and Derrimon Trading with 730,895 units.
In the preference segment, Sygnus Credit Investments C10.5% rallied $3 and ended at $104.
At the close of trading, the market’s PE ratio ended at 14.5. The PE is computed using projected 2026-27 earnings and 14.7 based on 2025 historical earnings, excluding major one-time income or expenses. The PE ratio is one of the more popular measures used for valuing shares and is calculated by dividing the stock price by the company’s earnings per share. The ICInsider.com PE ratio chart and the detailed daily charts provide investors with regularly updated information to assist in decision-making. The PE ratio chart includes all ordinary shares listed on the Jamaica Stock Exchange, grouped by industry, with easy comparisons within sectors and the overall market.
Pertinent information is needed to navigate the numerous options in the stock market. The chart should be used to help in decision-making, especially when investing around the market or sector averages, and not going too far from it unless compelling reasons exist. This approach reduces emotion from investment decisions and places them on fundamentals, without straying far from the majority of investors. Investors who buy stocks near the average will not overpay. The net asset value of each company is incorporated into the chart. Investors can use this measure in assessing stock values. The chart also includes daily changes in stock prices and percentage year to date price movements based on the last traded price. Dividends that are paid or due to be paid and yields for each company are shown in the Main and Junior Markets’ daily report charts, along with the closing volume of the highest bid and the lowest offer for each company.