Stocks traded mixed on Friday after the funds entering the market jumped sharply over Thursday’s level with trading resulting in a rise of the JSE Main Market but lower than the previous week’s close, while the Junior Market and the JSE USD Market fell, with the Junior market ending higher than the previous week while the JSE USD market closed lower than the prior week.
 Trading ended, with an exchange of 11,034,785 shares versus 12,548,350 units on Thursday, with the value falling to $166.7 million from $55.7 million on the previous trading day. The JSE USD market ended with the value of stocks traded falling to US$6,623 from US$99,750 on Thursday.
At the close, the Combined Market Index popped 1,746.27 points to 358,542.64, the All Jamaican Composite Index jumped 3,343.14 points to 392,986.76, the JSE Main Index rose 2,244.00 points to 345,497.10, the Junior Market dropped 37.78 points to end at 3,948.47 and the JSE US dollar market lost 1.47 points to close at 227.32.
The market’s PE ratio ended at 22.4 based on 2021-22 earnings and 13.4 times those for 2022-23 at the close of trading.
Investors need pertinent information to successfully navigate many investment options in the local stock market. 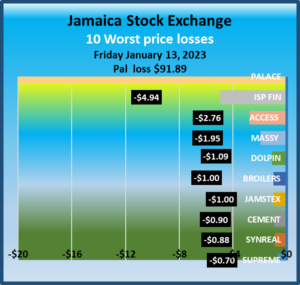 The ICInsider.com PE ratio chart and the more detailed daily report charts provide investors with regularly updated information to help decision-making.
Investors should use the chart to help make rational investment decisions by investing in stocks close to the average for the sector and not going too far from it unless there are compelling reasons to do so. This approach helps to remove emotions from investment decisions and put in on fundamentals while at the same time not being too far from the majority of investors. Investors who buy when the price of a stock is close to the average will find that they are not inclined to overpay for a stock.
The ICInsider.com PE Ratio chart covers all ordinary shares on the Jamaica Stock Exchange. It shows companies grouped on an industry basis, allowing easy comparisons between the same sector companies and the overall market.
The net asset value of each company is reported as a guide to assess the value of stocks based on this measure quickly. The chart also shows daily changes in stock prices and the percentage year to date price movement based on the last traded prices. 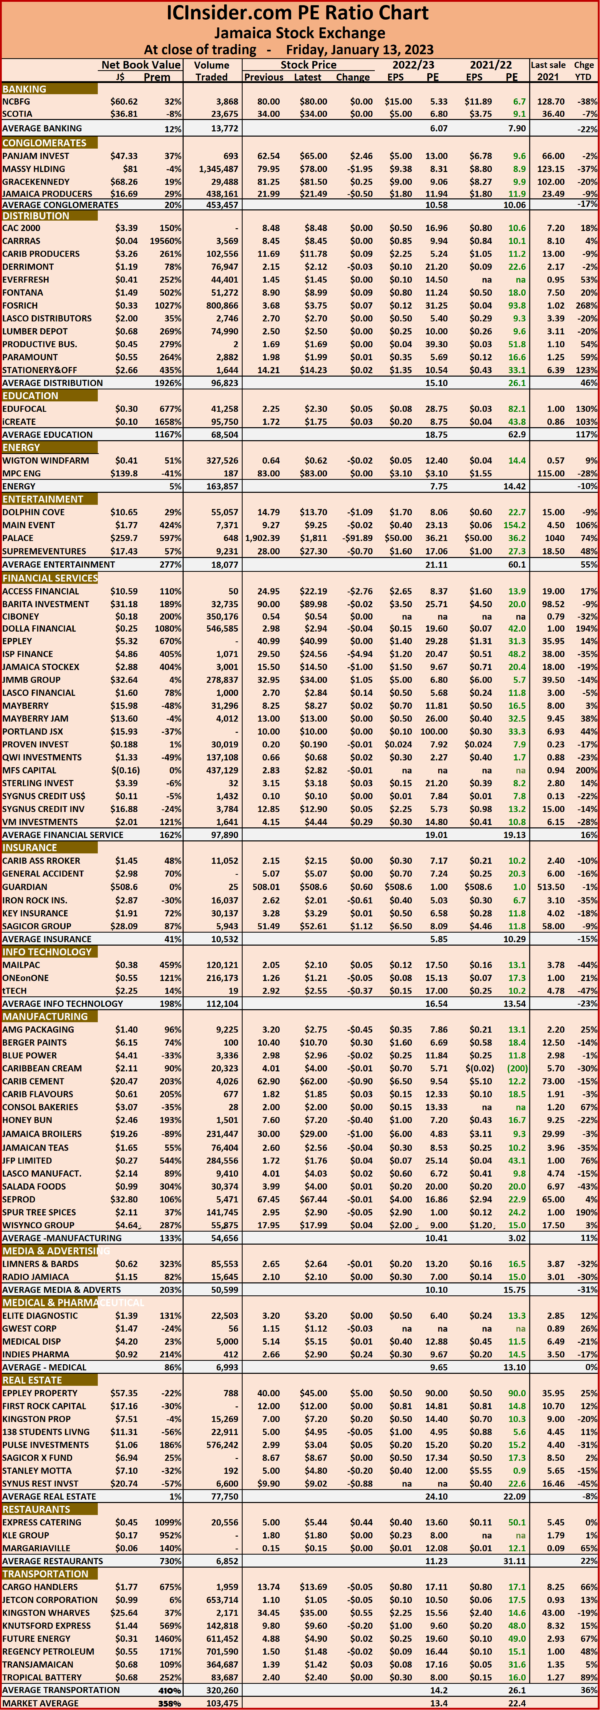 Dividends payable and yields for each company are shown in the Main and Junior Markets’ daily report charts that show the closing volume for the bids and offers.
The EPS & PE ratios are based on 2021 and 2022 actual or projected earnings, excluding major one off items. The PE Ratio is the most popular measure used to determine the value of stocks.
JSE majors rise Juniors fall on Friday
Main Market gains on low volume
Rising stocks impacted the Jamaica Stock Exchange Main Market positively on Thursday, with the major market indices gaining even as the volume of stocks traded declined 17 percent from Wednesday’s level, and valued 63 percent less after trading in 58 securities, up from 54 on Wednesday, and ended with prices of 19 rising, 22 declining and 17 ending unchanged.
 A total of 8,211,791 shares were exchanged for $46,473,139, down from 9,841,967 units at $126,164,786 on Wednesday.
Trading averaged 141,583 units at $801,261 compared with 182,259 shares at $2,336,385 on Wednesday and month to date, an average of 150,524 units at $1,318,558 versus 151,804 units at $1,392,640 previously. December closed with an average of 604,110 units at $4,072,598.
Wigton Windfarm led trading with 2.14 million shares for 26.1 percent of total volume, followed by JMMB Group 7.35% – 2028 with 1.40 million units for 17.1 percent of the day’s trade, Transjamaican Highway with 1.14 million units for 13.9 percent of trading, Sagicor Select Financial Fund with 1.13 million units for 13.8 percent share of the day’s trade and Caribbean Producers with 1.02 million units for 12.4 percent market share.
 The All Jamaican Composite Index climbed 2,760.22 points to 389,643.62, the JSE Main Index rose 2,168.78 points to 343,253.10 and the JSE Financial Index popped 0.37 points to 82.24.
The PE Ratio, a formula to ascertain appropriate stock values, averages 14.1 for the Main Market. The JSE Main and USD Market PE ratios incorporate earnings forecasted by ICInsider.com for companies with the financial year ending between November and August 2023.
Investor’s Choice bid-offer indicator shows six stocks ending with bids higher than their last selling prices and one with a lower offer.
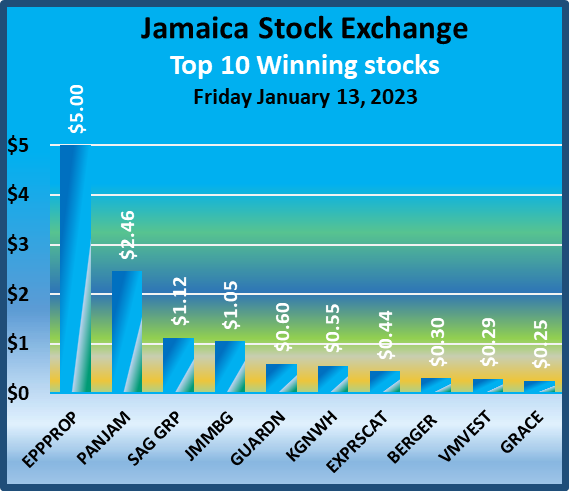
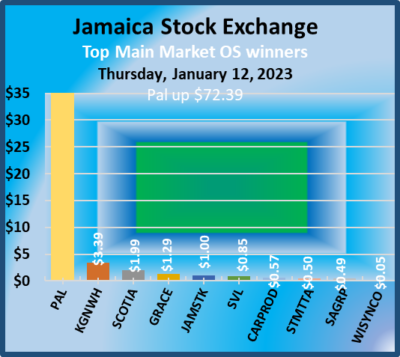
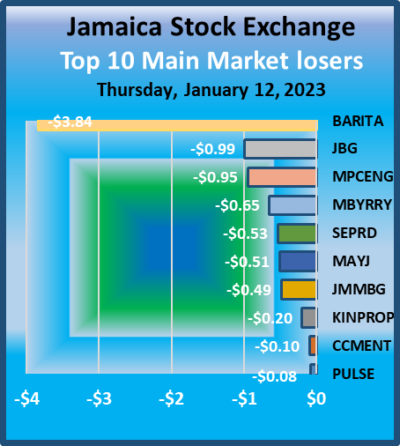
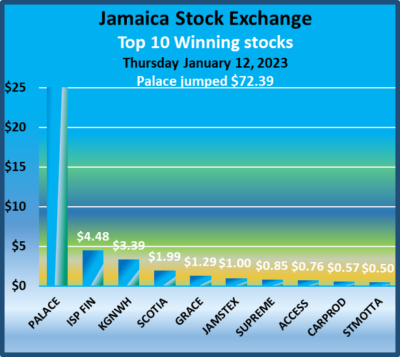
At the close, Barita Investments declined $3.84 to $90 with an exchange of 1,946 shares, Caribbean Producers gained 57 cents to end at $11.69 with 1,021,075 units crossing the market, GraceKennedy rose $1.29 to $81.25 in transferring 5,520 stocks. Jamaica Broilers shed 99 cents to end at $30 as investors exchanged 6,576 stock units, Jamaica Stock Exchange popped $1 to close at $15.50 in switching ownership of 11 units, JMMB Group lost 49 cents to finish at $32.95 after an exchange of 73,893 stock units. 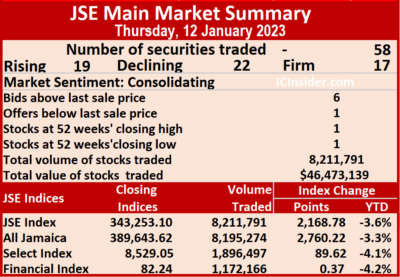 Kingston Wharves climbed $3.39 to $34.45 with a transfer of 432 shares, Margaritaville rallied $1.45 to $21 in the swapping of 404 stocks, Mayberry Investments fell 65 cents to $8.25 after 12,577 stocks cleared the market. Mayberry Jamaican Equities fell 51 cents to $13 with 4,704 stock units changing hands, MPC Caribbean Clean Energy shed 95 cents in closing at $83, trading 238 units, Palace Amusement climbed $72.39 to a 52 weeks’ high of $1,902.39 after a transfer of 305 shares. Sagicor Group gained 49 cents to end at $51.49, trading 5,138 stocks, Scotia Group rose $1.99 to $34 in an exchange of 343,004 shares, Seprod fell 53 cents to $67.45 after 3,703 stock units passed through the market. Stanley Motta rallied 50 cents to $5 with investors transferring 54,322 units and Supreme Ventures advanced 85 cents to $28 with 4,006 shares changing hands.
In the preference segment, Productive Business 10.50% preference share popped $12.01 in closing at $1,012.01 after switching ownership of 100 stock units,  Eppley 5% preference share fell $1.90 to end at $23 in an exchange of 5 stocks, JMMB Group 7% preference share shed 67 cents to close at $2.22 with the swapping of 5,891 units and 138 Student Living preference share advanced $4.95 to $69.95 after exchanging 37 stocks.
Prices of securities trading are those for the last transaction of each stock unless otherwise stated.
Jamaica Stock Exchange mostly gained Thursday
Stocks traded sharply higher at the commencement of trading on Thursday with the JSE Main Index rising 4,219.58 points to 345,303.90, the Junior Market jumping 88.70 points to 4,001.98 within 15 minutes of opening and the market kept most of the early gains to deliver a positive end to trading on Thursday and the JSE USD Market fell moderately to close out the day.
 Trading ended, with an exchange of 12,548,35 shares versus 21,678,787 units on Wednesday, with the value falling to $55.7 million from $155.5 million on the previous trading day. The JSE USD market ended with the value of stocks traded falling to US$99,750 from US$9,740 on Wednesday.
At the close, the Combined Market Index popped 2,693.16 points to 356,796.37, the All Jamaican Composite Index jumped 2,760.22 points to 389,643.62, the JSE Main Index rose 2,168.78 points to end at 343,253.10, the Junior Market surged 72.97 points to end at 3,986.25 and the JSE USdollar market rose 1.25 points to close at 228.79.
The market’s PE ratio ended at 22.3 based on 2021-22 earnings and 13.3 times those for 2022-23 at the close of trading.
Investors need pertinent information to successfully navigate many investment options in the local stock market. 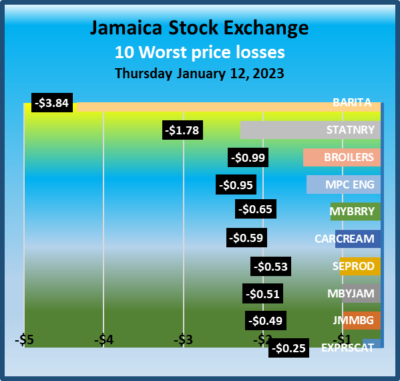 The ICInsider.comPE ratio chart and the more detailed daily report charts provide investors with regularly updated information to help decision-making.
Investors should use the chart to help make rational investment decisions by investing in stocks close to the average for the sector and not going too far from it unless there are compelling reasons to do so. This approach helps to remove emotions from investment decisions and put in on fundamentals while at the same time not being too far from the majority of investors. Investors who buy when the price of a stock is close to the average will find that they are not inclined to overpay for a stock.
The ICInsider.com PE Ratio chart covers all ordinary shares on the Jamaica Stock Exchange. It shows companies grouped on an industry basis, allowing easy comparisons between the same sector companies and the overall market.
The net asset value of each company is reported as a guide to assess the value of stocks based on this measure quickly. The chart also shows daily changes in stock prices and the percentage year to date price movement based on the last traded prices. 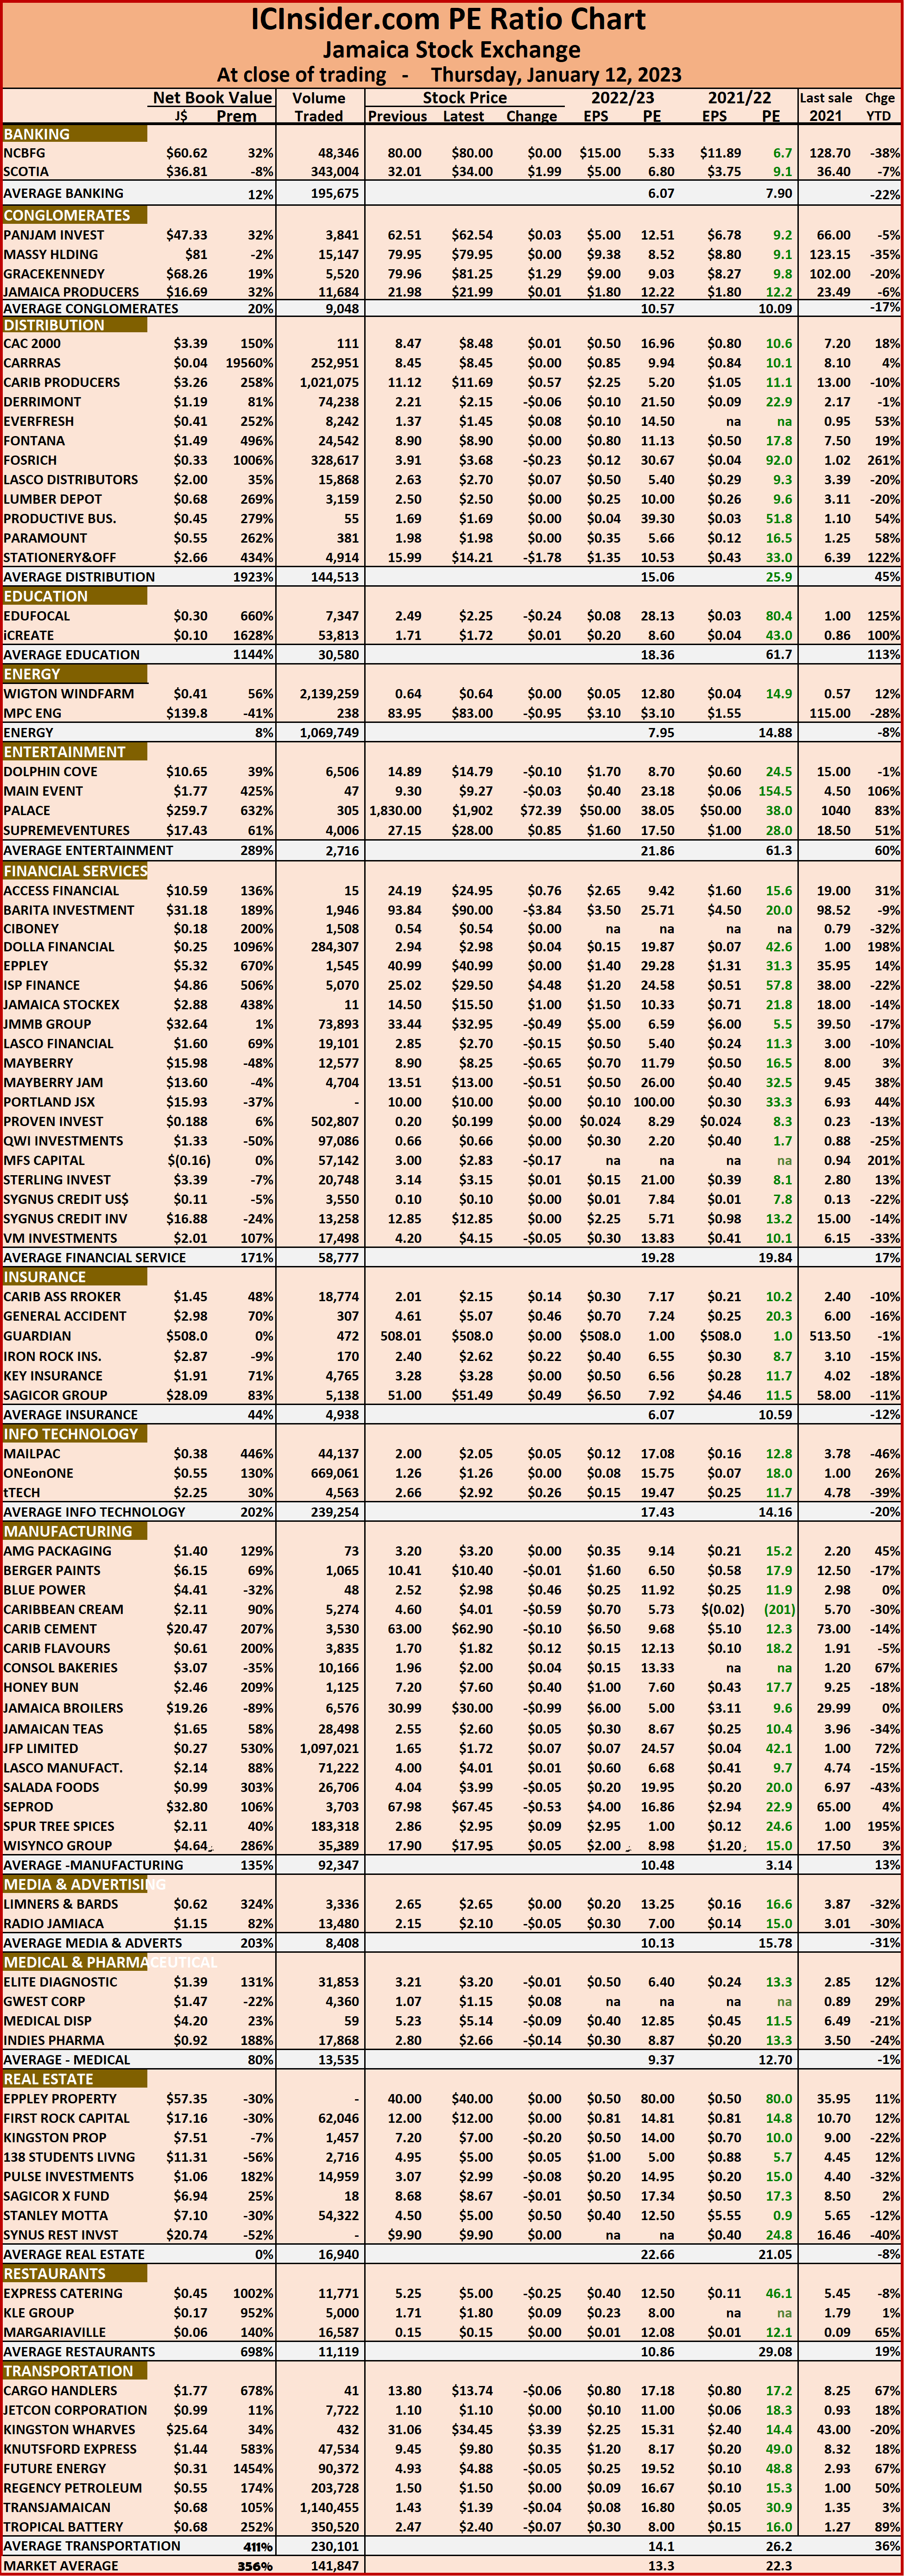 Dividends payable and yields for each company are shown in the Main and Junior Markets’ daily report charts that show the closing volume for the bids and offers.
The EPS & PE ratios are based on 2021 and 2022 actual or projected earnings, excluding major one off items. The PE Ratio is the most popular measure used to determine the value of stocks.
Trading picked up on the JSE Main Market
The volume of stocks traded on the Jamaica Stock Exchange Main Market on Wednesday rose 18 percent and the value jumped 259 percent higher than on Tuesday, from trading in 54 securities compared to 55 on Tuesday, with 17 rising, 24 declining and 13 ending unchanged.
 The All Jamaican Composite Index dropped 3,634.92 points to 386,883.40, the JSE Main Index declined 2,841.02 points to 341,084.32 and the JSE Financial Index shed 0.31 points to settle at 81.87.
A total of 9,841,967 shares were traded for $126,164,786 versus 8,360,004 units at $35,173,992 on Tuesday.
Trading averaged 182,259 shares at $2,336,385 versus 152,000 shares at $639,527 on Tuesday and month to date, an average of 151,804 units at $1,392,640 versus 147,119 units at $1,247,448 on the previous day. December closed with an average of 604,110 units at $4,072,598.
Jamaica Broilers led trading with 3.27 million shares for 33.2 percent of total volume, followed by Wigton Windfarm with 2.65 million units for 26.9 percent of the day’s trade and Transjamaican 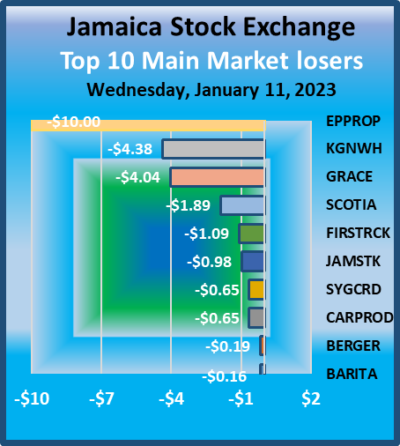 Highway with 1.92 million units for 19.5 percent market share.
The PE Ratio, a formula to ascertain appropriate stock values, averages 14.1 for the Main Market. The JSE Main and USD Market PE ratios incorporate earnings forecasted by ICInsider.com for companies with the financial year ending between November 2022 and August 2023.
Investor’s Choice bid-offer indicator shows seven stocks ending with bids higher than their last selling prices and five with lower offers.
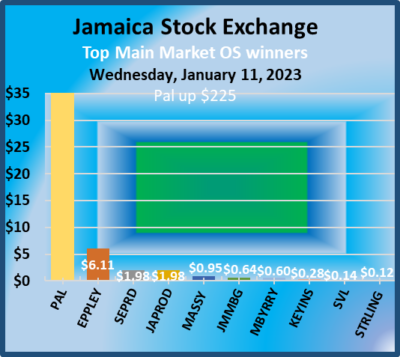
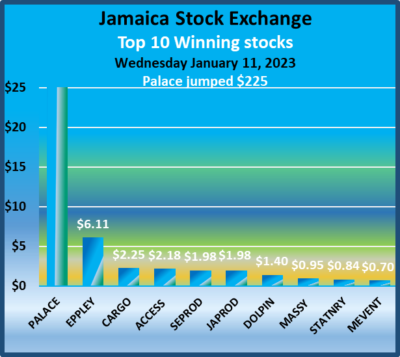
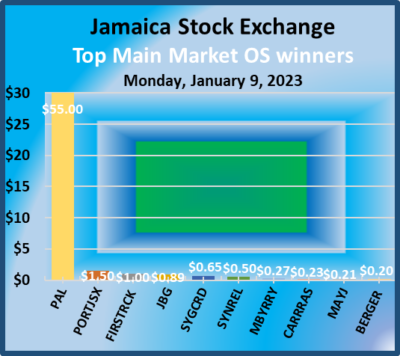
At the close, Caribbean Producers shed 65 cents in closing at $11 with a transfer of 80,830 shares, Eppley climbed $6.11 to $40.99 after 155 stocks passed through the market, Eppley Caribbean Property Fund declined $10 to $40, trading 4,063 stock units. First Rock Real Estate fell $1.09 to close at $12 with an exchange of 11,203 units, GraceKennedy dropped $4.04 to $79.96, with 14,408 stocks clearing the market, 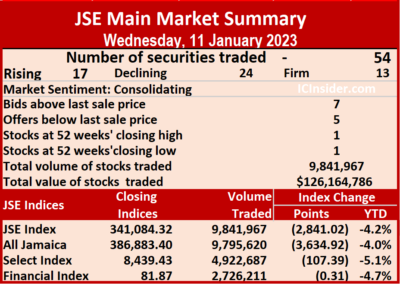 Jamaica Producers popped $1.98 to $21.98 as investors traded 12,321 stock units. Jamaica Stock Exchange shed 98 cents to end at $14.50 with investors transferring 23,485 units, JMMB Group rallied 64 cents to $33.44 with 40,018 shares changing hands, Kingston Wharves declined $4.38 to close at $31.06 in swapping 3,345 units. Margaritaville advanced $2.93 to $19.55 after a transfer of 28,413 shares, Massy Holdings rose 95 cents in closing at $79.95 with the swapping of 945 stock units, Mayberry Investments gained 60 cents to end at $8.90, trading 503 stocks. Palace Amusement jumped $225 to close at a 52 weeks’ high of $1,830 in transferring 805 units, Proven Investments shed $2.40 in ending at $30 with 8,029 stocks changing hands, Scotia Group dipped $1.89 to $32.01 in trading 113,116 shares.
  Seprod advanced $1.98 to $67.98 in switching ownership of 1,733 stock units and Sygnus Credit Investments lost 65 cents in closing at $12.85 after exchanging 53,468 shares.
In the preference segment, Eppley 7.25% preference share dropped $2 to close at $20 after trading 2,480 units and Eppley 7.75% preference share lost 79 cents to finish at a 52 weeks’ low of $19.21 after an exchange of 200 stock units.
Prices of securities trading are those for the last transaction of each stock unless otherwise stated.
Trading rises on Jamaica Stock Exchange as prices fall
The value of stocks trading picked up on the Jamaica Stock Exchange on Wednesday well over the sub-par levels on Monday and Tuesday. However, the Main Market and the Junior Market indices declined and the JSE USD Market enjoyed a bounce.
 Trading ended with an exchange of 21,678,787 shares compared with 16,753,008 units on Tuesday, with the value falling to $155.5 million from $57.5 million on the previous trading day. The JSE USD market ended with the value of stocks traded falling to US$9,740 from US$22,972 on Tuesday.
At the close, the Combined Market Index dived 3078.85 points to 354,103.21, the All Jamaican Composite Index dropped 3,634.92 points to 386,883.40, the JSE Main Index fell 2,841.02 points to 341,084.32, the Junior Market dived 46.69 points to end at 3,913.28 and the JSE US dollar market rose 4.02 points to close at 230.04.
The market’s PE ratio ended at 22.4 based on 2021-22 earnings and 13.3 times those for 2022-23 at the close of trading.
Investors need pertinent information to successfully navigate many investment options in the local stock market. 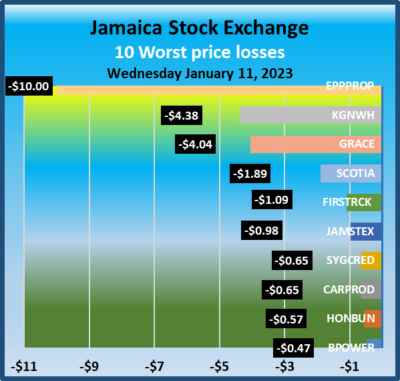 The ICInsider.com PE ratio chart and the more detailed daily report charts provide investors with regularly updated information to help decision-making.
Investors should use the chart to help make rational investment decisions by investing in stocks close to the average for the sector and not going too far from it unless there are compelling reasons to do so. This approach helps to remove emotions from investment decisions and put in on fundamentals while at the same time not being too far from the majority of investors. Investors who buy when the price of a stock is close to the average will find that they are not inclined to overpay for a stock.
The ICInsider.com PE Ratio chart covers all ordinary shares on the Jamaica Stock Exchange. It shows companies grouped on an industry basis, allowing easy comparisons between the same sector companies and the overall market.
The net asset value of each company is reported as a guide to assess the value of stocks based on this measure quickly. The chart also shows daily changes in stock prices and the percentage year to date price movement based on the last traded prices.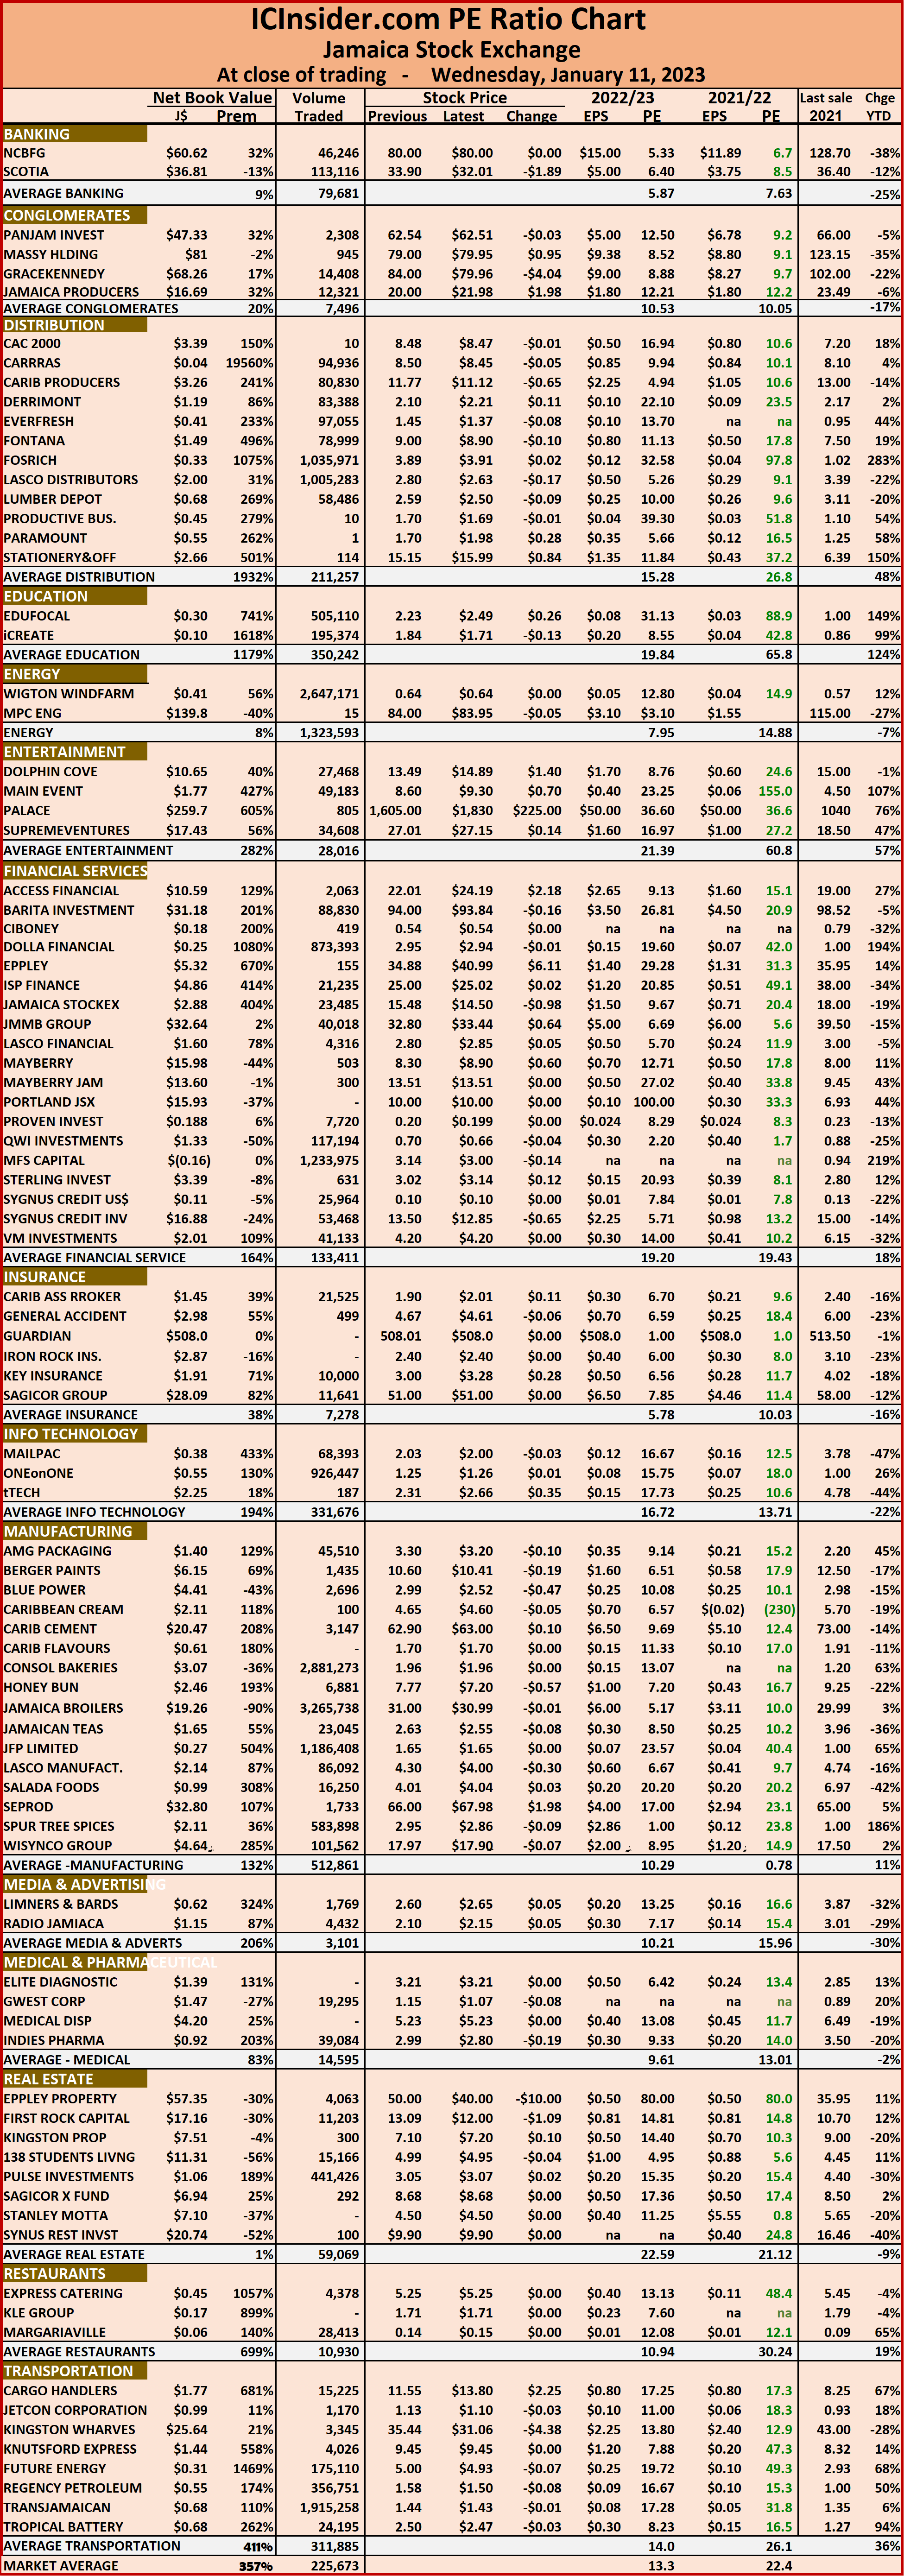 Dividends payable and yields for each company are shown in the Main and Junior Markets’ daily report charts that show the closing volume for the bids and offers.
The EPS & PE ratios are based on 2021 and 2022 actual or projected earnings, excluding major one off items. The PE Ratio is the most popular measure used to determine the value of stocks.
Trading dropped Tuesday on Main Market
Trading volume declined on Tuesday for a second consecutive day on the Jamaica Stock Exchange Main Market with the volume of stocks traded declining 20 percent and the value 36 percent lower than on Monday, as 55 securities were traded compared to 60 on Monday, with prices of 27 rising, 16 declining and 12 ending unchanged.
 A total of 8,360,004 shares were traded for a mere $35,173,992 compared with 10,386,916 units at $54,644,130 on Monday.
Trading averaged 152,000 units at $639,527 compared to 173,115 shares at $910,736 on Monday and month to date, an average of 147,119 stocks at $1,247,448 compared with 146,212 units at $1,360,406 on the previous day. December closed with an average of 604,110 units at $4,072,598.
Wigton Windfarm led trading with 3.29 million shares for 39.3 percent of total volume followed by Sagicor Select Financial Fund with 2.09 million units for 25 percent of the day’s trade and Transjamaican Highway with 1.36 million units for 16.2 percent of market share.
The All Jamaican Composite Index popped 397.74 points to 390,518.32, the JSE Main Index advanced 417.79 points to 343,925.34 and the JSE Financial Index dipped 0.30 points to close at 82.18.
 The PE Ratio, a formula to ascertain appropriate stock values, averages 14.3 for the Main Market. The JSE Main and USD Market PE ratios incorporate earnings forecasted by ICInsider.com for companies with the financial year ending between November and August 2023.
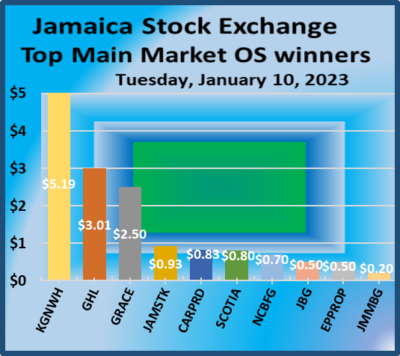
Investor’s Choice bid-offer indicator shows eight stocks ending with bids higher than their last selling prices and four with lower offers.
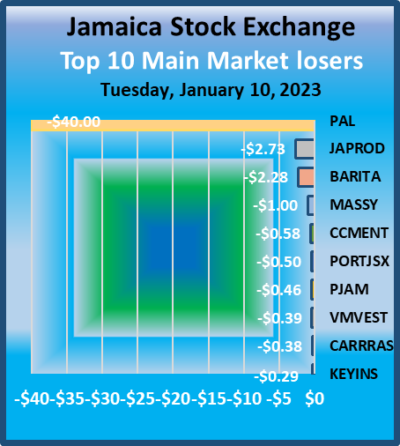
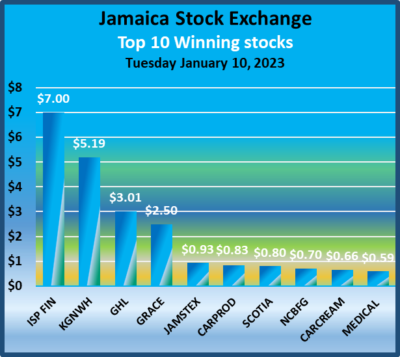
At the close, Barita Investments shed $2.28 in ending at $94 with 2,972 shares crossing the exchange, Caribbean Cement declined 58 cents to $62.90 with a transfer of 1,166 units, Caribbean Producers rose 83 cents to $11.77 after trading 42,013 stocks.Eppley Caribbean Property Fund rallied 50 cents to close at $50 with an exchange of two stock units, GraceKennedy advanced $2.50 to $84 as investors swapped 26,554 stock units, Guardian Holdings climbed $3.01 to $508.01 after an exchange of 50 stocks. Jamaica Broilers gained 50 cents to close at $31 with investors transferring 7,991 units, 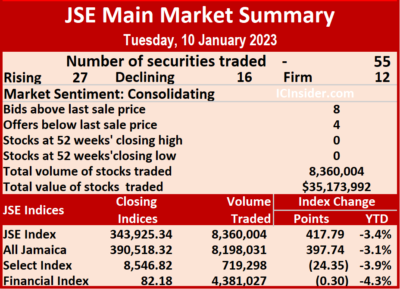 Jamaica Producers fell $2.73 to $20 with the swapping of 31,927 shares, Jamaica Stock Exchange advanced 93 cents to $15.48 in trading 1,400 shares. Kingston Wharves popped $5.19 to end at $35.44 with 1,801 units clearing the market, Massy Holdings dipped $1 to close at $79 after trading 120,708 stocks, NCB Financial rose 70 cents to $80 after 14,668 stock units cleared the market. Palace Amusement fell $40 to close at $1,605 in an exchange of 46 units, PanJam Investment shed 46 cents to end at $62.54 with a transfer of 19,265 stocks, Portland JSX lost 50 cents in closing at $10 after 1,003 stock units crossed the market. Proven Investments popped $2.40 to $32.40 in switching ownership of 17,118 shares and Scotia Group rose 80 cents to $33.90 in exchanging 107,362 stocks.
In the preference segment, Jamaica Public Service 9.5% advanced $1 in closing at $3,000 after investors transferred 44 shares. 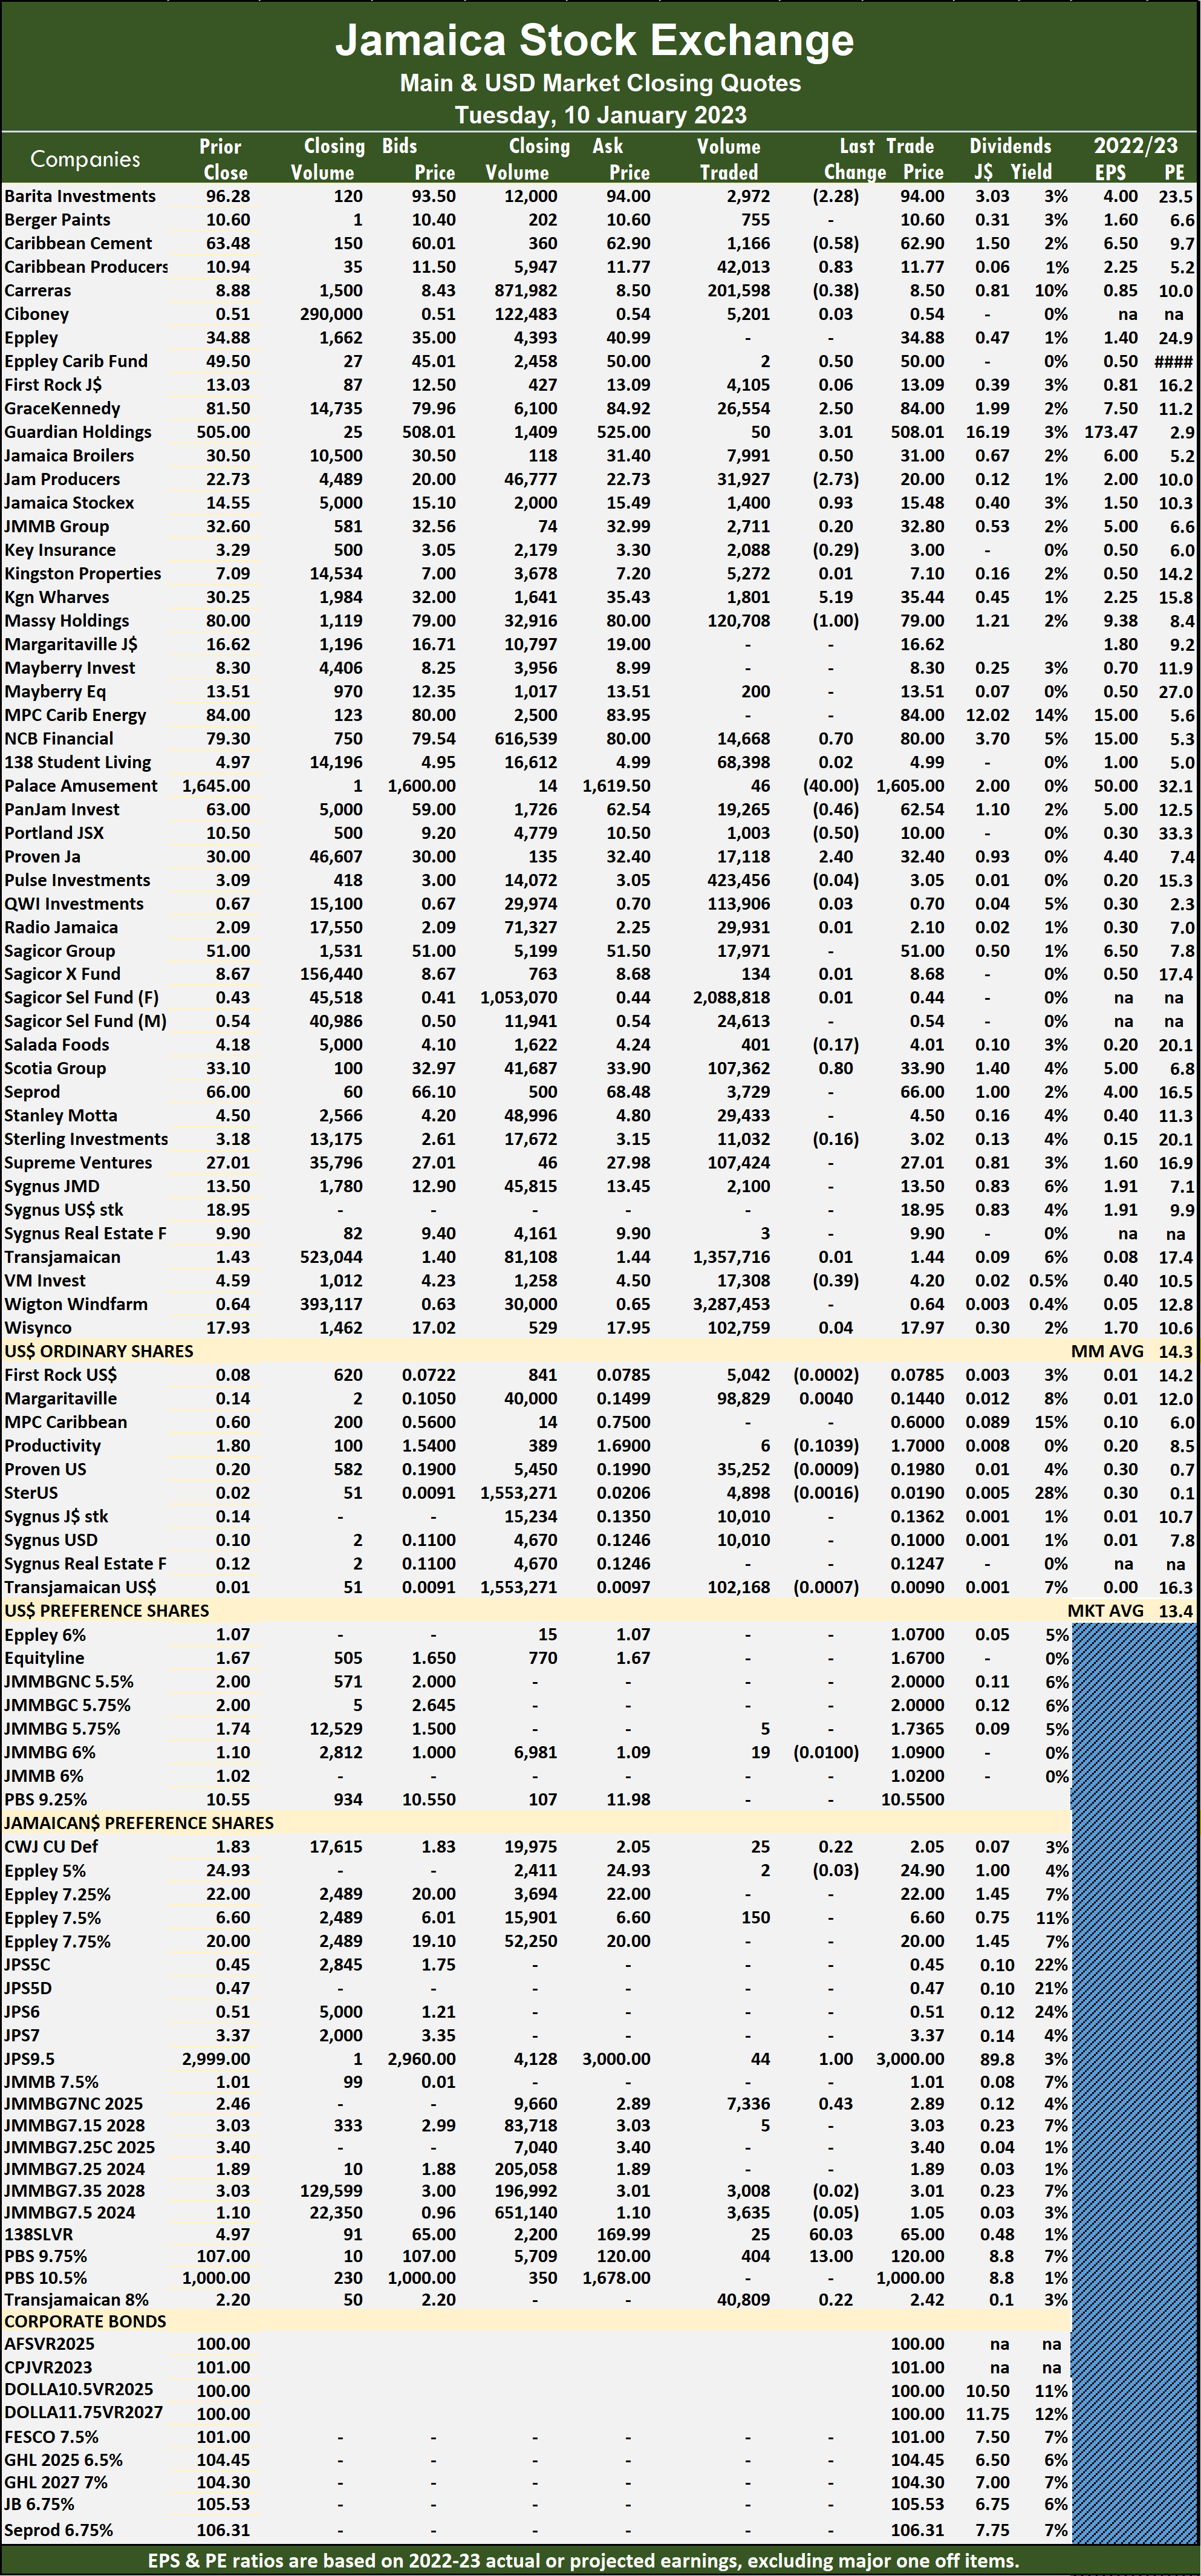 JMMB Group 7% preference share rallied 43 cents to $2.89 after an exchange of 7,336 stock units, 138 Student Living preference share advanced $6.35 to close at $65 as investors exchanged 25 units and Productive Business Solutions 9.75% preference share climbed $13 in closing at $120 in trading 404 stocks.
Prices of securities trading are those for the last transaction of each stock unless otherwise stated.
JSE Main Market trading falls
The value of stocks trading continues to be low on the Jamaica Stock Exchange, with value traded on Tuesday falling below Monday’s level, leading to a jump in the Junior Market index and modest increases for that of the Main Market and slippage for the JSE USD Market.
 Trading ended with an exchange of 16,753,008 shares versus 16,619,413 units on Monday, with the value falling to $57.5 million from $68 million on the previous trading day. The JSE USD market ended with the value of stocks traded amounting to US$22,972 down from US$74,761 on Monday.
At the close, the Combined Market Index popped 905.12 points to 357,182.06, the All Jamaican Composite Index rose 397.74 points to close at 390,518.32, the JSE Main Index gained 417.79 points to 343,923.34, the Junior Market jumped 56.12 points as it gave back some of the early trading gains to end at 3,959.97 and the JSE US dollar market fell 5.76 to 226.02.
The market’s PE ratio ended at 22 based on 2021-22 earnings and 13.3 times those for 2022-23 at the close of trading.
Investors need pertinent information to successfully navigate many investment options in the local stock market. 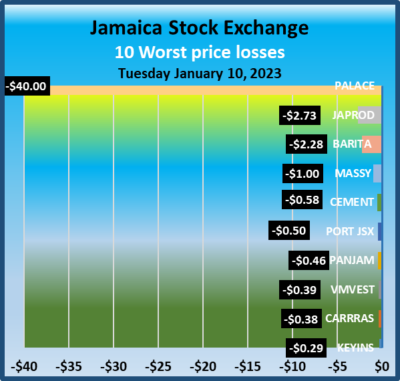 The ICInsider.com PE ratio chart and the more detailed daily report charts provide investors with regularly updated information to help decision-making.
Investors should use the chart to help make rational investment decisions by investing in stocks close to the average for the sector and not going too far from it unless there are compelling reasons to do so. This approach helps to remove emotions from investment decisions and put in on fundamentals while at the same time not being too far from the majority of investors. Investors who buy when the price of a stock is close to the average will find that they are not inclined to overpay for a stock.
The ICInsider.com PE Ratio chart covers all ordinary shares on the Jamaica Stock Exchange. It shows companies grouped on an industry basis, allowing easy comparisons between the same sector companies and the overall market.
The net asset value of each company is reported as a guide to assess the value of stocks based on this measure quickly. The chart also shows daily changes in stock prices and the percentage year to date price movement based on the last traded prices. 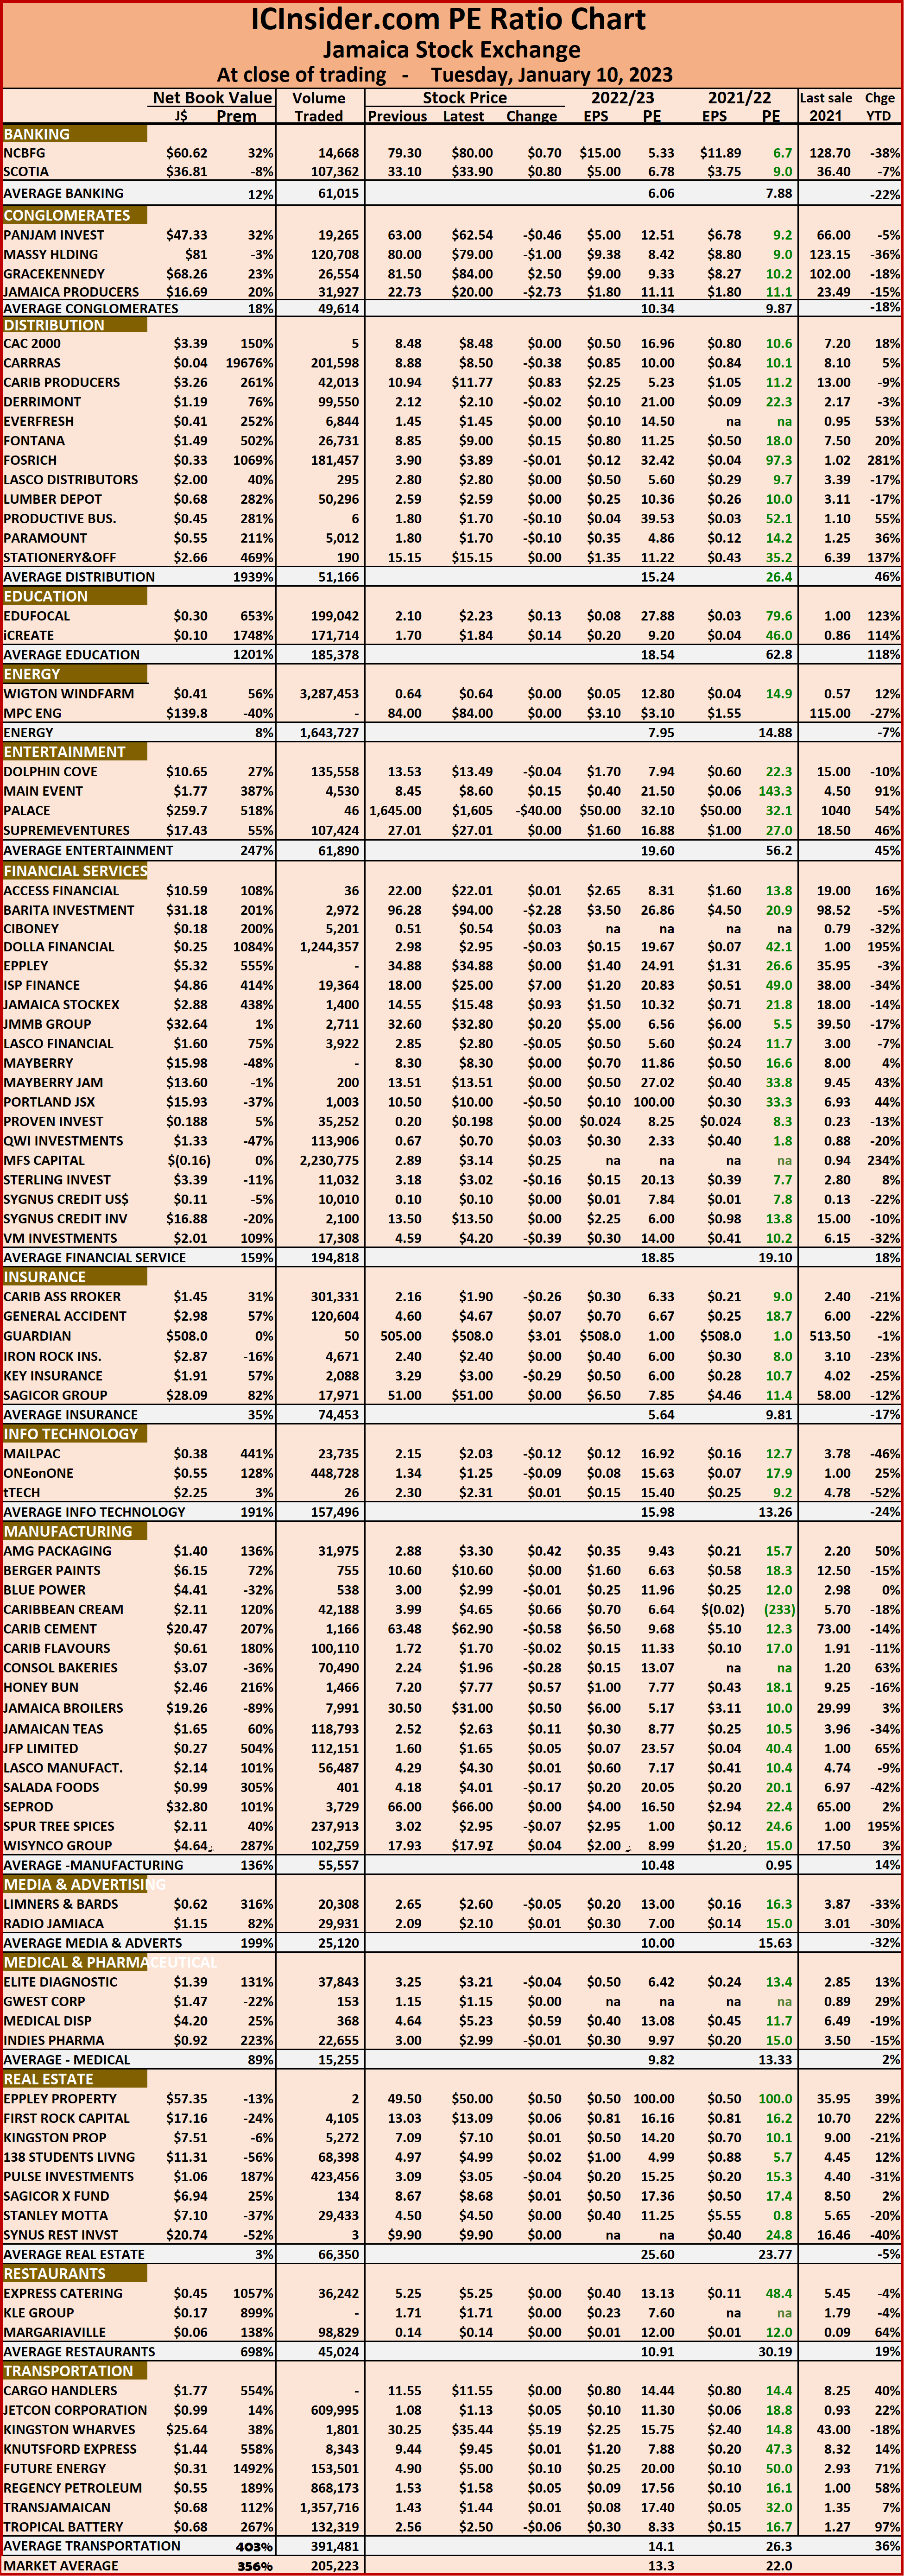 Dividends payable and yields for each company are shown in the Main and Junior Markets’ daily report charts that show the closing volume for the bids and offers.
The EPS & PE ratios are based on 2021 and 2022 actual or projected earnings, excluding major one off items. The PE Ratio is the most popular measure used to determine the value of stocks.
Plunge for JSE Main Market
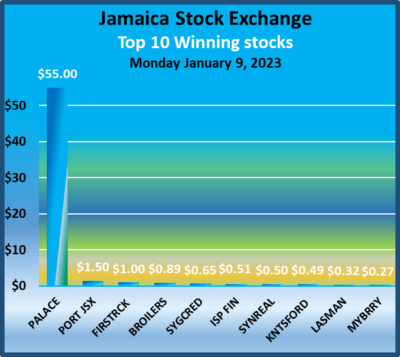
Stocks traded sharply down on the Jamaica Stock Exchange Main Market on Monday with a dip in the volume of stocks traded at 73 percent lesser value than on Friday, after trading in 60 securities down from 56 on Friday, ending with 21 rising, 27 declining and 12 unchanged.
 A total of 10,386,916 shares were traded for $54,644,130 versus 11,174,825 units at $201,235,785 on Friday.
Trading averaged 173,115 shares at $910,736 down from 199,550 shares at $3,593,496 on Friday and trading month to date averaged 146,212 units at $1,360,406 compared to 139,372 units at $1,474,729 on the previous day. December closed with an average of 604,110 units at $4,072,598.
Transjamaican Highway led trading with 4.73 million shares for 45.5 percent of total volume followed by Pulse Investments with 2.05 million units for 19.7 percent of the day’s trade and Sagicor Select Financial Fund with 960,501 units for 9.2 percent market share.
The All Jamaican Composite Index plunged 5,923.29 points to 390,120.58, the JSE 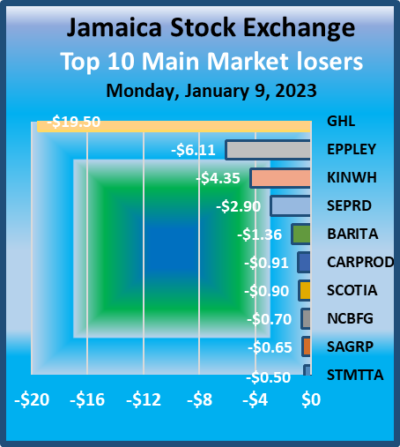 Main Index dropped 4,673.08 points to 343,507.55 and the JSE Financial Index declined 0.43 points to close at 82.48.
The PE Ratio, a formula to ascertain appropriate stock values, averages 14.4 for the Main Market. The JSE Main and USD Market PE ratios incorporate earnings forecasted by ICInsider.com for companies with the financial year ending between November and August 2023.
Investor’s Choice bid-offer indicator shows seven stocks ending with bids higher than their last selling prices and three with lower offers.
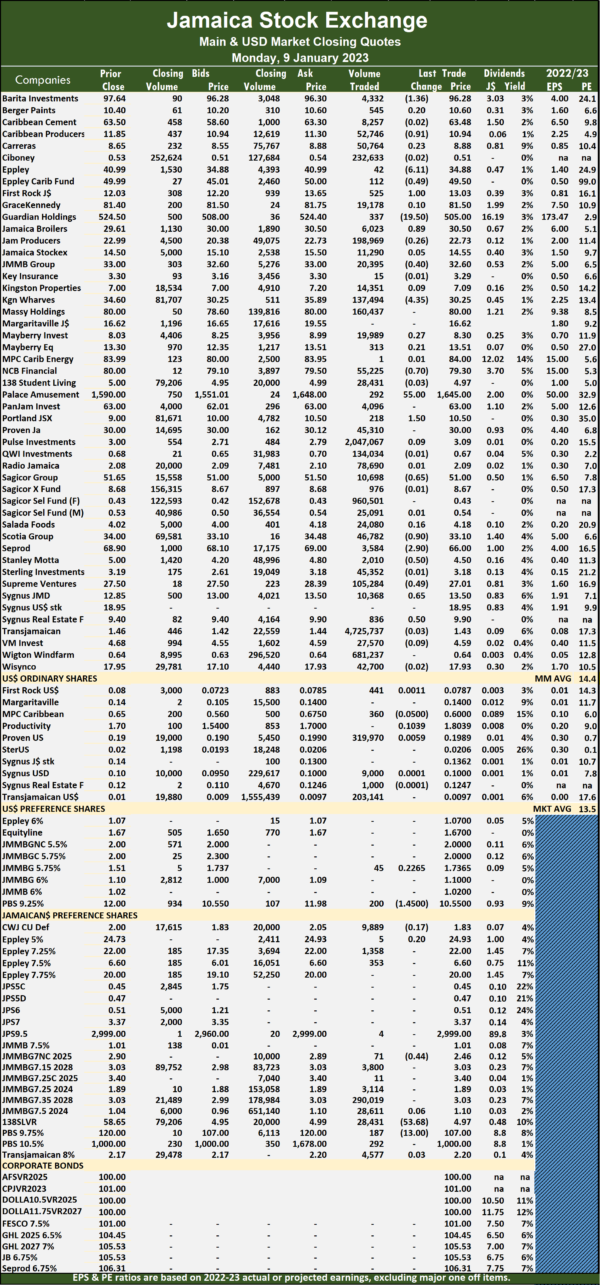
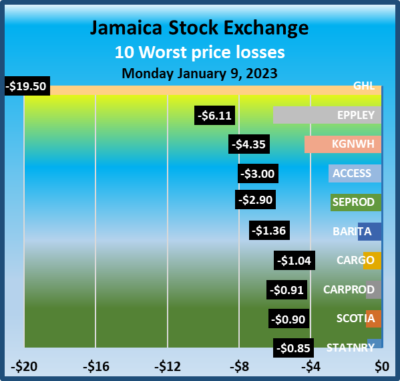
At the close, Barita Investments declined $1.36 to close at $96.28 after an exchange of 4,332 shares, Caribbean Producers shed 91 cents to end at $10.94 after trading 52,746 units, Eppley fell $6.11 to $34.88 after a transfer of 42 stock units. Eppley Caribbean Property Fund dipped 49 cents in closing at $49.50 with 112 stocks changing hands, First Rock Real Estate popped $1 to $13.03 in switching ownership of 525 stocks, 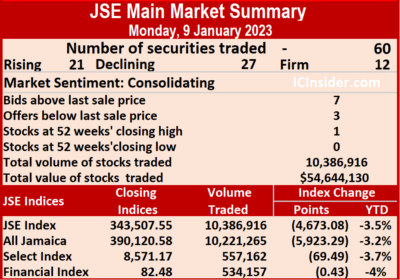 Guardian Holdings dropped $19.50 to $505 with investors transferring 337 units. Jamaica Broilers rose 89 cents to $30.50 with 6,023 shares clearing the market, JMMB Group fell 40 cents to $32.60 trading 20,395 stock units, Kingston Wharves fell $4.35 to end at $30.25 in switching ownership of 137,494 stocks.NCB Financial shed 70 cents in closing at $79.30 in exchanging 55,225 units, Palace Amusement climbed $55 to $1,645 with 292 shares passing through the market, Portland JSX advanced $1.50 to $10.50 after a transfer of 218 stock units. Sagicor Group declined 65 cents to $51 in exchanging 10,698 stock units, Scotia Group lost 90 cents to close at $33.10 as investors swapped 46,782 shares, Seprod shed $2.90 in ending at $66 with a transfer of 3,584 units. Stanley Motta fell 50 cents to finish at $4.50 in trading 2,010 stocks, Supreme Ventures lost 49 cents to close at $27.01 after transferring 105,284 shares, Sygnus Credit Investments advanced 65 cents to end at $13.50 with an exchange of 10,368 stock units and Sygnus Real Estate Finance gained 50 cents to close at $9.90 with the swapping of 836 units.
 In the preference segment, JMMB Group 7% preference share fell 44 cents to $2.46 in trading 71 stocks and Productive Business Solutions 9.75% preference share dropped $13 in closing at $107 with the swapping of 187 stocks.
Prices of securities trading are those for the last transaction of each stock unless otherwise stated.
JSE Main Market drops Juniors pop
Trading on the Jamaica Stock Exchange dropped on Monday, with the market indices dropping for the Main Market and just slipping for the JSE USD Market while the Junior Market just held up by a few points after the value of shares traded in the overall plunged sharply below $70 million.
 Trading ended, with an exchange of 16,619,413 shares versus 17,408,795 units on Friday, with the value falling sharply to $68 million from $217.47 million on the previous trading day. The JSE USD market ended with the value of stocks traded amounting to US$74,761 up from US$11,314 on Friday.
At the close, the Combined Market Index dropped 4,330.84 points to 356,276.94, the All Jamaican Composite Index fell 5,923.29 points to 390,120.58, the JSE Main Index shed 4,673.08 points to 343,507.55, the Junior Market held on to 3.07 points of the early trading gains to end at 3,903.85 and the JSE US dollar market closed at 231.78 after slipping 2.03 points.
The market’s PE ratio ended at 21.2 based on 2021-22 earnings and 13.2 times those for 2022-23 at the close of trading.
 Investors need pertinent information to successfully navigate many investment options in the local stock market. The ICInsider.com PE ratio chart and the more detailed daily report charts provide investors with regularly updated information to help decision-making.
Investors should use the chart to help make rational investment decisions by investing in stocks close to the average for the sector and not going too far from it unless there are compelling reasons to do so. This approach helps to remove emotions from investment decisions and put in on fundamentals while at the same time not being too far from the majority of investors. Investors who buy when the price of a stock is close to the average will find that they are not inclined to overpay for a stock.
The ICInsider.com PE Ratio chart covers all ordinary shares on the Jamaica Stock Exchange. It shows companies grouped on an industry basis, allowing easy comparisons between the same sector companies and the overall market.
The net asset value of each company is reported as a guide to assess the value of stocks based on this measure quickly. The chart also shows daily changes in stock prices and the percentage year to date price movement based on the last traded prices. 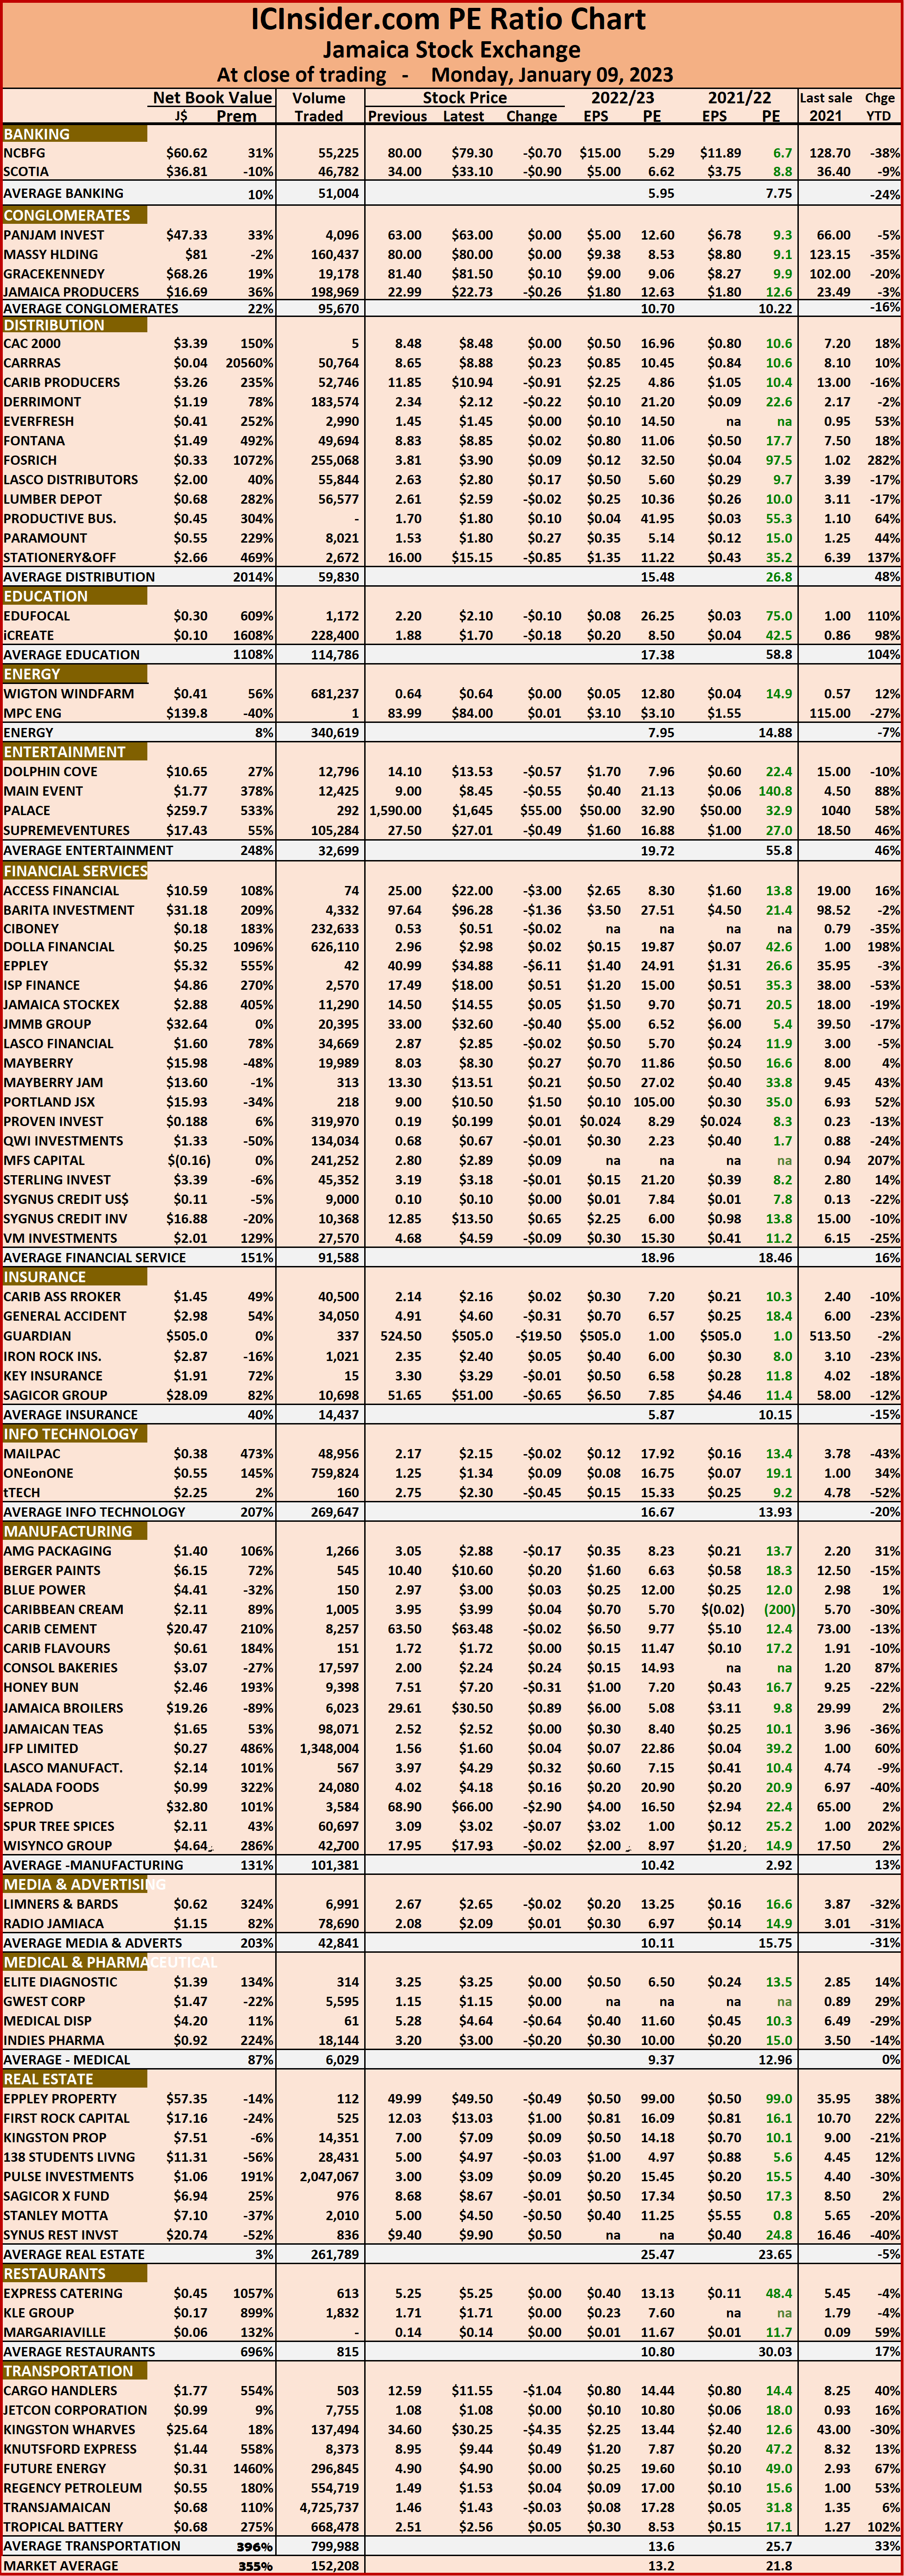 Dividends payable and yields for each company are shown in the Main and Junior Markets’ daily report charts that show the closing volume for the bids and offers.
The EPS & PE ratios are based on 2021 and 2022 actual or projected earnings, excluding major one off items. The PE Ratio is the most popular measure used to determine the value of stocks.
Gains for JSE Main Market
Trading picked up sharply on the Jamaica Stock Exchange Main Market on Friday, with an 84 percent increase in the volume of stocks traded with an 818 percent more value than Thursday, with 56 securities trading down from 60 on Thursday, with 18 rising, 22 declining and 16 ending unchanged.
 The All Jamaican Composite Index jumped 3,559.20 points to 396,043.87, the JSE Main Index climbed 2,768.71 points to 348,180.63 and the JSE Financial Index popped 0.93 points to settle at 82.91.
A total of 11,174,825 shares were traded for $201,235,785 compared to 6,062,724 units at $21,930,574 on Thursday.
Trading averaged 199,550 shares at $3,593,496, up from 101,045 stocks at $365,510 on Thursday and month to date, an average of 139,372 units at $1,474,729 compared to 120,650 units at $815,557 on the previous day. December closed with an average of 604,110 units at $4,072,598.
Transjamaican Highway led trading with 6.36 million shares for 57 percent of total volume, followed by PanJam Investment with 1.07 million units for 9.6 percent of the day’s trade, Massy Holdings with 1.05 million units for 9.4 percent market share and Wisynco Group with 1.04 million units for 9.3 percent market share.
 The PE Ratio, a formula to ascertain appropriate stock values, averages 14.4 for the Main Market. The JSE Main and USD Market PE ratios incorporate earnings forecasted by ICInsider.com for companies with the financial year ending between November and August 2023.
Investor’s Choice bid-offer indicator shows ten stocks ended with bids higher than their last selling prices and three with lower offers.
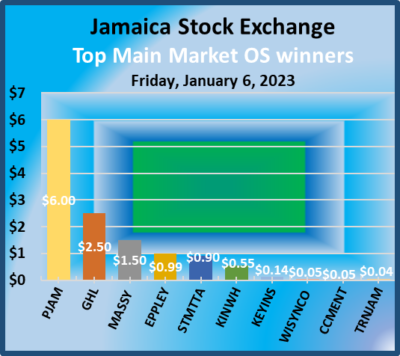
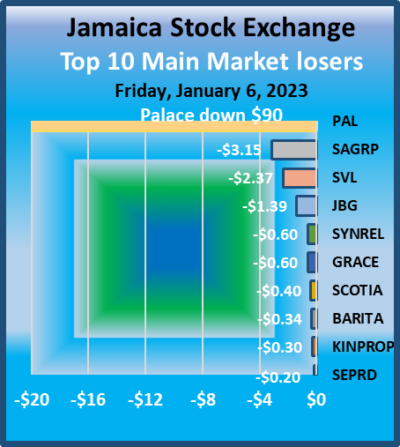
At the close, Eppley gained 99 cents to close at $40.99 with an exchange of 1,110 shares, GraceKennedy lost 60 cents in closing at $81.40 after an exchange of 15,302 stocks, Guardian Holdings increased $2.50 to $524.50, with 199 units changing hands. Jamaica Broilers declined $1.39 to end at $29.61 with the swapping of 24,396 stock units, Kingston Wharves rose 55 cents to $34.60 with 4,215 stock units clearing the market, Massy Holdings advanced $1.50 to end at $80 and finishing with 1,054,501 units passing over the exchange.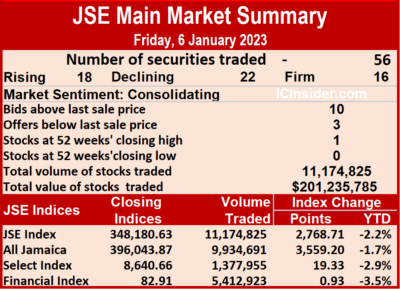 Palace Amusement shed $90 in ending at $1590 with investors trading 431 stocks, PanJam Investment rallied $6 to $63 with 1,072,233 shares crossing the market, Proven Investments climbed $2.01 in closing at $30 in an exchange of 170,085 stocks. Sagicor Group dropped $3.15 to close at $51.65 after exchanging 9,594 shares, Scotia Group fell 40 cents in ending at $34 in trading 1,236 units, Stanley Motta popped 90 cents to end at $5 as investors exchanged 198 stock units. Supreme Ventures dipped $2.37 in closing at $27.50 after 32,697 shares crossed the market and Sygnus Real Estate Finance fell 60 cents to close at $9.40, trading 11,699 stocks.
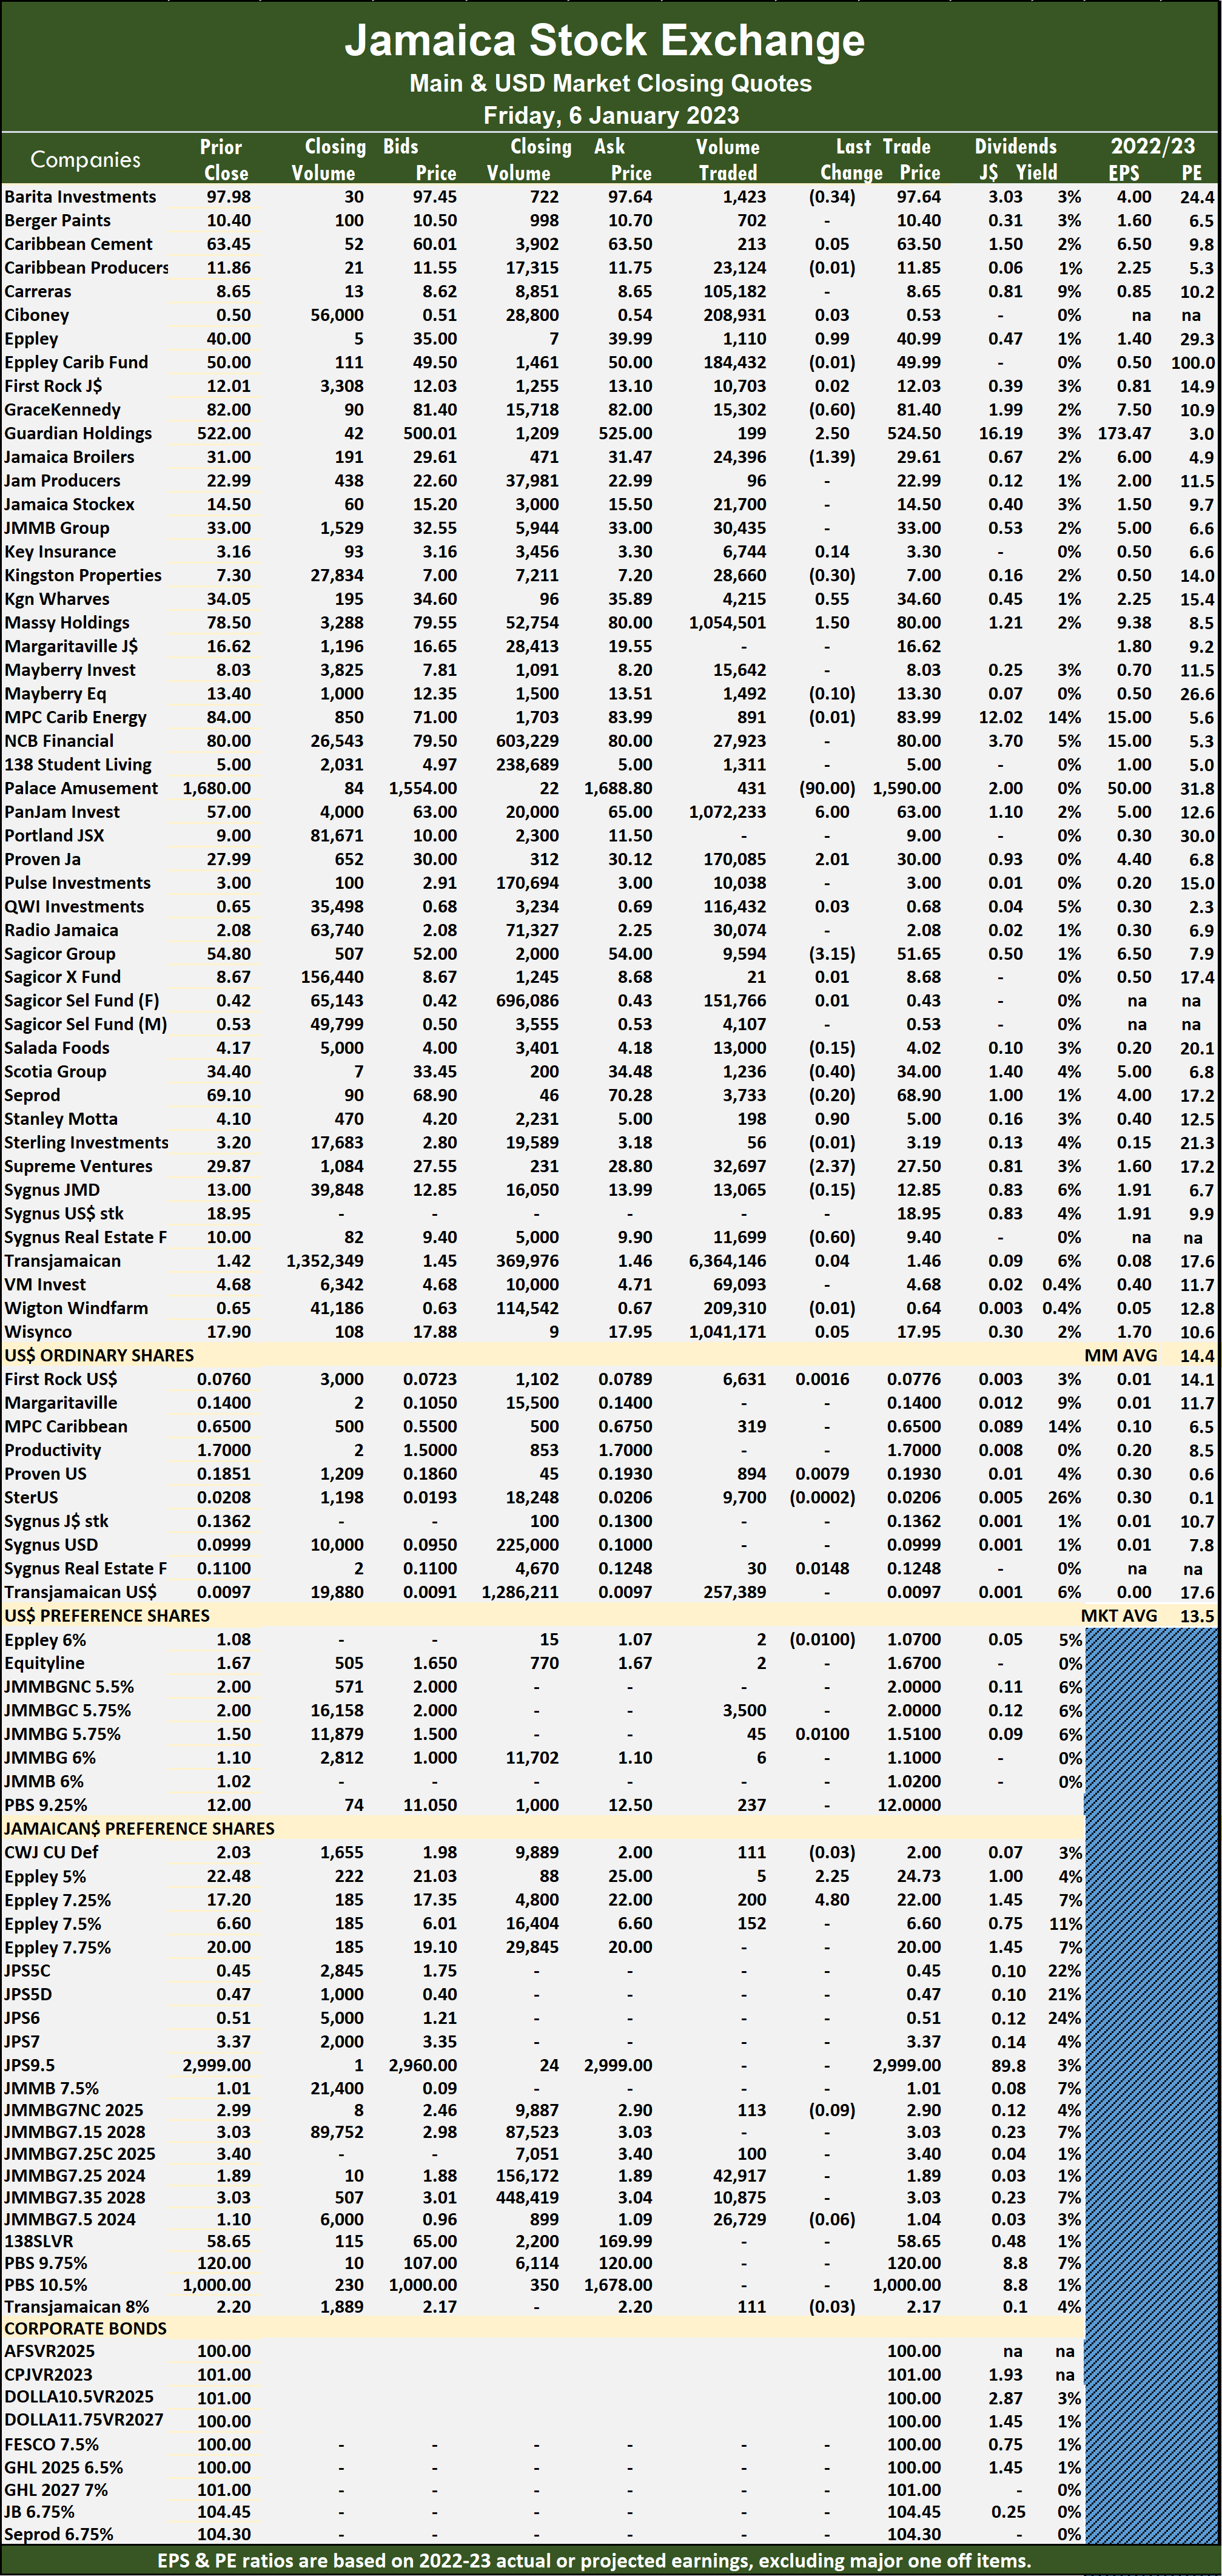 In the preference segment, Eppley 5% preference share increased $2.25 to $24.73 with five units passing through the market and Eppley 7.25% preference share gained $4.80 to end at $22 after an exchange of 200 stock units.
Prices of securities trading are those for the last transaction of each stock unless otherwise stated.


