Newly Junior Market listed One Great Studio had a big bounce of 21.66 million stocks traded to better the 14 million shares traded on Tuesday with the price edging 4 cents higher to $1.18. Trading in the new listing lifted the volume of stocks traded well above Tuesday’s level and helped to lift the value of stocks traded higher as well.
 At close, the JSE Combined Market Index shed 1,372.25 points to close trading at 325,607.84, the All Jamaican Composite Index dipped 255.62 points to 345,947.18, the JSE Main Index declined 1,603.18 points to 311,845.95, the Junior Market Index gained 13.23 points to close at 3,783.25 while the JSE USD Market Index popped 2.22 points to 256.33.
At close, investors traded 31,325,305 shares in all three markets, up from 21,288,720 stock units on Tuesday. The value of stocks traded on the Junior and Main markets amounted to $122.83 million, versus $61.34 million on Tuesday. The JSE USD market closed with investors trading 218,675 shares for US$32,659 up from 90,382 units at US$2,822, on Tuesday.
In the preference segment, Eppley 7.25% preference share dipped $1.21 to $5.56 and Jamaica Public Service 7% rallied $15 to $57.
 The market’s PE ratio, the most popular measure used to determine the value of stocks ended at 19.3 on 2022-23 earnings and 10.8 times those for 2023-24 at the close of trading. ICInsider.com PE ratio chart and the more detailed daily report charts provide investors with regularly updated information to help decision-making.
The PE ratio chart covers all ordinary shares on the Jamaica Stock Exchange, with companies grouped by industry, allowing for easy comparisons between the same sector companies and the overall market. The EPS & PE ratios are based on 2023 and 2024 actual or projected earnings, excluding major one off items.
Investors need pertinent information to successfully navigate numerous investment options in the local stock market. The ICInsider.com PE ratio chart and the more detailed daily report charts provide investors with regularly updated information to help decision-making.
Investors should use the chart to help make rational decisions when investing in stocks close to the average for the sector and not going too far from it unless there are compelling reasons to do so. This approach helps to remove emotions from investment decisions and place them on fundamentals while at the same time not being too far from the majority of investors.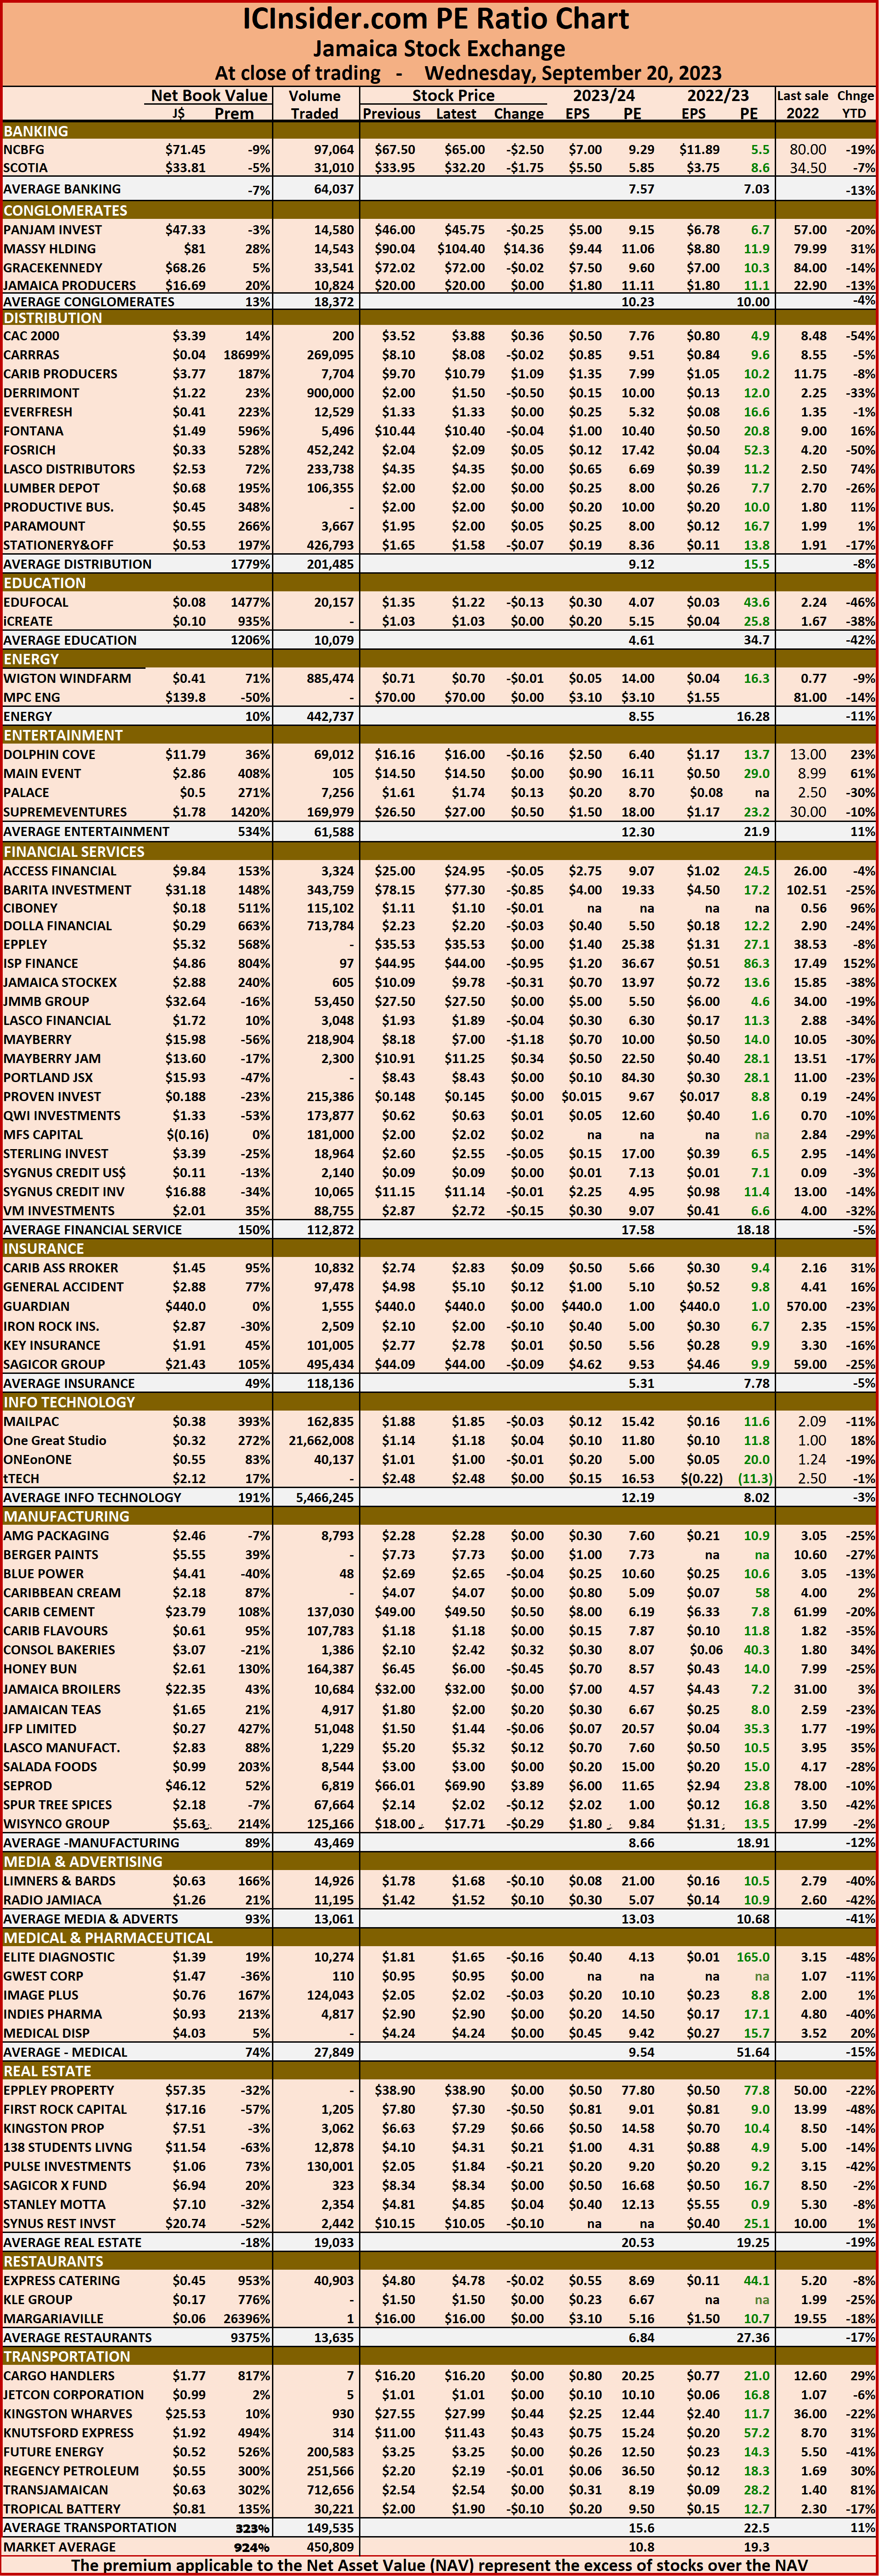 Investors who buy when the price of a stock is close to the average will find that they are not inclined to overpay for a stock.
The net asset value of each company is reported as a guide to assess the value of stocks based on this measure quickly. The chart also shows daily changes in stock prices and the percentage year to date price movement based on the last traded prices.
Dividends paid or payable and yields for each company are shown in the Main and Junior Markets’ daily report charts along with the closing volume pertaining to the highest bid and the lowest offer for each company.


