Big gains for All Jamaican, Juniors inch higher

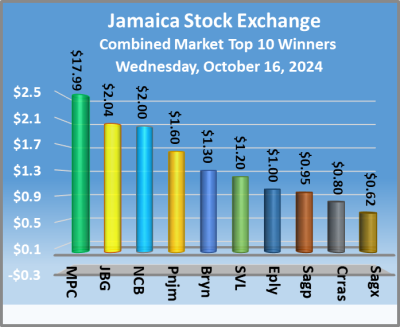
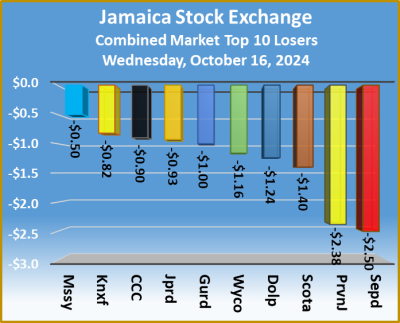
The All Jamaican Composite Index recorded robust gains on Wednesday at the close of market activities on the Jamaica Stock Exchange with the volume and value of stocks trading dipped from Tuesday’s levels resulting in prices of 49 shares rising, 40 declining and 22 remaining firm.

At the close of trading,  the JSE Combined Market Index rose 2,032.13 points to 324,259.36, the All Jamaican Composite Index jumped 4,324.48 points to end at 356,293.12, the JSE Main Index rallied 2,035.29 points to end at 311,523.65, the Junior Market Index rose 11.99 points to 3,675.39, and the JSE USD Market Index slipped 0.81 points to close trading at 222.88.

At the close of trading, a total of 15,297,658 shares were exchanged in all three markets, down from 16,881,624 units on Tuesday, with the value of stocks traded on the Junior and Main markets amounted to $64.86 million, below the $74.86 million changing hands on the previous trading day and the JSE USD market closed with an exchange of 299,517 shares for US$37,566 compared to 494,867 units at US$29,853 on Tuesday.
In Main Market activity, Palace Amusement led trading with 4.75 million stocks followed by Wigton Windfarm with 1.86 million shares and QWI Investments with 1.43 million units.
In Junior Market trading, iCreate led trading with 692,941 stocks followed by, JFP Ltd with 504,496 shares and Mailpac Group with 391,285 units. In the preference segment, Jamaica Public Service 9.5% sank $210 to $2,690. 

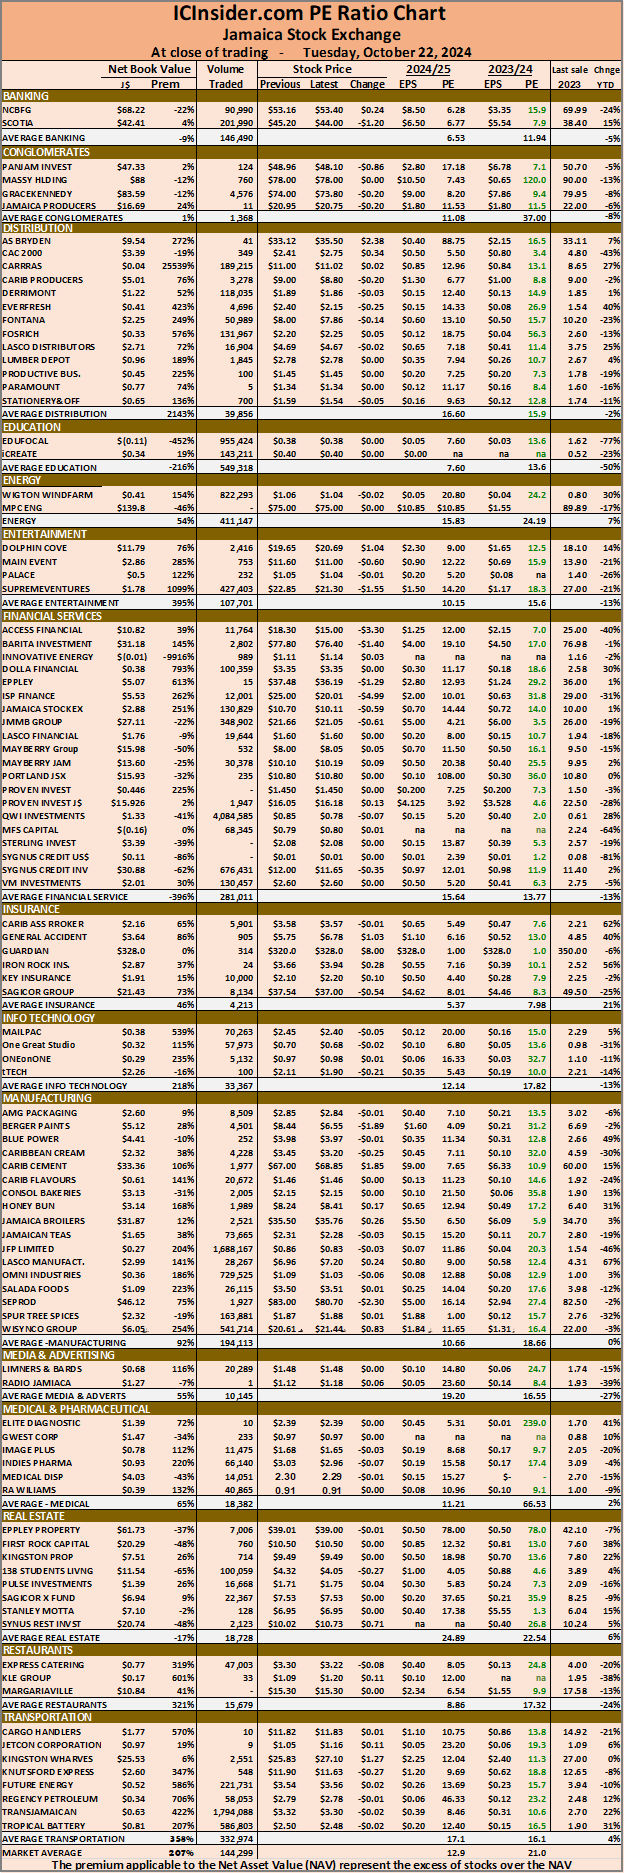
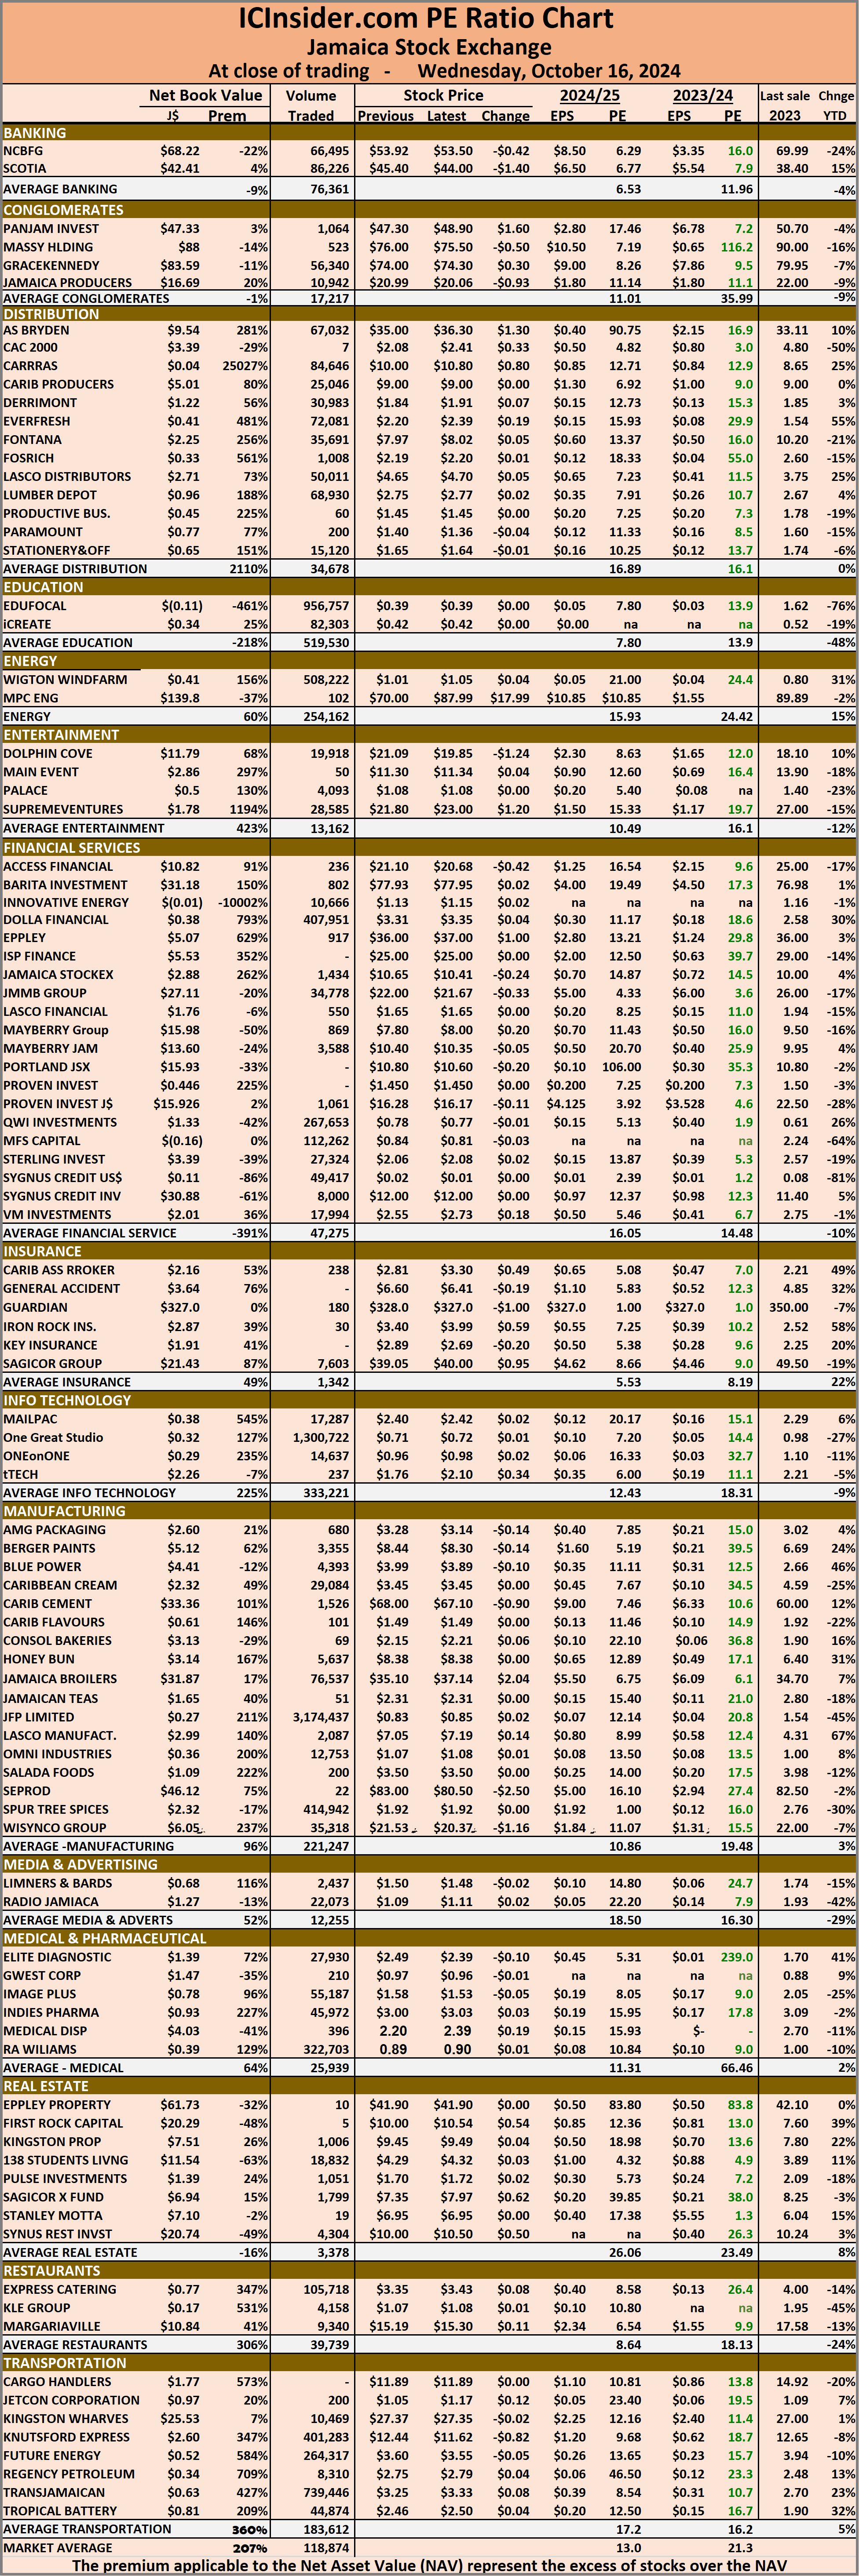
The market’s PE ratio, the most popular measure used to value stocks, ended at 12.8 on 2024-25 earnings and 20.9 based on 2023-24 earnings. The ICInsider.com PE ratio chart and more detailed daily charts provide investors with regularly updated information to help decision-making. The PE ratio chart covers all ordinary shares on the Jamaica Stock Exchange, grouped by industry, allowing for easy comparisons within a sector and the overall market. The EPS & PE ratios are based on 2023 and 2024 actual or projected earnings, excluding major one off items.

The PE ratio chart covers all ordinary shares on the Jamaica Stock Exchange, grouped by industry, allowing for easy comparisons within a sector and the overall market. The EPS & PE ratios are based on 2023 and 2024 actual or projected earnings, excluding major one off items.

Pertinent information is required to navigate numerous investment options successfully in the stock market. The ICInsider.com PE ratio chart and more detailed daily charts provide investors with regularly updated information to help decision-making. The chart should be used in making rational decisions when investing in stocks close to the average for the sector, not going too far from it unless there are compelling reasons to do so. This approach helps to remove emotions from investment decisions and place them on fundamentals while at the same time not being too far from the majority of investors. Investors who buy when the price of a stock is close to the average will find that they are not inclined to overpay for a stock. The net asset value of each company is incorporated into the chart. Investors can use this measure in assessing stock values. The chart also shows daily changes in stock prices and the percentage year to date price movement based on the last traded prices. Dividends that are paid or are due to be paid and yields for each company are shown in the Main and Junior Markets’ daily report charts, along with the closing volume of the highest bid and the lowest offer for each company.

Fall for all JSE Markets

Trading resumed on the Jamaica Stock Exchange following closure of the market on National Heroes day on Monday and ended declines in all three markets with declines in the volume and value of stocks traded compared to Friday and resulting in prices of 32 shares rising, 54 declining and 29 remaining firm.

At the close of trading the JSE Combined Market Index sank 2,479.88 points to close at 322,227.23, the All Jamaican Composite Index fell 5,528.26 points to end at 351,968.64, the JSE Main Index dropped 2,401.76 points to 309,488.36, the Junior Market Index shed 25.54 points to end at 3,663.4, and the JSE USD Market Index dipped 1.99 points to settle at 223.69.

At the close of trading, 16,881,624 shares were exchanged in all three markets, down from 19,514,140 units on Friday, with the value of stocks traded on the Junior and Main markets amounted to 74.86 million, well lower than the $93.04 million on the previous trading day and the JSE USD market closed with an exchange of 494,867 shares for US$29,853 compared to 494,005 units at US$35,761 on Friday.

In Main Market activity, QWI Investments led trading with 4.08 million stocks followed by Transjamaican Highway with 1.79 million shares and Sagicor Select Financial Fund with 892,223 units.

In Junior Market trading, JFP Ltd led trading with 1.69 million stocks followed by EduFocal with 955,424 shares and Omni Industries with 729,525 units.

The market’s PE ratio, the most popular measure used to value stocks, ended at 12.9 on 2023-24 and 21 based on 2024-25 earnings computed by ICInsider.com. The PE ratio chart and more detailed daily charts provide investors with regularly updated information to help decision-making. The PE ratio chart covers all ordinary shares on the Jamaica Stock Exchange, grouped by industry, allowing for easy comparisons within a sector and the overall market. The EPS & PE ratios are based on 2023 and 2024 actual or projected earnings, excluding major income or expenses that are
The PE ratio chart covers all ordinary shares on the Jamaica Stock Exchange, grouped by industry, allowing for easy comparisons within a sector and the overall market. The EPS & PE ratios are based on 2023 and 2024 actual or projected earnings, excluding major income or expenses that are not likely to be incurred regularly.
Pertinent information is required to navigate numerous investment options successfully in the stock market. The ICInsider.com PE ratio chart and more detailed daily charts provide investors with regularly updated information to help decision-making. The chart should be used in making rational decisions when investing in stocks close to the average for the sector, not going too far from it unless there are compelling reasons to do so.

This approach helps to remove emotions from investment decisions and place them on fundamentals while at the same time not being too far from the majority of investors. Investors who buy when the price of a stock is close to the average will find that they are not inclined to overpay for a stock. The net asset value of each company is incorporated into the chart. Investors can use this measure in assessing stock values. The chart also shows daily changes in stock prices and the percentage year to date price movement based on the last traded prices. Dividends that are paid or are due to be paid and yields for each company are shown in the Main and Junior Markets’ daily report charts, along with the closing volume of the highest bid and the lowest offer for each company.

Trading back to earth for JSE USD Market

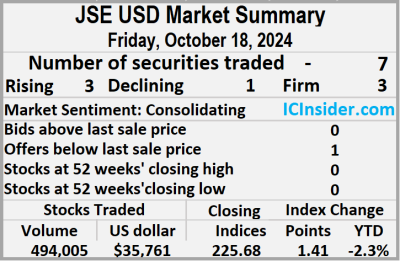
Trading averaged 70,572 shares at US$5,109 compared to 8,509,319 stocks at US$182,124 on Thursday, averaging 621,999 shares at US$15,198 for the month to date, compared with 668,505 units at US$16,048 on the previous day and September that ended with an average of 161,382 stocks for US$5,462.

The US Denominated Equities Index rallied 1.41 points to end at 225.68. The Investor’s Choice bid-offer indicator shows no stock ending with a bid higher than the last selling price and one with a lower offer.

The PE Ratio, one of the best known measures used to determine appropriate stock values, averages 6.9. The PE ratio is calculated based on last traded prices divided by projected earnings, computed by ICInsider.com for companies with financial year ending around August 2025.
At the close, MPC Caribbean Clean Energy gained 10.99 cents to end at 65 US cents with a transfer of 33 shares, Proven Investments fell 0.04 of one cent and ended at 9.96 US cents with investors dealing in 301,879 stocks, Sterling Investments ended at 1.49 US cents with 7,481 shares clearing the market. Sygnus Credit Investments popped 0.01 of a cent to end at 7.3 US cents with investors swapping 6,782 stock units, Sygnus Real Estate Finance USD share remained at 5.5 US cents with 1,000 shares crossing the market and Transjamaican Highway rallied 0.04 of one cent to close at 2.15 US cents with traders dealing in 176,730 stocks.
In the preference segment, Sygnus Credit Investments E8.5% remained at US$10.90 with 100 units passing through the market.
Prices of securities trading are those for the last transaction of each stock unless otherwise stated.

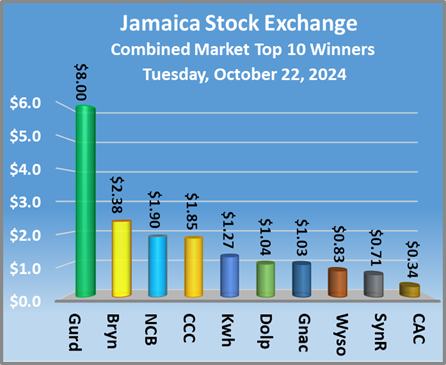
Trading jumps on the Jamaica Stock Exchange

At the close of trading the JSE Combined Market Index dropped 313.92 points to end at 325,916.23, the All Jamaican Composite Index slipped 822.3 points to wrap up trading at 358114.95, the JSE Main Index fell 145.24 points to cease trading at 313,041.43, the Junior Market Index slipped 24.37 points to finish at 3,704.02, and the JSE USD Market Index popped 2.98 points to close at 224.27.

At the close of trading, 64,714,237 shares were exchanged in all three markets, up from 11,145,537 units on Wednesday. The value of stocks traded on the Junior and Main markets jumped to $267.31 million, well above the $39.69 million on the previous trading day and the JSE USD market closed with 51,055,916 shares traded for US$1,092,742 up from  231,331 units at US$18,240 on Wednesday.

In Main Market trading activity, GraceKennedy led trading with 2.52 million stocks followed by QWI Investments with 2.20 million shares and Wigton Windfarm with 1.03 million units.

In Junior Market trading, One Great Studio led trading with 675,590 shares followed by Dolla Financial with 551,601 stocks and EduFocal with 424,289 units.

In the preference segment, Jamaica Public Service 7% rallied $4.90 to end at $44 and 138 Student Living preference share increased $16.98 in closing at $186.76.

The market’s PE ratio, the most popular measure used to value stocks, ended at 12.9 on 2024-25 earnings and 21.1 based on 2023-24 earnings. ICInsider.com PE ratio chart and the more detailed daily charts provide investors with regularly updated information to help decision-making. The PE ratio chart covers all ordinary shares on the Jamaica Stock Exchange, grouped by industry, allowing for easy comparisons within a sector and the overall market. The EPS & PE ratios are based on 2023 and 2024 actual or projected earnings, excluding major one off items.

The PE ratio chart covers all ordinary shares on the Jamaica Stock Exchange, grouped by industry, allowing for easy comparisons within a sector and the overall market. The EPS & PE ratios are based on 2023 and 2024 actual or projected earnings, excluding major income or expenses that do not recur regularly.

Pertinent information is required to navigate numerous investment options successfully in the stock market. The ICInsider.com PE ratio chart and more detailed daily charts provide investors with regularly updated information to help decision-making. The chart should be used in making rational decisions when investing in stocks close to the average for the sector, not going too far from it unless there are compelling reasons to do so. This approach helps to remove emotions from investment decisions and place them on fundamentals while at the same time not being too far from the majority of investors. Investors who buy when the price of a stock is close to the average will find that they are not inclined to overpay for a stock. The net asset value of each company is incorporated into the chart. Investors can use this measure in assessing stock values. The chart also shows daily changes in stock prices and the percentage year to date price movement based on the last traded prices. Dividends that are paid or are due to be paid and yields for each company are shown in the Main and Junior Markets’ daily report charts, along with the closing volume of the highest bid and the lowest offer for each company.
Transjamaican towers over JSE USD Market on Thursday


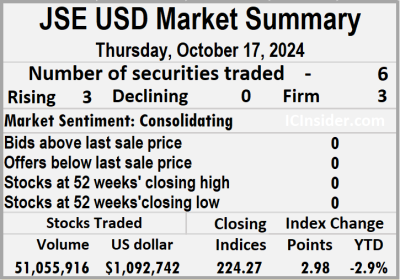
Transjamaican Highway towered over the Jamaica Stock Exchange US dollar market on Thursday, with investors exchanging more than 51 million shares of the company, pushing the volume of stocks traded in the market up by a stunning 21,971 percent and the value 5,891 percent more than on Wednesday, resulting from an exchange of six securities, compared to seven on Wednesday with prices of three rising and three ending unchanged.
The market closed with an exchange of 51,055,916 shares valued US$1,092,742 compared to 231,331 units at US$18,240 on Wednesday.
Trading averaged 8,509,319 shares at US$182,124 compared to 33,047 stocks at US$2,606 on Wednesday, with a month to date average of 668,505 shares at US$16,048 compared with 57,533 units at US$3,107 previously and September that ended with an average of 161,382 stock units for US$5,462.
The US Denominated Equities Index gained 2.98 points to end at 224.27. The Investor’s Choice bid-offer indicator shows none ended with a bid higher than the last selling price and none with a lower offer.
The PE Ratio, one of the best known measures used to determine appropriate stock values, averages 6.7. The PE ratio is calculated based on last traded prices divided by projected earnings, computed by ICInsider.com for companies with financial year ending around August 2025.
At the close, Sterling Investments remained at 1.49 US cents and closed in trading 254 shares, Sygnus Credit Investments gained 0.29 of one cent to close at 7.29 US cents in switching ownership of 300 stocks, Sygnus Real Estate Finance USD share ended at 5.5 US cents after an exchange of 1,700 shares and Transjamaican Highway rose 0.1 of a cent and ended at 2.11 US cents after 51,043,647 stock units passed through the market.
In the preference segment, JMMB Group US8.5% preference share remained at US$1.09 in an exchange of 10,014 shares and JMMB Group 5.75% climbed 29.7 cents to close at US$1.98 with investors dealing in just one stock.
Prices of securities trading are those for the last transaction of each stock unless otherwise stated.

Main Market rallies Junior & USD markets fall


Trading activities dropped on Wednesday on the Jamaica Stock Exchange with a fall in the volume and value of stocks traded compared to Tuesday and ended with a rise in the Main Market indices with the Junior Market and the JSE USD market fell and resulted in prices of 39 shares rising, 45 declining and 30 remaining firm.
At the close of trading the JSE Combined Market Index rose 1,760.76 points to 326,230.15, the All Jamaican Composite Index jumped 3,577.52 points to end trading at 358,937.25, the JSE Main Index popped 2,012.28 points to 313,186.67, the Junior Market Index shed 22.73 points to 3,728.39, and the JSE USD Market Index skidded 0.95 points to close at 221.29.
At the close of trading, 11,145,537 shares were exchanged in all three markets, down from 14,737,070 units on Tuesday, with the value of stocks traded on the Junior and Main markets amounted to $39.69 million, which is lower than the $52.92 million on the previous trading day and the JSE USD market closed with an exchange of 231,331 shares for US$18,240 compared to 459,083 units at US$13,033 on Tuesday.
In Main Market activity, Transjamaican Highway led trading with 739,446 stocks followed by Wigton Windfarm with 508,222 shares and Sagicor Select Financial Fund with 305,940 units.
In Junior Market trading, JFP Ltd led trading with 3.17 million stocks followed by One Great Studio with 1.30 million shares and EduFocal with 956,757 units.
In the preference segment, Eppley 7.50% preference share slipped 62 cents and ended at $5.9, Jamaica Public Service 7% fell $6.90 to end at $39.10, 138 Student Living preference share shed $29.96 in closing at $169.78 and Sygnus Credit Investments C10.5% gained $2 to close at $105.
The market’s PE ratio, the most popular measure used to value stocks, ended at 21.3 based on 2023-24 earnings and 13 based on 2024-25 projected earnings. The ICInsider.com PE ratio chart and the more detailed daily charts provide investors with regularly updated data to help decision-making. The PE ratio chart covers all ordinary shares on the Jamaica Stock Exchange, grouped by industry, allowing for easy comparisons within a sector and the overall market. The EPS & PE ratios are based on 2023 and 2024 actual or projected earnings, excluding major one off items.
The PE ratio chart covers all ordinary shares on the Jamaica Stock Exchange, grouped by industry, allowing for easy comparisons within a sector and the overall market. The EPS & PE ratios are based on 2023 and 2024 actual or projected earnings, excluding major one off items.
Pertinent information is required to navigate numerous investment options successfully in the stock market. The ICInsider.com PE ratio chart and more detailed daily charts provide investors with regularly updated information to help decision-making. The chart should be used in making rational decisions when investing in stocks close to the average for the sector, not going too far from it unless there are compelling reasons to do so. This approach helps to remove emotions from investment decisions and place them on fundamentals while at the same time not being too far from the majority of investors. Investors who buy when the price of a stock is close to the average will find that they are not inclined to overpay for a stock. The net asset value of each company is incorporated into the chart. Investors can use this measure in assessing stock values. The chart also shows daily changes in stock prices and the percentage year to date price movement based on the last traded prices. Dividends that are paid or are due to be paid and yields for each company are shown in the Main and Junior Markets’ daily report charts, along with the closing volume of the highest bid and the lowest offer for each company.

Trading dips on JSE USD Market


The market closed with an exchange of 231,331 shares for US$18,240 compared to 459,083 units at US$13,033 on Tuesday. Trading averaged 33,047 shares at US$2,606 compared to 51,009 stocks at US$1,448 on Tuesday, with the month to date averaging 57,533 shares at US$3,107 compared with 59,981 units at US$3,158 on the previous day and September with an average of 161,382 units for US$5,462.

The US Denominated Equities Index declined 0.95 points to settle at 221.29. The Investor’s Choice bid-offer indicator shows one stock ended with a bid higher than the last selling price and none with a lower offer.

The PE Ratio, one of the best known measures used to determine appropriate stock values, averages 6.6. The PE ratio is calculated based on last traded prices divided by projected earnings, computed by ICInsider.com for companies with financial year ending around August 2025.

At the close of the market, First Rock Real Estate USD share sank 0.5 of one cent in closing at 3.3 US cents with investors trading 9,340 stock units, MPC Caribbean Clean Energy rallied 0.01 of one cent to 54.01 US cents after an exchange of 60 shares, Proven Investments ended at 10 US cents and closed with 298 units changing hands. Sterling Investments remained at 1.49 US cents with an exchange of 49,417 stocks and Transjamaican Highway shed 0.04 of one cent to end at 2.01 US cents after 159,816 shares changed hands.

In the preference segment, JMMB Group US8.5% preference share remained at US$1.09 after investors exchanged 11,747 stocks and JMMB Group 5.75% ended at US$1.683 in the trading of 653 units.
Prices of securities trading are those for the last transaction of each stock unless otherwise stated.

Trading climbs on JSE USD Market


The Jamaica Stock Exchange US dollar market closed Tuesday, with the volume of stocks traded jumping 277 percent with a 55 percent more value than on Monday, resulting in the exchange of nine securities, up from seven on Monday with prices of one rising, four declining and four ending unchanged.
The market closed with an exchange of 459,083 shares for US$13,033 up sharply from 121,661 units at US$8,414 on Monday.
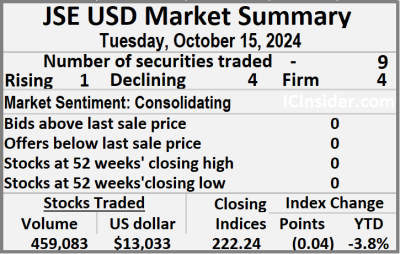
Trading averaged 51,009 shares at US$1,448 up from 17,380 stocks at US$1,202 on Monday, with a month to date average of 59,981 units at US$3,158 in contrast with 61,305 shares at US$3,410 on the previous day and September that ended with an average of 161,382 stock units for US$5,462.
The US Denominated Equities Index slipped 0.04 points to 222.24, Investor’s Choice bid-offer indicator shows no ending with a bid higher than the last selling price and none with a lower offer.
The PE Ratio, one of the best known measures used to determine appropriate stock values, averages 6.7. The PE ratio is calculated based on last traded prices divided by projected earnings, computed by ICInsider.com for companies with financial year ending around August 2025.
At the close, First Rock Real Estate USD share popped 0.5 of a cent and ended at 3.8 US cents in trading 1,020 stock units, Margaritaville ended at 10 US cents after an exchange of 41 shares, Proven Investments remained at 10 US cents and closed after an exchange of 20,098 stocks. Sterling Investments lost 0.01 of one cent after closing at 1.49 US cents with traders dealing in 27,613 units, Sygnus Credit Investments declined 0.28 of a cent to end at 7 US cents in an exchange of 9,026 stocks and Transjamaican Highway ended at 2.05 US cents trading 399,754 units.
In the preference segment, JMMB Group US8.5% preference share ended at US$1.09 after 1,404 shares passed through the market, JMMB Group 5.5% shed 0.01 of a cent in closing at US$2.0499 with investors swapping 5 stock units and JMMB Group 5.75% sank 29.7 cents and ended at US$1.683 after an exchange of 122 shares.
Prices of securities trading are those for the last transaction of each stock unless otherwise stated.

Junior Market rises, JSE Main Market falls


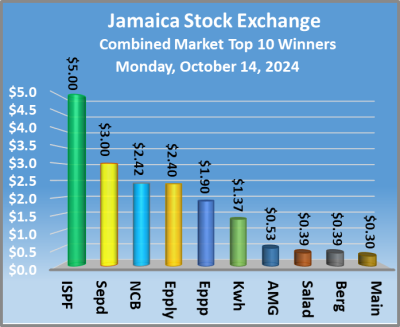
Trading picked up on the Jamaica Stock Exchange on Monday with increased activity in the Main and Junior Markets with the JSE USD market closing with fewer shares changing hands with a lower value than on Friday with the number of stocks changing hands rising, with the value of stocks traded jumping sharply over the previous trading day, resulting in prices of 33 shares gaining and 39 declining.
At the close of trading, the JSE Combined Market Index shed 2,096.14 points to 323,574.82, the All Jamaican Composite Index skidded 1,331.62 points to close trading at 356,654.64 and the JSE Main Index sank 2,353.97 points to 310,266.31. The Junior Market Index rose 21.52 points to end at 3,747.45 and the JSE USD Market Index rallied 1.68 points to end the day at 222.28.
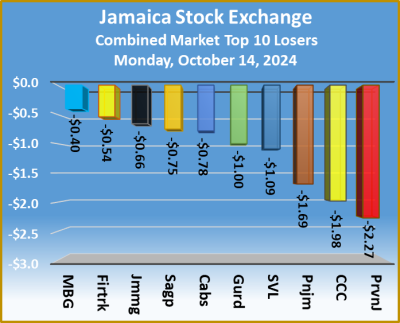
At the close of trading, 16,138,151 shares were exchanged in all three markets, up from just 7,927,009 units on Friday with the value of stocks traded on the Junior and Main markets amounted to $85.44 million, well over the $54.13 million on the previous trading day and the JSE USD market closed with an exchange of 121,661 shares for US$8,414 compared to 386,222 units at US$19,062 on Friday.
In Main Market activity, Transjamaican Highway led trading with 5.98 million shares followed by QWI Investments with 1.84 million stocks and Wigton Windfarm with 1.29 million units.
In Junior Market trading, Paramount Trading led trading with 1.06 million shares followed by One Great Studio with 964,792 units and Fosrich with 472,000 stock units.
In the preferred segment, Eppley 7.50% preference share slipped 99 cents to $5.61 and Sygnus Credit Investments C10.5% sank $2 to end at $103.
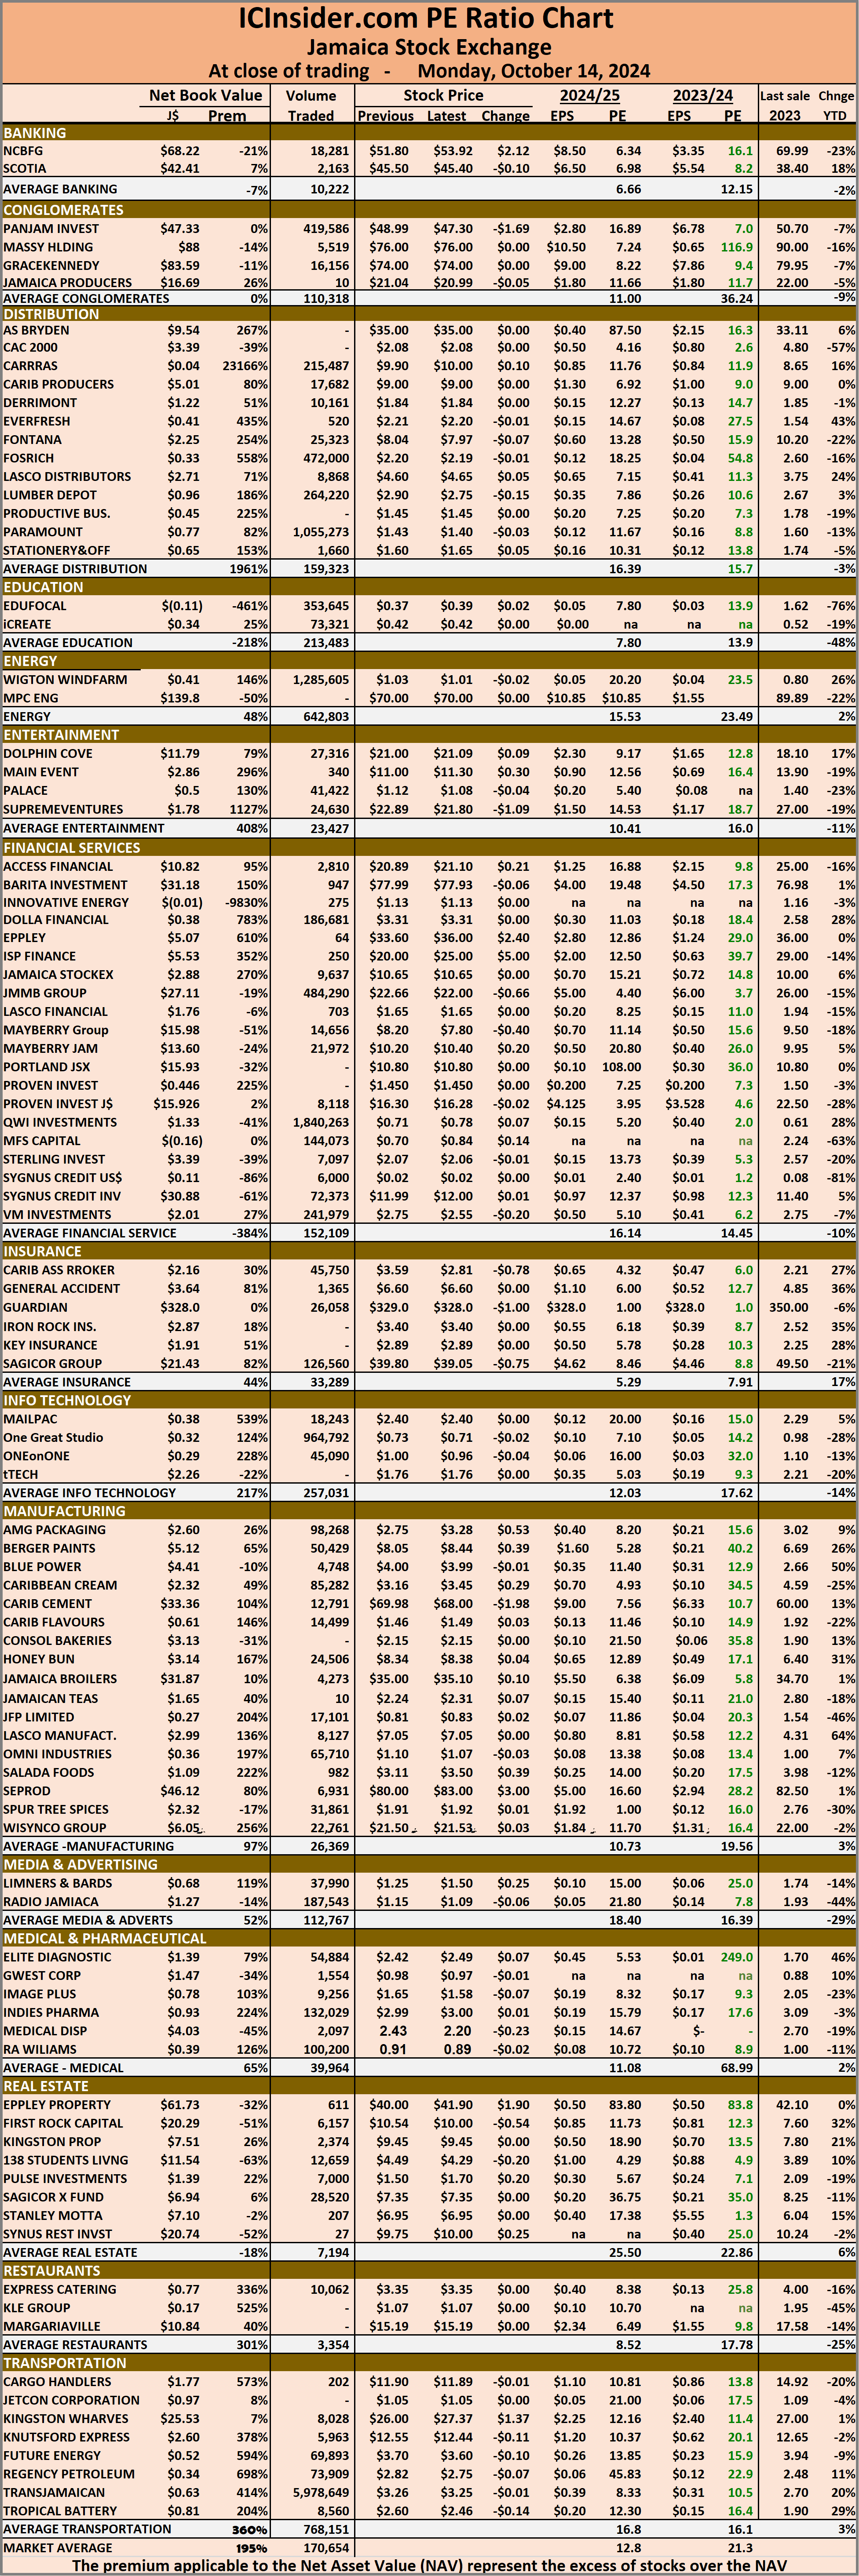
The market’s PE ratio, the most popular measure used to value stocks, ended at 21.3 on 2023-24 earnings and 12.8 times those for 2024-25 at the close of trading. ICInsider.com PE ratio chart and more detailed daily charts provide investors with regularly updated information to help decision-making.
The PE ratio chart covers all ordinary shares on the Jamaica Stock Exchange, grouped by industry, allowing for easy comparisons within a sector and the overall market. The EPS & PE ratios are based on 2023 and 2024 actual or projected earnings, excluding major one off items.
Pertinent information is required to navigate numerous investment options successfully in the stock market. The ICInsider.com PE ratio chart and more detailed daily charts provide investors with regularly updated information to help decision-making.
The chart should be used in making rational decisions when investing in stocks close to the average for the sector, not going too far from it unless there are compelling reasons to do so. This approach helps to remove emotions from investment decisions and place them on fundamentals while at the same time not being too far from the majority of investors. Investors who buy when the price of a stock is close to the average will find that they are not inclined to overpay for a stock.
The net asset value of each company is incorporated into the chart. Investors can use this measure in assessing stock values. The chart also shows daily changes in stock prices and the percentage year to date price movement based on the last traded prices.
Dividends that are paid or are due to be paid and yields for each company are shown in the Main and Junior Markets’ daily report charts, along with the closing volume of the highest bid and the lowest offer for each company.

Trading drops on Jamaica Stocks Exchange

On another day of moderate activity, the Jamaica Stock Exchange, the volume and value of stocks traded fell well below Tuesday’s levels and resulted in the Main Market primary indices as the Junior Market and the JSE USD market recorded modest gains with the market closing with prices of 30 shares rising and 37 declining.
At the close of the market, the JSE Combined Market Index fell 752.92 points to close at 325,559.99, the All Jamaican Composite Index slipped 1,518.48 points to 353,242.66, the JSE Main Index slipped 863.93 points to 313,064.12. The Junior Market Index rose 10.46 points to 3,651.22 and the JSE USD Market Index advanced 1.67 points to cease trading at 228.02.
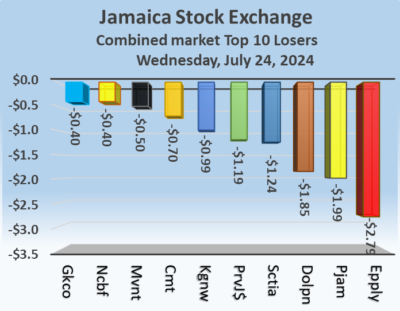
At the close of trading, 7,685,373 shares were exchanged in all three markets, down from 22,053,861 units on Tuesday, with the value of stocks traded on the Junior and Main markets amounted to $58.43 million, well below the $86.67 million on the previous trading day and the JSE USD market closed with an exchange of 25,171 shares for US$2,096 compared to 484,869 units at US$42,958 on Tuesday.
In Main Market activity, Wisynco Group led trading with 2.21 million shares followed by Transjamaican Highway with 1.08 million stocks and Wigton Windfarm with 467,244 units.
In Junior Market trading, EduFocal led trading with 1.03 million shares followed by Dolla Financial with 460,385 stocks for 17.9 percent of the day’s trade and iCreate with just 202,733 units.
In the preference segment, Sygnus Credit Investments C10.5 percent popped $9.04 to end at $100.
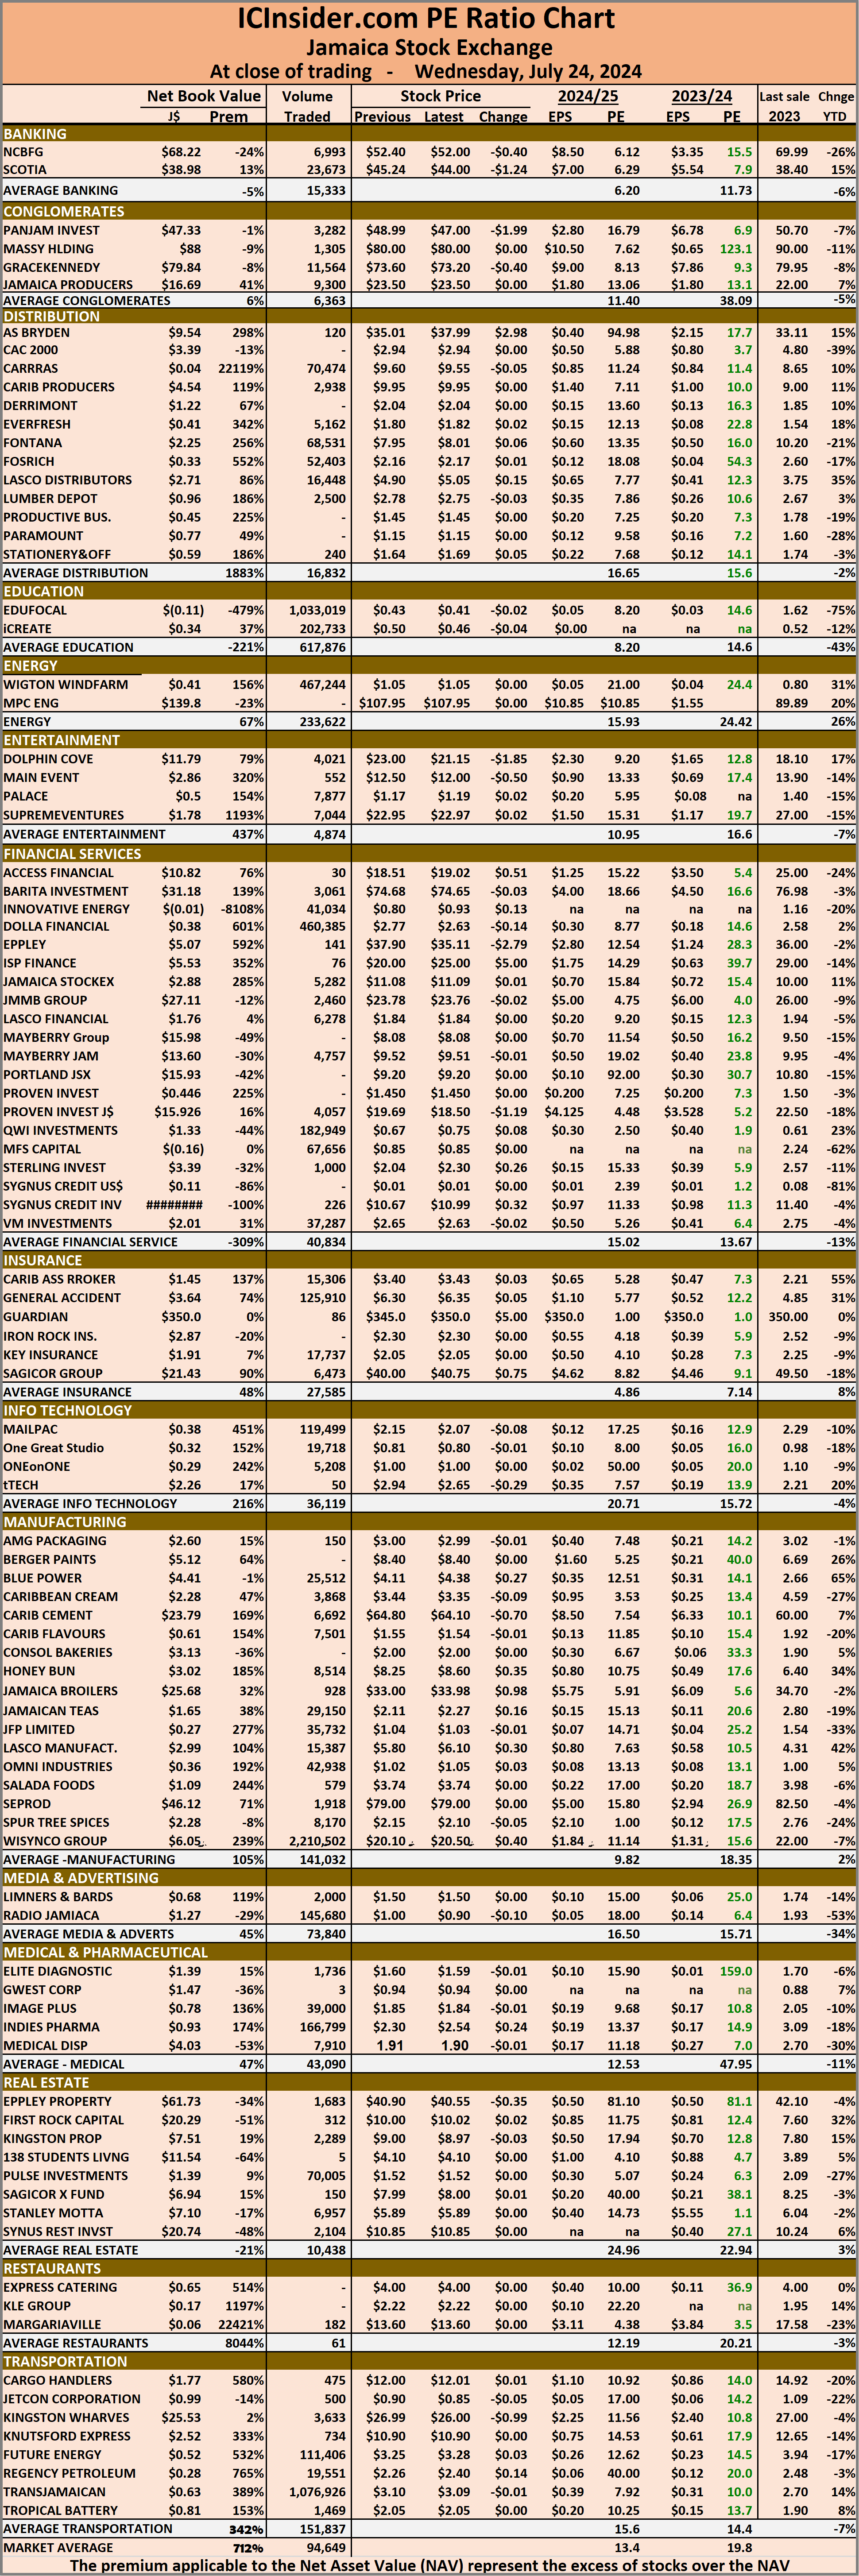
The market’s PE ratio, the most popular measure used to value stocks, ended at 19.8 on 2023-24 earnings and 13.4 times those for 2024-25 at the close of trading. ICInsider.com PE ratio chart and the more detailed daily charts provide investors with regularly updated information to help decision-making.
The PE ratio chart includes all of the ordinary shares on the Jamaica Stock Exchange, grouped by industry, allowing for easy comparisons within a sector and the overall market. The EPS & PE ratios are based on 2023 and 2024 actual or projected earnings, excluding major one off items.
Pertinent information is required to navigate numerous investment options successfully in the stock market. The ICInsider.com PE ratio chart and more detailed daily charts provide investors with regularly updated information to help decision-making.
The chart should be used in making rational decisions when investing in stocks close to the average for the sector, not going too far from it unless there are compelling reasons to do so. This approach helps to remove emotions from investment decisions and place them on fundamentals while at the same time not being too far from the majority of investors. Investors who buy when the price of a stock is close to the average will find that they are not inclined to overpay for a stock.
The net asset value of each company is incorporated into the chart. Investors can use this measure in assessing stock values. The chart also shows daily changes in stock prices and the percentage year to date price movement based on the last traded prices.
Dividends that are paid or are due to be paid and yields for each company are shown in the Main and Junior Markets’ daily report charts, along with the closing volume of the highest bid and the lowest offer for each company.