Stocks ended with losses at the close of trading on the Jamaica Stock Exchange on Tuesday with the Combined Index falling 1,327.32 points to 403,433.65, the All Jamaican Composite Index added 111.44 points to end at 446,300.87.
The Junior Market gained 14.23 points to close at 3,940.52 and the JSE Main Index dropped 1,550.37 points to end at 393,538.93.
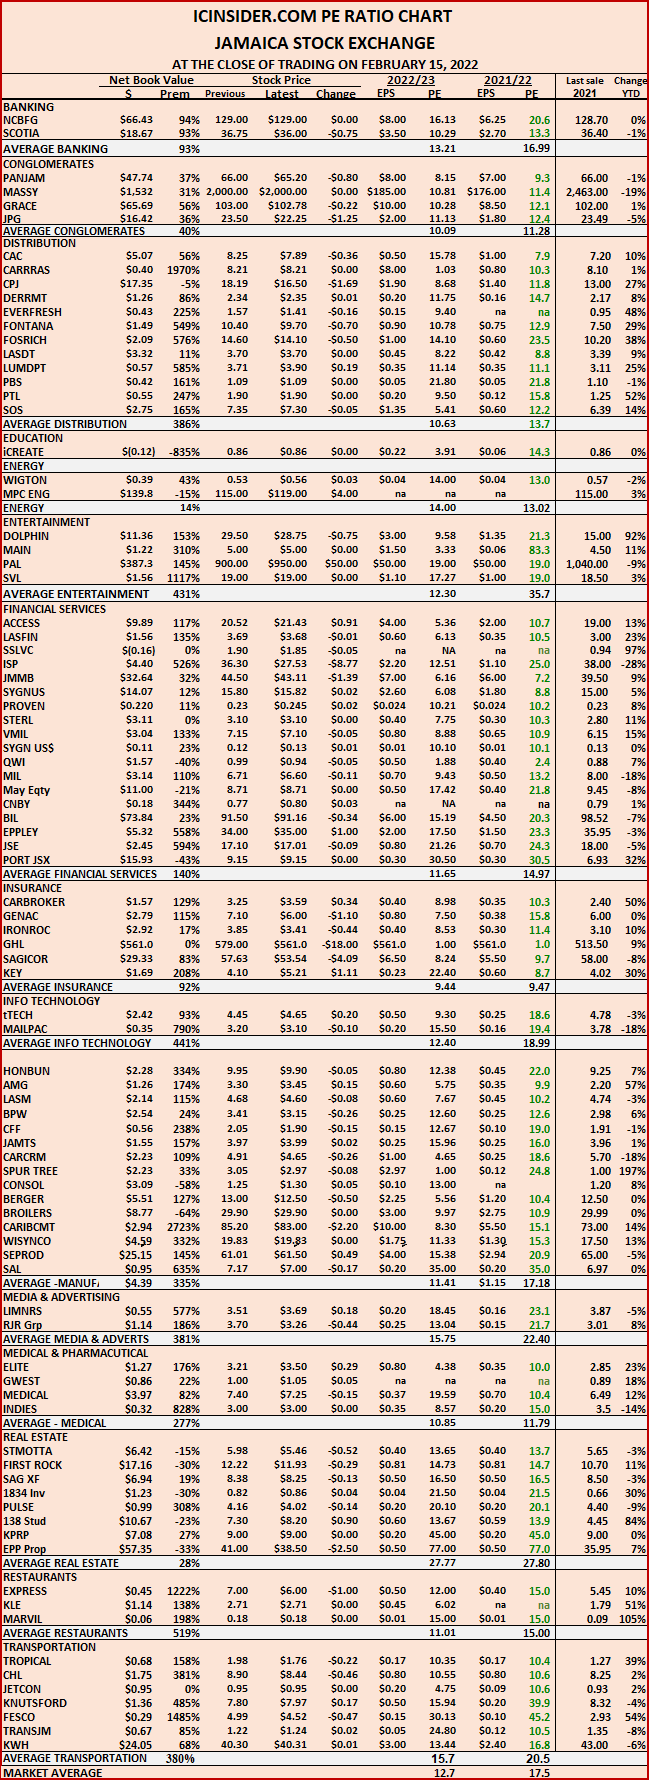
The market’s PE ratio ended at 17.7 based on 2021-22 earnings and 11.8 times those for 2022-23 at the close of market activity on the Jamaica Stock Exchange.
Investors need a series of measures and pertinent information to successfully navigate the many investment choices in the local stock market. The ICInsider.com PE ratio chart along with the more detailed daily report charts, provides investors with regularly updated information to help with decision making.
Investors should make use of the chart to help make rational investment decisions, by investing in stocks that are close to the average for the sector and not going too far from it, unless there are compelling reasons to do so. Investors who buy when the price of a stock is close to the average will find that they are not inclined to overpay for a stock. This approach helps to take emotions out of the investment decision and put in on fundamentals while at the same time not being too far from the majority of investors.
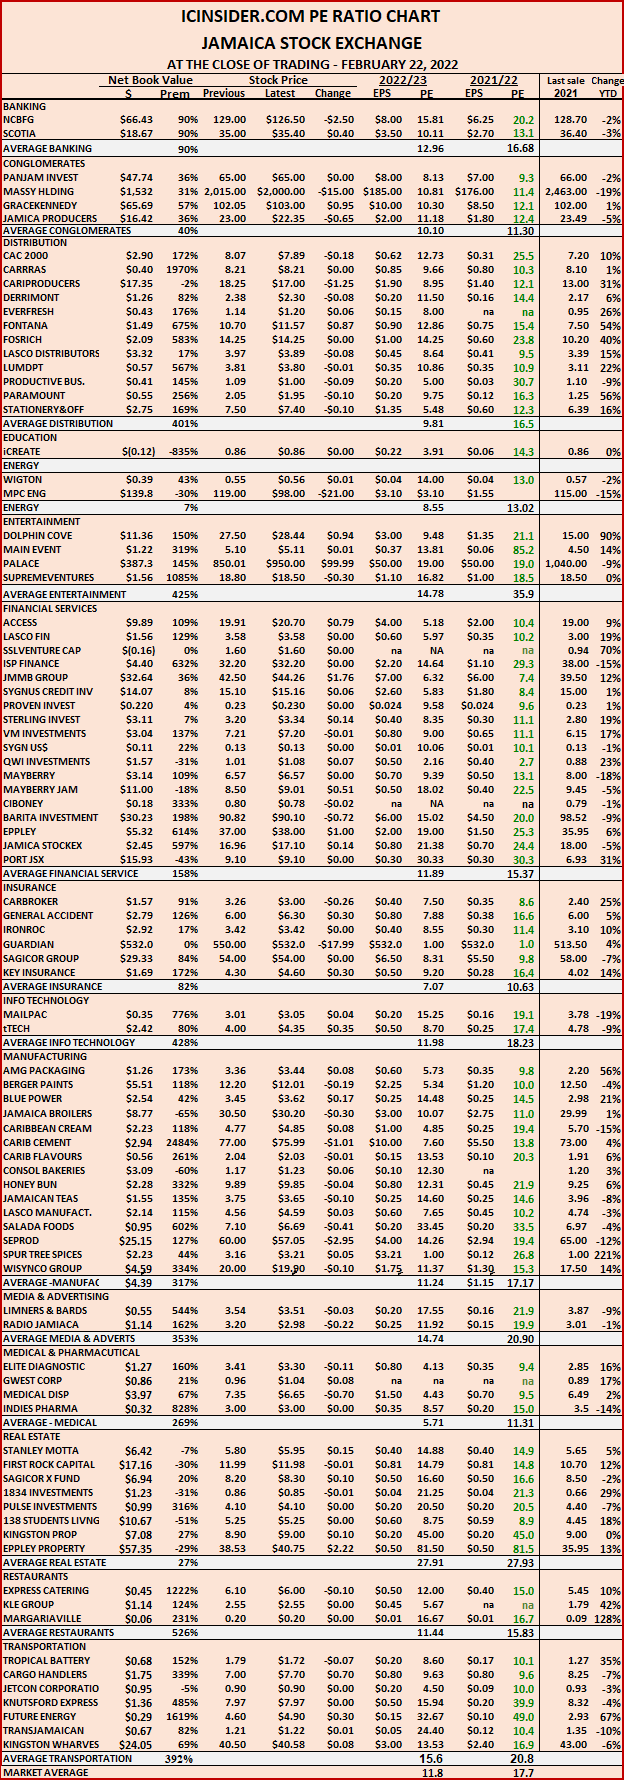 The ICInsider.com PE Ratio chart covers all ordinary shares listed on the Jamaica Stock Exchange and shows companies grouped on an industry basis, allowing for easy comparisons between same sector companies as well as the overall market.
The net asset value of each company is reported as a guide to easily assess the value of stocks based on this measure. The chart also shows daily changes in stock prices and the percentage year to date price movement based on the last traded prices. Dividends payable and yields for each company are shown in the Main and Junior Markets daily report charts that show closing volume for the bids and offers.
The EPS & PE ratios are based on 2021 and 2022 actual or projected earnings, excluding major one off items. The PE Ratio is the most popular measure used to determine the value of stocks.
Mixed trading for Jamaican stocks on Tuesday
Jamaican stocks closed mixed on Monday
Stocks closed mixed on the Jamaica Stock Exchange on Monday leaving the Combined Index with a rise of 340.71 points to end at 404,760.98, the All Jamaican Composite Index declined 1,542.16 points to end at 446,189.43, the Junior Market opened trading at 3,975 points up from Friday’s close of 3,874.34 and gained 51.94 points to close at 3,927 after paring back early morning gains to trade down to 3,904.27 points by 11 am and the JSE Main Index lost 124.48 points to end at 395,089.30.
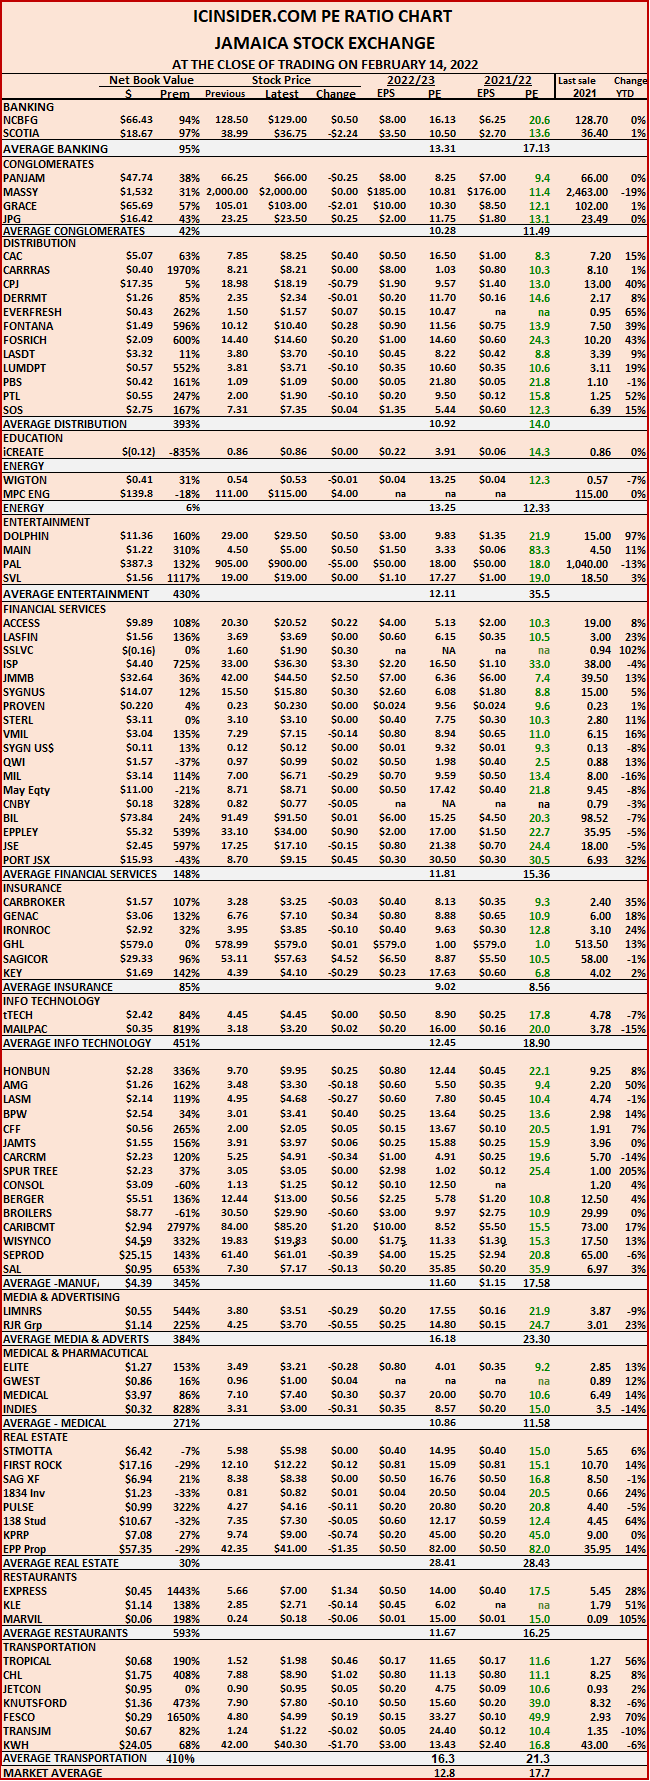
The market’s PE ratio ended at 17.6 based on 2021-22 earnings and 11.8 times those for 2022-23 at the close of market activity on the Jamaica Stock Exchange.
Investors need a series of measures and pertinent information to successfully navigate the many investment choices in the local stock market, the ICInsider.com PE ratio chart along with the more detailed daily report charts, provide investors with regularly updated information to help with decision making.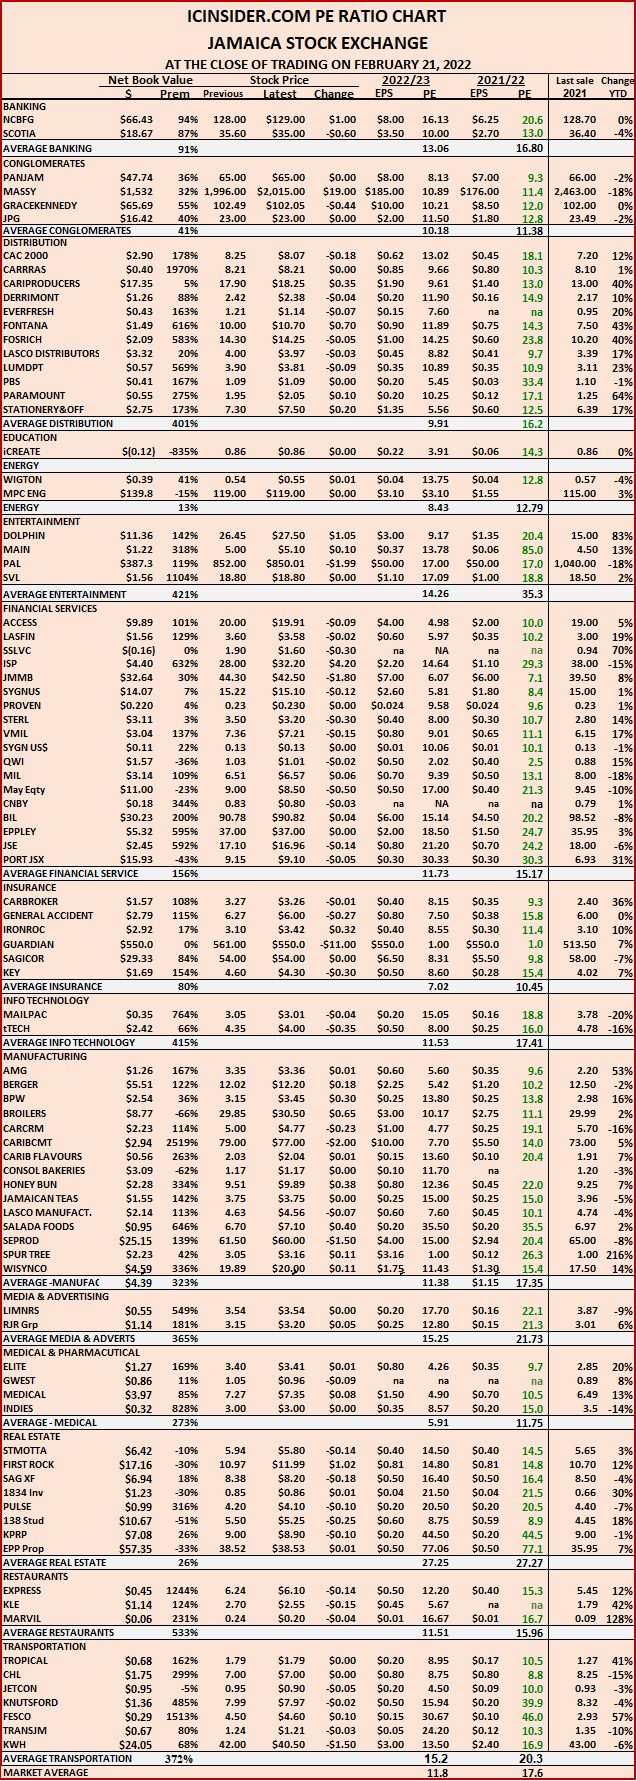
Investors should make use of the chart to help make rational investment decisions, by investing in stocks that are close to the average for the sector and not going too far from it unless there are compelling reasons to do so. Investors who buy when the price of a stock is close to the average will find that they are not inclined to overpay for a stock. This approach helps to take emotions out of the investment decision and at the same time not be too far from the majority of investors.
The ICInsider.com PE Ratio chart covers all ordinary shares listed on the Jamaica Stock Exchange and shows companies grouped on an industry basis, allowing for easy comparisons between same sector companies as well as the overall market. The net asset value of each company is reported as a guide to easily assess the value of stocks based on this measure.
The chart also shows daily changes in stock prices and the percentage year to date changes based on the last traded prices. Dividends payable and yields for each company are shown in the Main and Junior Markets daily report charts that also show closing volume for the bids and offers.
The EPS & PE ratios are based on 2021 and 2022 actual or projected earnings, excluding major one off items. The PE Ratio is the most popular measure used to determine the value of stocks.
Jamaican stocks bounce on Friday
Stocks rallied on the Jamaica Stock Exchange on Friday leaving the Combined Index with a gain of 1,646.44 points to end at 404,420.26, the All Jamaican Composite Index rose 1,052.94 points to 447,731.60, the Junior Market recovered 66.77 points of the 226 points lost over the previous three days in closing at 3,874.34 and the JSE Main Index picked up 1,370.17 points to end at 395,213.78.
The market’s PE ratio ended at 17.6 based on 2021-22 earnings and 12.3 times those for 2022-23 at the close of market activity on the Jamaica Stock Exchange.
Investors need a series of measures and pertinent information to successfully navigate the many investment choices in the local stock market, the ICInsider.com PE ratio chart along with the more detailed daily report charts, provide investors with regularly updated information to help with decision making.
Investors should make use of the chart to help make rational investment decisions, buy investing in stocks that are close to the average for the sector and not go too far from it unless there are compelling reasons to do so. Investments with prices of a stock are close to the average, will find that they are not inclined to overpay for a stock. This approach helps to take emotions out of the investment decision and put in of fundamentals at the same time not being too far from the majority of investors.
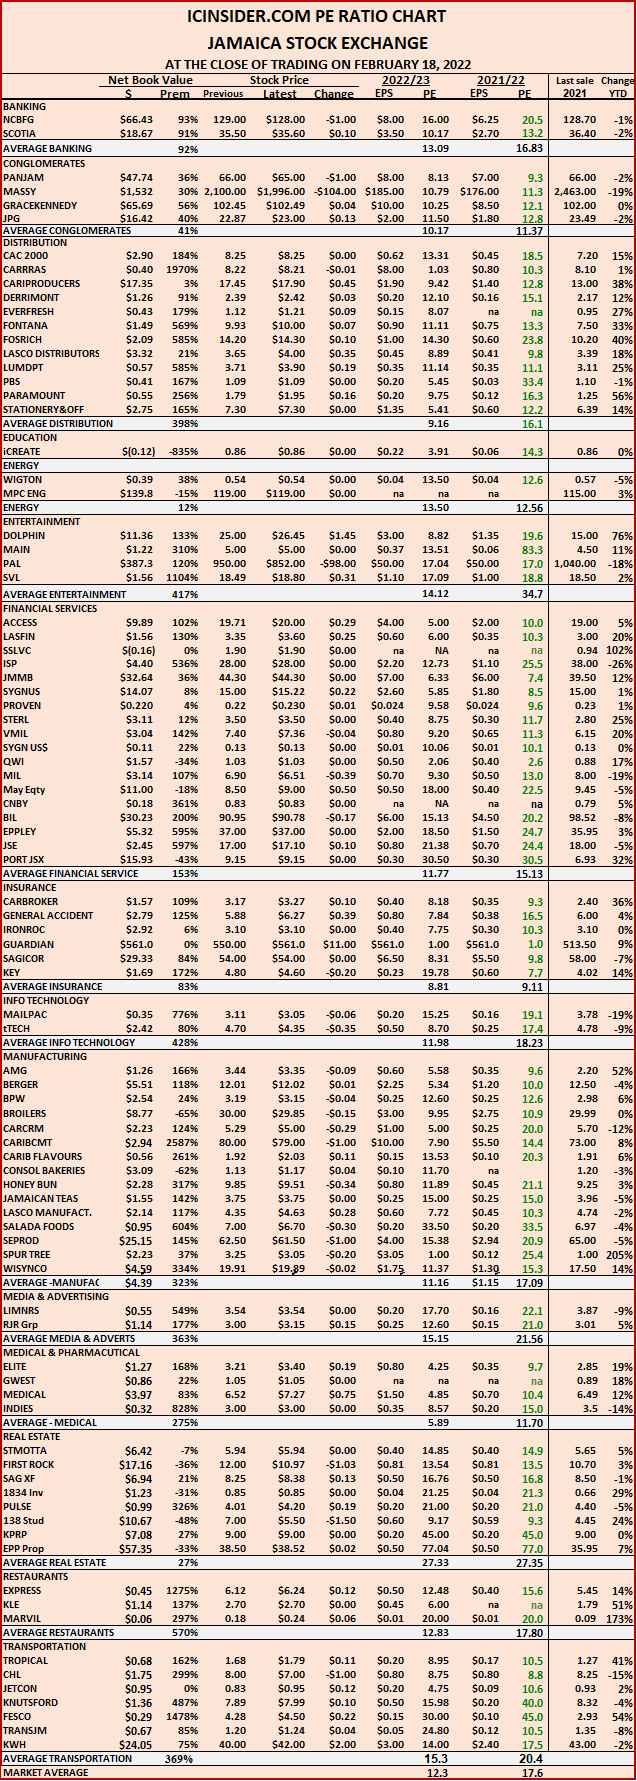 The ICInsider.com PE Ratio chart covers all ordinary shares listed on the Jamaica Stock Exchange and shows companies grouped on an industry basis, allowing for easy comparisons between same sector companies as well as the overall market. The net asset value of each company is reported as a guide to easily assess the value of stocks based on this measure.
The chart also shows daily changes in stock prices and the percentage year to date changes based on the last traded prices. Dividends payable and yields for each company are shown in the Main and Junior Markets daily report charts that also show closing volume for the bids and offers.
The EPS & PE ratios are based on 2021 and 2022 actual or projected earnings, excluding major one time income or expense. The PE Ratio is the most popular measure used to determine the value of stocks.
Big drop for JSE stocks again on Thursday
Stocks prices fell across the market, resulting in big declines at the close of trading on Thursday, in both the Main Market and the Junior Market as investors gather funds for the latest initial public offering to come to the market and opens on Monday coming.
The Jamaica Stock Exchange Combined Index skidded 6,194.03 points to end at 402,773.74 as the All Jamaican Composite Index fell 4,913.82 points to 446,678.54 and the Junior Market dropped 74.82 points following declines of 58.44 points on Wednesday and 92.56 points on Tuesday in closing at 3,833.15 and the JSE Main Index lost 5,907.44 points to 393,843.52.
The market’s PE ratio ended at 17.3 based on 2021-22 earnings and 12.3 times those for 2022-23 at the close of market activity on the Jamaica Stock Exchange.
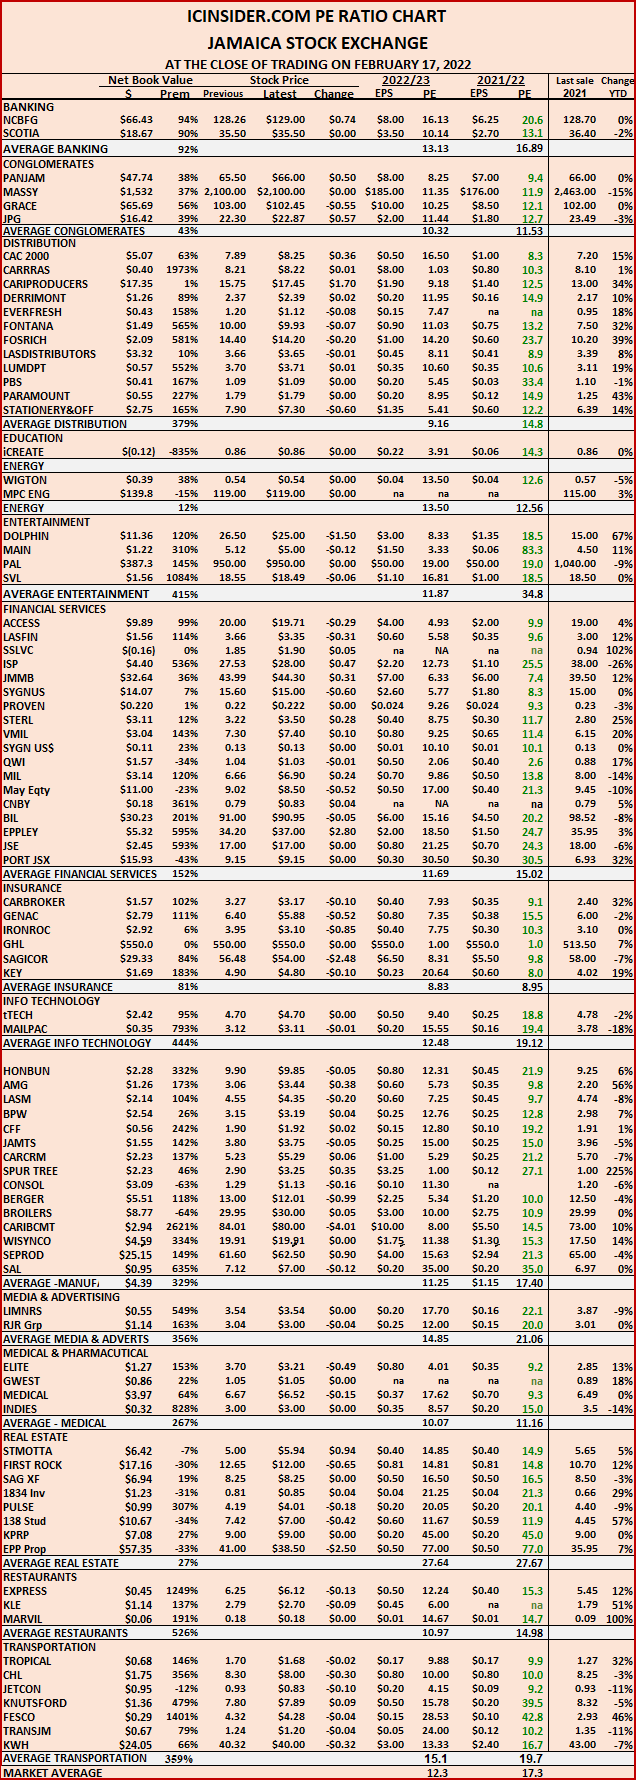 Investors need a series of measures and pertinent information to successfully navigate the many investment choices in the local stock market, the ICInsider.com PE ratio chart along with the more detailed daily report charts provide investors with daily updated information to help with decision making.
The ICInsider.com PE Ratio chart covers all ordinary shares listed on the Jamaica Stock Exchange and shows companies grouped on an industry basis, allowing for easy comparisons between same sector companies as well as the overall market. The net asset value of each company is reported as a guide to easily assess the value of stocks based on this measure.
The chart also shows daily changes in stock prices and the percentage year to date changes based on the last traded prices. Dividends payable and yields for each company are shown in the Main and Junior Markets daily report charts that also show closing volume for the bids and offers.
The EPS & PE ratios are based on 2021 and 2022 actual or projected earnings, excluding major one off items. The PE Ratio is the most popular measure used to determine the value of stocks.
JSE stocks lost more ground on Wednesday
Stocks slipped further in trading on Wednesday, with the Jamaica Stock Exchange Combined Index sliding 2,017.89 points to 408,967.77 as the Junior Market suffered 58.44 points fall following the 92.56 points drop on Tuesday, in settling well under the 4,000 points level at 3,907.98 and the JSE Main Index lost 1,604.51 points to close at 399,750.97.
The market’s PE ratio closed at 17.6 based on 2021/22 earnings and 12.6 times those for 2022/23, at the close of trading on the Jamaica Stock Exchange.
Investors need a series of measures and pertinent information to successfully navigate the many investment choices in the local stock market. ICInsider.com introduces a chart of all ordinary shares listed on the exchange that allows investors to see the values of stocks stacked against their immediate peers.
 The accompanying ICInsider.com PE chart covers all ordinary shares listed on the Jamaica Stock Exchange and shows companies grouped on an industry basis, allowing for easy comparisons between same sector companies as well as the overall market. The net asset value of each company is reported as a guide to easily assess the value of stocks based on this measure.
The EPS & PE ratios are based on 2021 and 2022 actual or projected earnings, excluding major one-time income or expenses. The PE Ratio is the most popular measure used to determine the value of stocks.
The chart also shows daily changes in stock prices and the percentage year to date changes based on the last traded prices. Dividends payable and yields for each company are shown in the Main and Junior Markets daily report charts that also show closing volume for the bids and offers.
Jamaica stocks lost ground on Tuesday
Stocks slipped in trading on Tuesday with the Jamaica Stock Exchange Combined Index skidding 521.04 points to close at 410,985.67 points as the Junior Market suffered a 92.56 points fall of 2.33 percent.
The market’s PE ratio slipped to 17.5 based on 2021/22 earnings and 12.7 times those for 2022/23 at the close of trading on the Jamaica Stock Exchange.
Investors need a series of measures and pertinent information to successfully navigate the many investment choices in the local stock market. ICInsider.com introduces a chart of all ordinary shares listed on the exchange that allows investors to see the values of stocks stacked against their immediate peers.
The accompanying ICInsider.com PE chart covers all ordinary shares listed on the Jamaica Stock Exchange and shows companies grouped on an industry basis, allowing for easy comparisons between same sector companies as well as the overall market. The net asset value of each company is reported as a guide to easily assess the value of stocks based on this measure.
 The EPS & PE ratios are based on 2021 and 2022 actual or projected earnings, excluding major one time income or expense. The PE Ratio is the most popular measure used to determine the value of stocks for a formula for computing appropriate stock values, averages 17.
The chart also shows daily changes in stock prices and the percentage year to date changes based on the last traded prices. Dividends payable and yields for each company are shown in the Main and Junior Markets daily report charts that also show the closing volume for the bids and offers.
A brand new ICInsider chart
Stocks made more gains in trading on Monday and reflected in a strong increase in the Jamaica Stock Exchange Combined Index that climbed 1214.35 points to close at 411,506.70, the market’s PE ratio rising to 17.7 based on 2021-22 earnings and 12.8 times those for 2022-23 at the close of trading on the Jamaica Stock Exchange.
Investors need a series of measures and pertinent information to successfully navigate the many investment choices in the local stock market. ICInsider.com introduces a chart of all ordinary shares listed on the exchange that allows investors to see the values of stocks stacked against their immediate peers.
The accompanying ICInsider.com PE Ratio chart covers all ordinary shares listed on the Jamaica Stock Exchange and shows companies grouped on an industry basis, allowing for easy comparisons between same sector companies as well as the overall market. The net asset value of each company is reported as a guide to easily assess the value of stocks based on this measure.
 The EPS & PE ratios are based on 2021 and 2022 actual or projected earnings, excluding major one time income or expense. The PE Ratio is the most popular measure used to determine the value of stocks.
The chart also shows daily changes in stock prices and the percentage year to date changes based on the last traded prices. Dividends payable and yields for each company are shown in the Main and Junior Markets daily report charts that also show the closing volume for the bids and offers.
Juniors recover from covid Main Market suffering
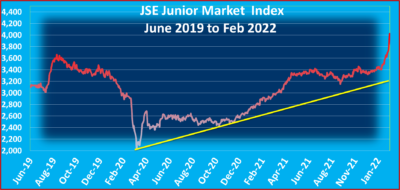
On Monday 24 of January, the Junior Market index reached to 3,700 mark for the first time and went on to record seven consecutive days of record closing highs, with the close on the 27 at 3,669.73 and peaking for that week at 3,717.45 on Friday, January 28, by Friday last week, the market which hit an intraday record high of 4,051.04 ended at a new closing high of 3,985.87 to be up 16.3 percent for the year to date and up just 37 percent from the pre-pandemic crash and 96 percent from the low in March 2020.
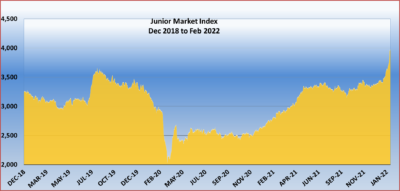 On the surface, the Junior Market has had a full recovery from the 2020 Covid-19 induced collapse that saw the index collapsing from 2,900 points at the end of February to 2,534 points on March 6 and bottoming out at 2,031.79 points on March 18 for a plunge of 39 percent from the start of 2020, and much more after peaking at 3,662 points in mid-August 2019.
A closer look at the market indicates there are elements of the market that are not back, with many stocks still trading below their pre-covid-19 levels. This group includes Access Financial that was at $32.94, just before the collapse, and is now at $25, Blue Power at $4.52 then and is now at $3.20, CAC2000 ordinary share then at $12.50, now $8.25, Consolidated Bakeries at $1.79, and now trading at $1.05, Jetcon Corporation at a $1.31, currently 94 cents, Knutsford Express at $11 in 2020, presently at $8, Main Event at $5.79 and now trades at $4 and Stationery and Office Supplies $8.86 it last traded at to be $6.
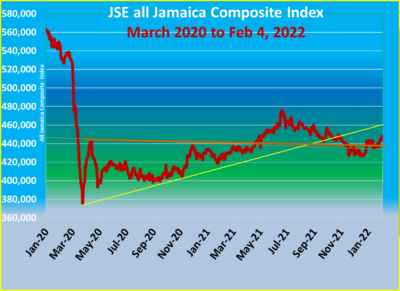 While the Junior Market has made great strides since hitting the 2020 low, the same is not the case for the heavily financially weighted Main Market that continues to be mired in depression following the initial sharp fall in March 2020 when the market fell precipitously to 375,091.09 points on the All Jamaican Composite Index from 529,722.22 at the end of February, for a 29.2 percent decline. As o Friday last the market is only up 20 percent from the March 2020 market bottom and 15 percent below the end of February 2020 level, and still well below the all-time high of 584,697.71 it closed on August 8, 2019. The major reason for the prolonged decline is primarily due to falling in stocks such as a Jamaica Stock Exchange, Kingston Wharves, NCB Financial, PanJam Investment, Proven Investments, Palace Amusement, Sagicor Group, Sagicor Select Funds, Scotia Group, Supreme Ventures, Sygnus Credit Investments, Wighton Windfarm. Strong gains in Barita Investments, Grace Kennedy, Caribbean Cement, Caribbean Producers, Salada Foods, Seprod and Radio Jamaica could not negate the effect of the big decliners.
Junior Market cracks 4,000 mark
The Jamaica Stock Exchange Junior Market index traded over 4,000 points for the first time in its history.
Junior Market breaks the 4,000 mark at the opening of trading of the market on Thursday in putting on 92.34 points to 4,041.54 seconds after the open.
The market that ad five consecutive days of record close was breaking into the 4,000 level for the first time and is up just under 18 percent since the start of the year. With just over 30 minutes of trading, the Junior Market is at 4,025.25.
At the same time, the JSE All Jamaican Composite Index is up to 445,861.22 from 443,955.09 at the close on Wednesday as it continues to slowly move forward from a support base of 430,000 points.
Trading in two recent high flyers Dolphin Cove and Caribbean Producers have been halted as the prices fell sharply from $28.50 to $21.96 and from $20 to $16 respectively. Express Catering stock is also frozen at $7.20 from $6.25 on Wednesday.
New record high for Junior Market
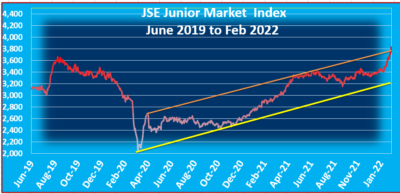 The JSE Junior Market is trading at yet another record high in Tuesday market activity with the market index putting on 82.83 points to 3,833.09 after 90 minutes of trading. The market has broken out from the area of resistance that pinned it in the 3,400 level from May last year and finally broke loose in the middle of January.
If the market holds at these levels it would represent a break from the channel that goes back to March of 2020 and place it on track for more gains and higher levels for the market.
In Tuesday’s trading Caribbean Producers rose to $24.50, Dolphin Cove moved up to a record $29.94, Fontana climbed to a record $10.50.
In the Main Market, Caribbean Producers rose to $24.35 as that market All Jamaican Composite Index is at 447,4388.57, up from 445,492.59 on Monday.


