The Combined Market Index dropped 1,594.00 points to close at 353,085.72, the JSE Main Index fell 1,596.95 points to 340,153.88 while the All Jamaica Composite Index was marked down by 2,262.98 points to 387,082.72, the Junior Market dipped 11.28 points to 3,897.28 and the JSE US dollar market slipped 3.54 points to 226.24.
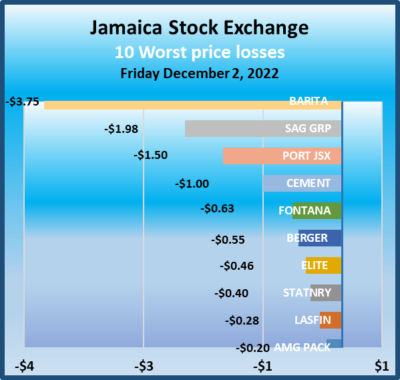 Trading ended with 10,797,661 shares changing hands, for a mere $88.01 million, versus $112.64 million, with 12,068,945 shares traded in all markets on the previous day. The JSE USD market ended with the value of stocks traded amounting to US$1,037 from US$20,685 on Thursday.
The market’s PE ratio ended at 22.9 based on 2021-22 earnings and 12.8 times those for 2022-23 at the close of trading.
Investors need pertinent information to successfully navigate many investment options in the local stock market. The ICInsider.com PE ratio chart and the more detailed daily report charts provide investors with regularly updated information to help decision-making.
Investors should use the chart to help make rational investment decisions by investing in stocks close to the average for the sector and not going too far from it unless there are compelling reasons to do so. 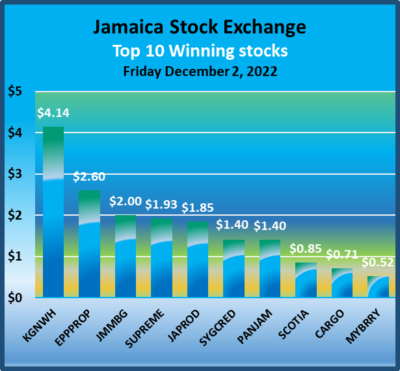 This approach helps to remove emotions from investment decisions and put in on fundamentals while at the same time not being too far from the majority of investors. Investors who buy when the price of a stock is close to the average will find that they are not inclined to overpay for a stock.
The ICInsider.com PE Ratio chart covers all ordinary shares on the Jamaica Stock Exchange. It shows companies grouped on an industry basis, allowing easy comparisons between the same sector companies and the overall market.
The net asset value of each company is reported as a guide to assess the value of stocks based on this measure quickly. The chart also shows daily changes in stock prices and the percentage year to date price movement based on the last traded prices. Dividends payable and yields for each company are shown in the  Main and Junior Markets’ daily report charts that show the closing volume for the bids and offers.
The EPS & PE ratios are based on 2021 and 2022 actual or projected earnings, excluding major one off items. The PE Ratio is the most popular measure used to determine the value of stocks.
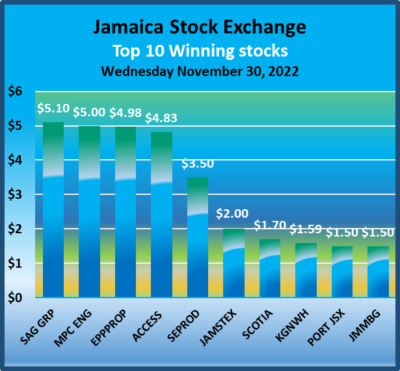 The JSE Main Index climbed 6,416.85 points to 338,794.51 while the All Jamaica Composite Index jumped 8,544.44 points to end at 384,847.77, the Junior Market leapt 86.79 points to 3,978.95 and the JSE US dollar market popped 5.92 points to 228.05.
 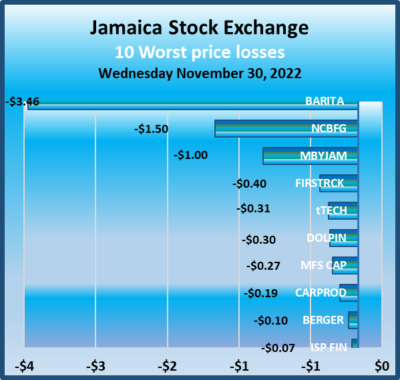 The ICInsider.com PE ratio chart and the more detailed daily report charts provide investors with regularly updated information to help decision-making.
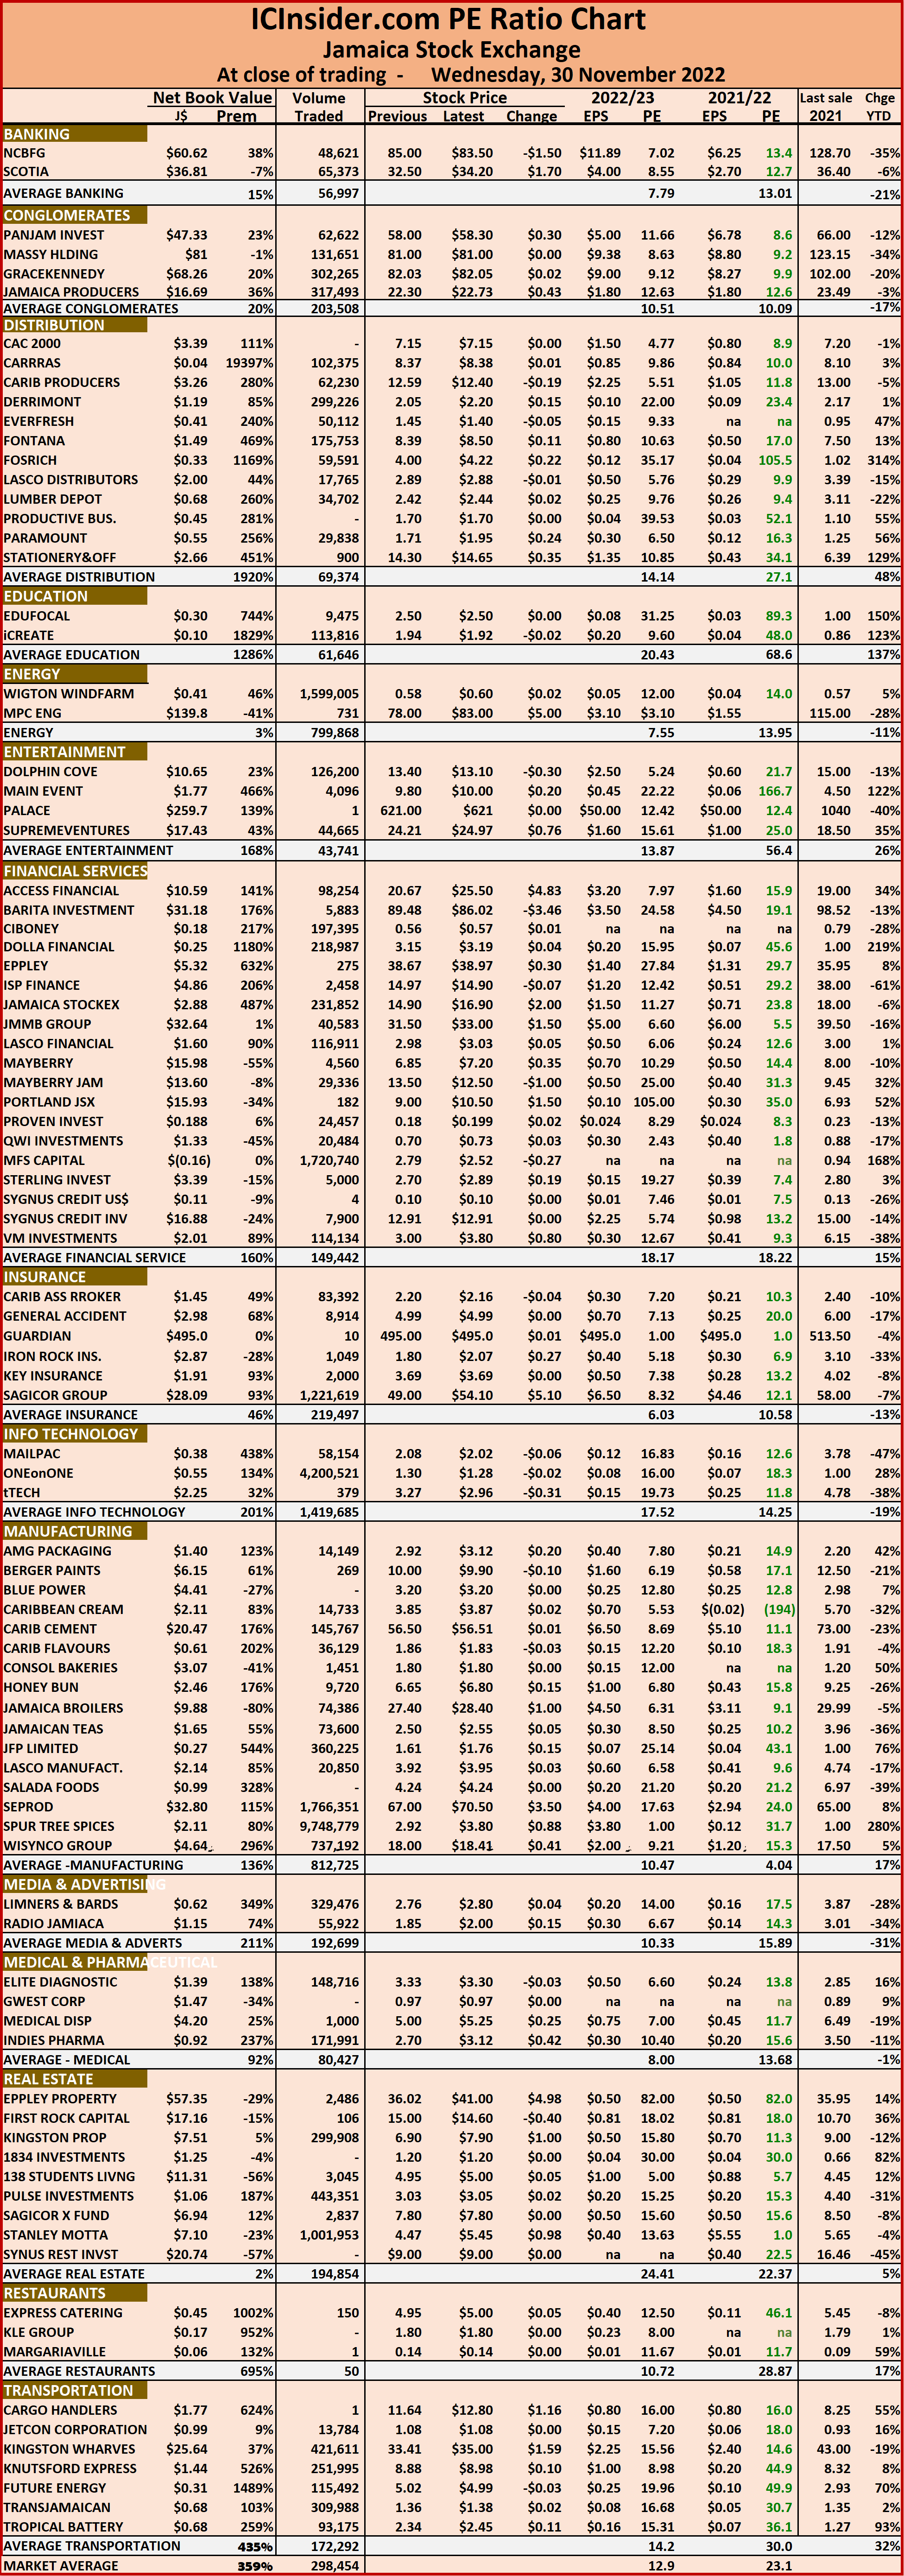 The chart also shows daily changes in stock prices and the percentage year to date price movement based on the last traded prices. Dividends payable and yields for each company are shown in the Main and Junior Markets’ daily report charts that show the closing volume for the bids and offers.
 The JSE Main Index dived 4,914.99 points to 332,377.66 while the All Jamaica Composite Index plunged 6,421.71 points to 376,303.33, the Junior Market jumped 40.33 points to 3,892.15 and the JSE US dollar market slipped 1.78 points to 222.13.
 Investors should use the chart to help make rational investment decisions by investing in stocks close to the average for the sector and not going too far from it unless there are compelling reasons to do so. This approach helps to remove emotions from investment decisions and put in on fundamentals while at the same time not being too far from the majority of investors. Investors who buy when the price of a stock is close to the average will find that they are not inclined to overpay for a stock.
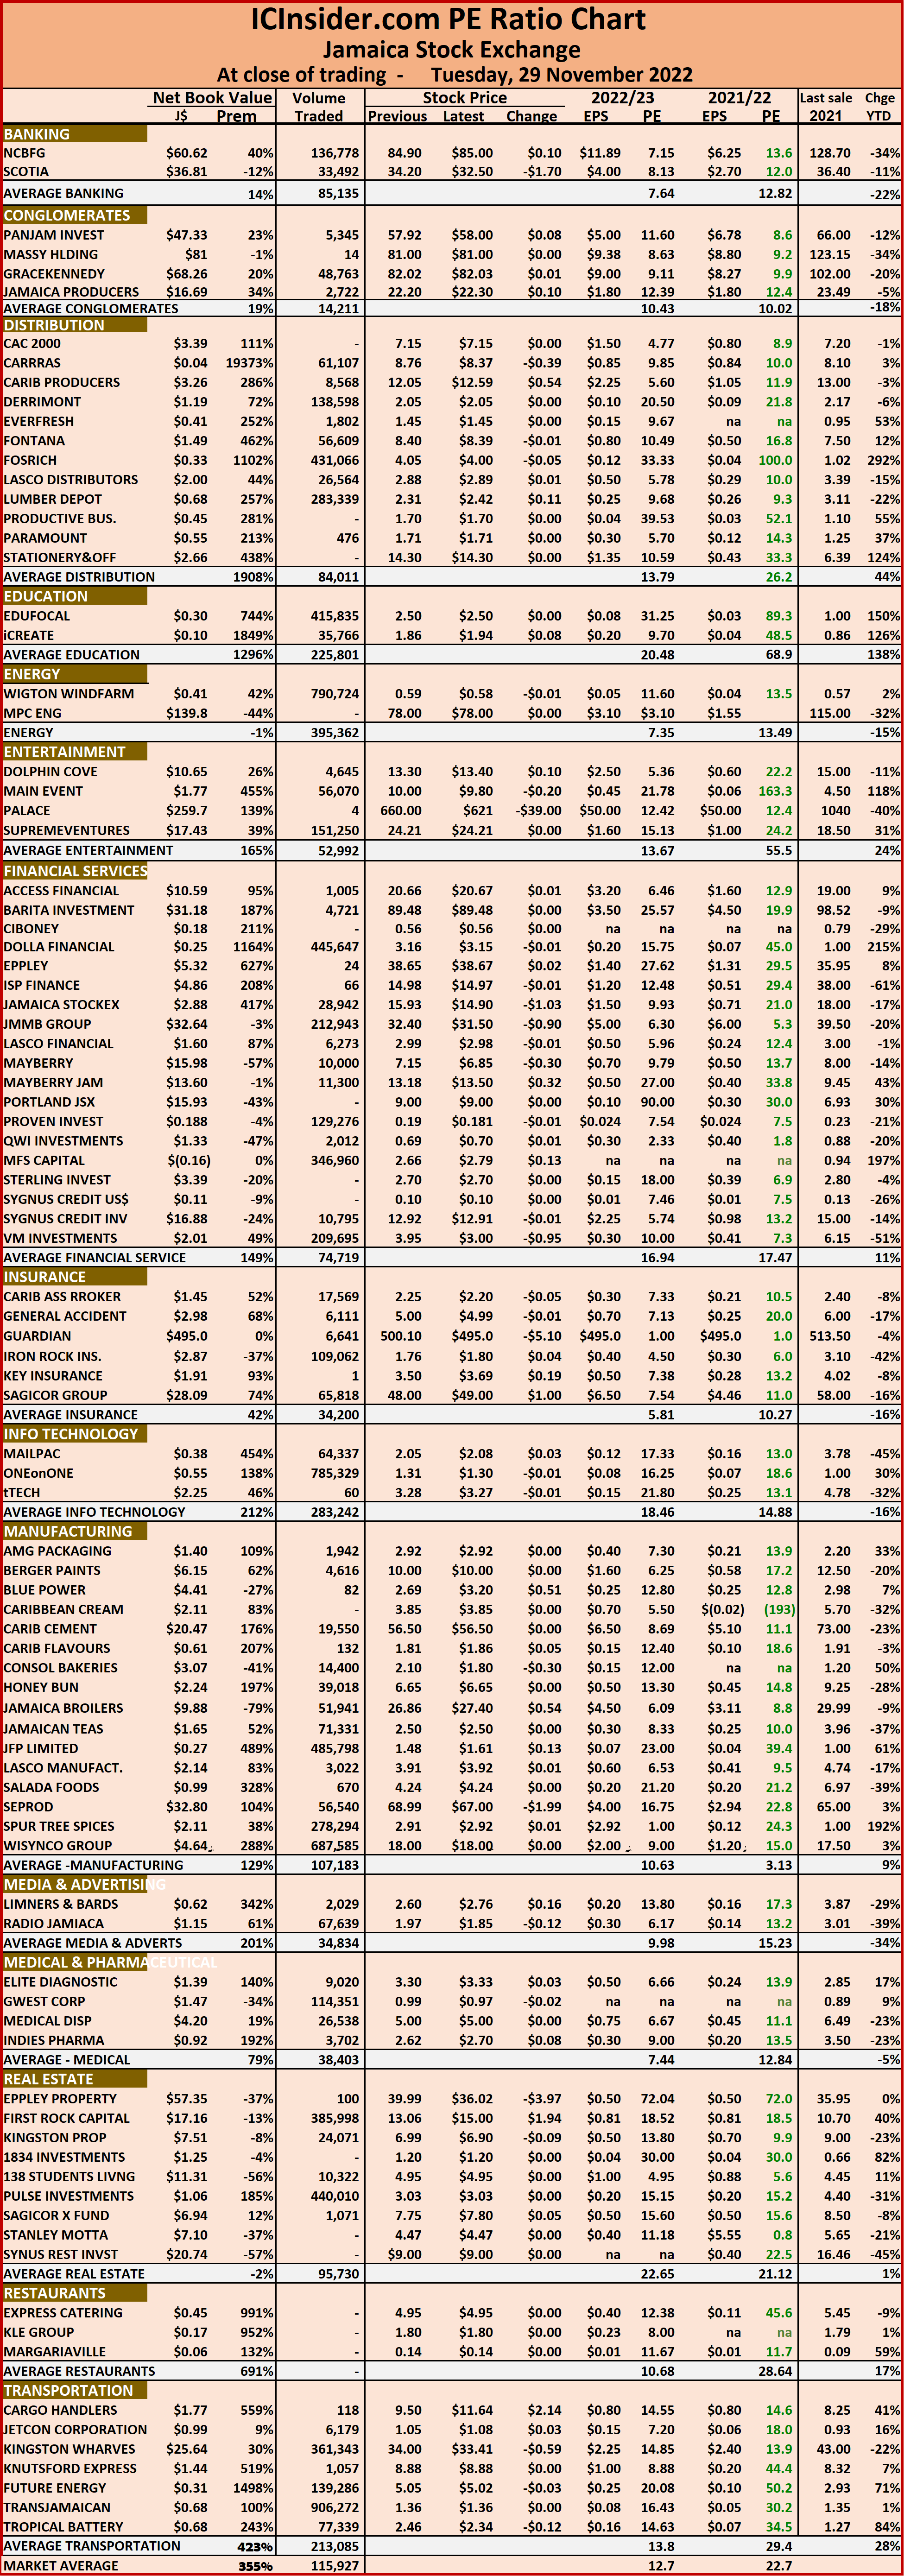 The EPS & PE ratios are based on 2021 and 2022 actual or projected earnings, excluding major one off items. The PE Ratio is the most popular measure used to determine the value of stocks.
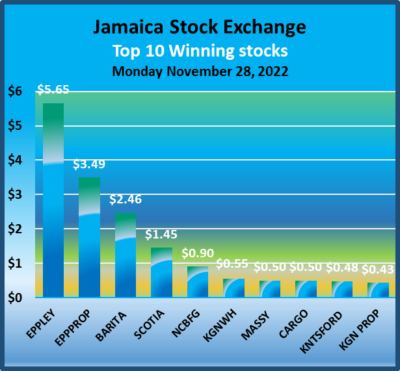 At the close, the Combined Market Index fell 884.22 points to 350.000.81. The JSE Main Index slipped 767.79 points to 337,292.65 while the All Jamaica Composite Index climbed 1,072.13 points to close at 382,7251.04, the Junior Market Index dipped 18.43 points to 3,851.82 and the JSE US dollar market shed 0.15 points to end at 223.91.
 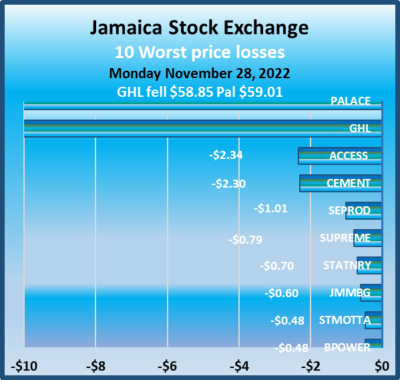 The market’s PE ratio ended at 22.7 based on 2021-22 earnings and 12.7 times those for 2022-23 at the close of trading.
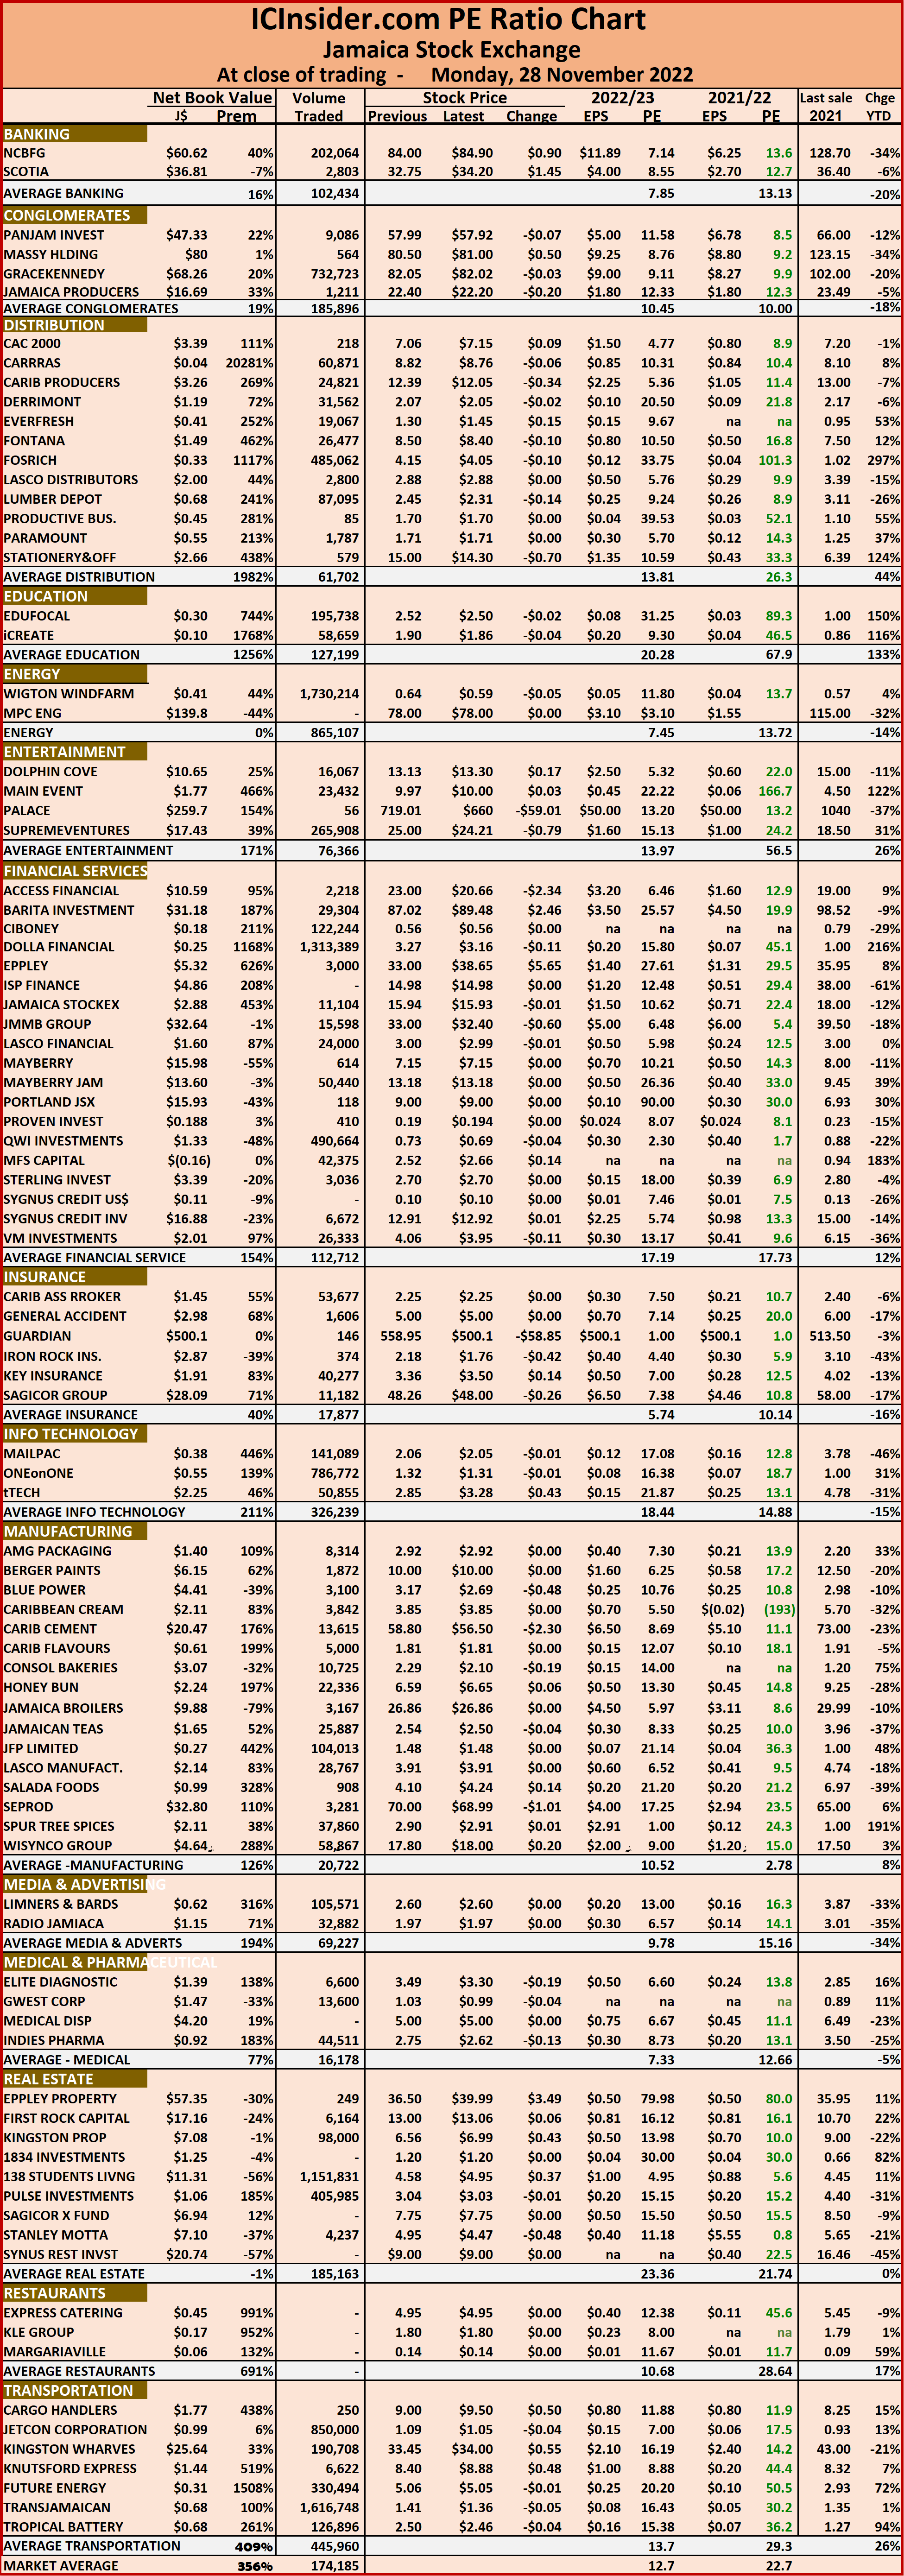 The net asset value of each company is reported as a guide to assess the value of stocks based on this measure quickly. The chart also shows daily changes in stock prices and the percentage year to date price movement based on the last traded prices. Dividends payable and yields for each company are shown in the Main and Junior Markets’ daily report charts that show the closing volume for the bids and offers.
 At the close, the Combined Market Index put on 1,779.21 points to 350,885.04. The JSE Main Index popped 1,999.87 points to 338,060.45 while the All Jamaica Composite Index climbed 1,783.90 points to close at 381,652.90, the Junior Market dipped 9.82 points to 3,870.24 and the JSE US dollar market shed 5.38 points to end at 224.06.
 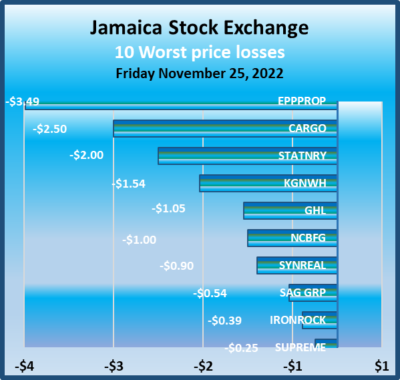 The ICInsider.com PE ratio chart and the more detailed daily report charts provide investors with regularly updated information to help decision-making.
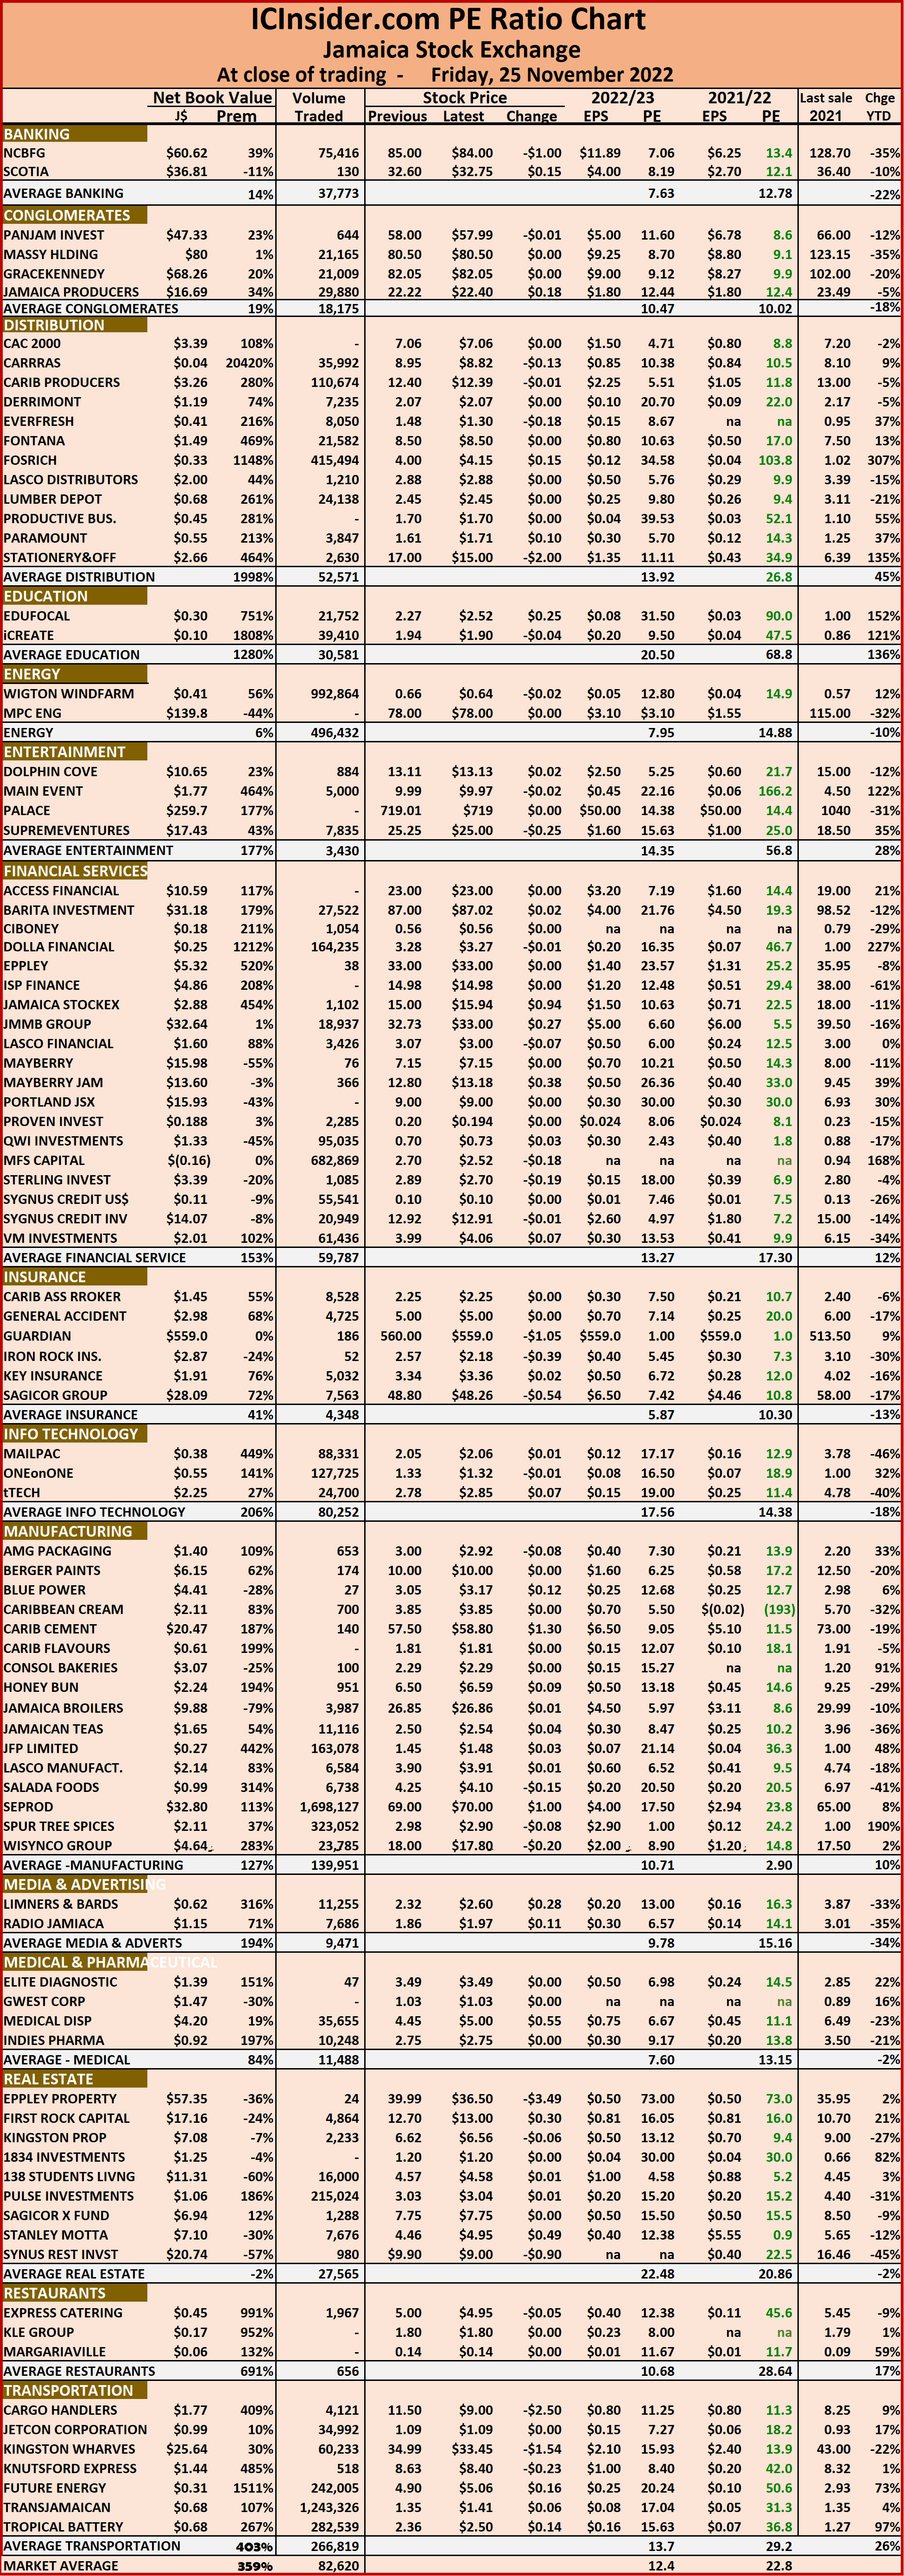 The chart also shows daily changes in stock prices and the percentage year to date price movement based on the last traded prices. Dividends payable and yields for each company are shown in the Main and Junior Markets’ daily report charts that show the closing volume for the bids and offers.
 At the close, the Combined Market Index put on 1,145.41 points to 349,105.82 as trading activities continue to remain at depressed levels. The JSE Main Index popped 428.14 points to 336,060.58, while the All Jamaica Composite Index fell 1,154.03 points to close at 379,869.00 and the JSE US dollar market gained 4.33 points to end at 229.44.
 The ICInsider.com PE ratio chart and the more detailed daily report charts provide investors with regularly updated information to help decision-making.
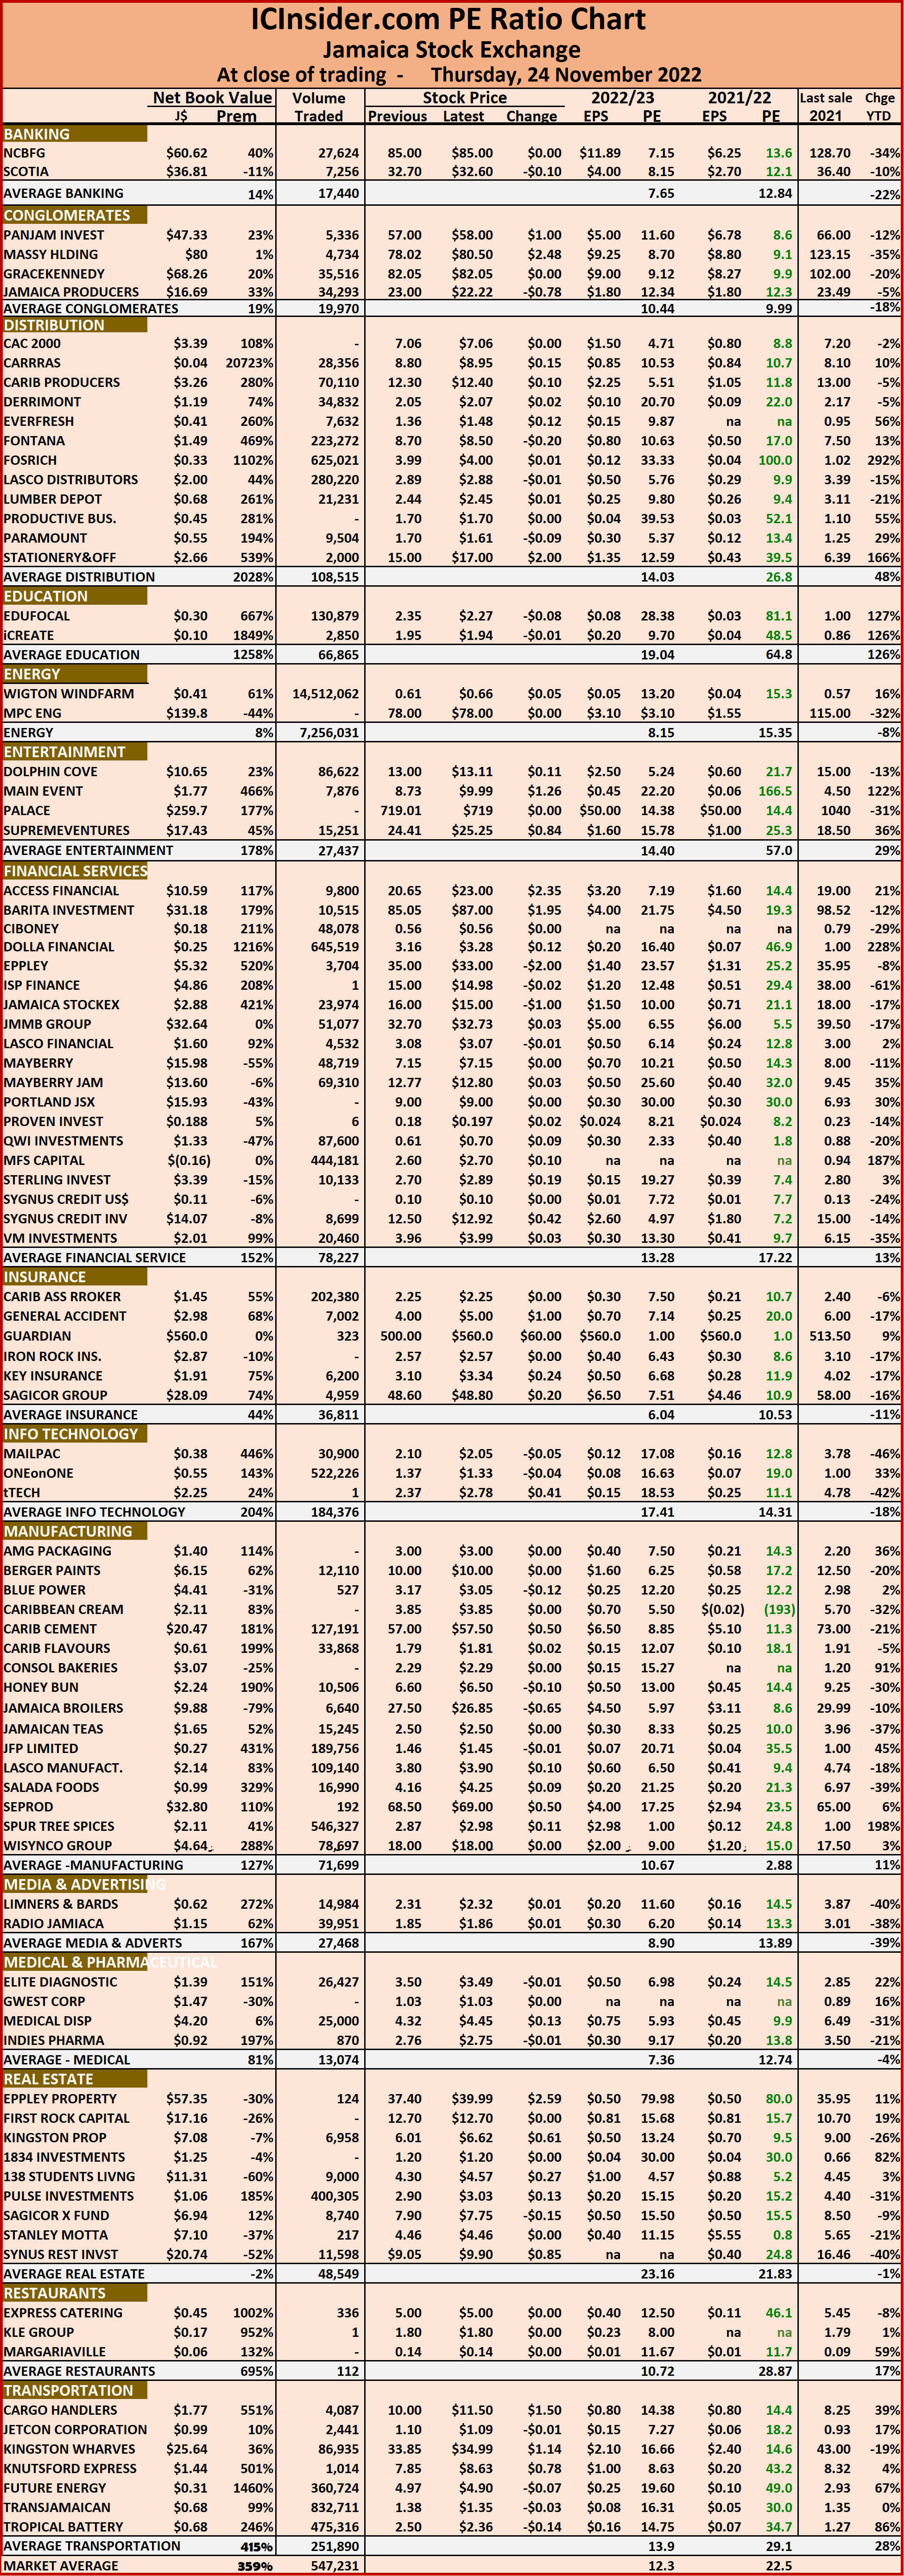 The chart also shows daily changes in stock prices and the percentage year to date price movement based on the last traded prices. Dividends payable and yields for each company are shown in the Main and Junior Markets’ daily report charts that show the closing volume for the bids and offers.
 At the end of trading, the JSE Main Index lost 2,865.97 points to end at 335,632.44, the Junior Market Index d1pped 21.45 points to 3,797.82 while the All Jamaica Composite Index added 909.90 points to close at 381,023.03 and the JSE US dollar market popped 0.35 points to end at 225.11.
 The ICInsider.com PE ratio chart and the more detailed daily report charts provide investors with regularly updated information to help decision-making.
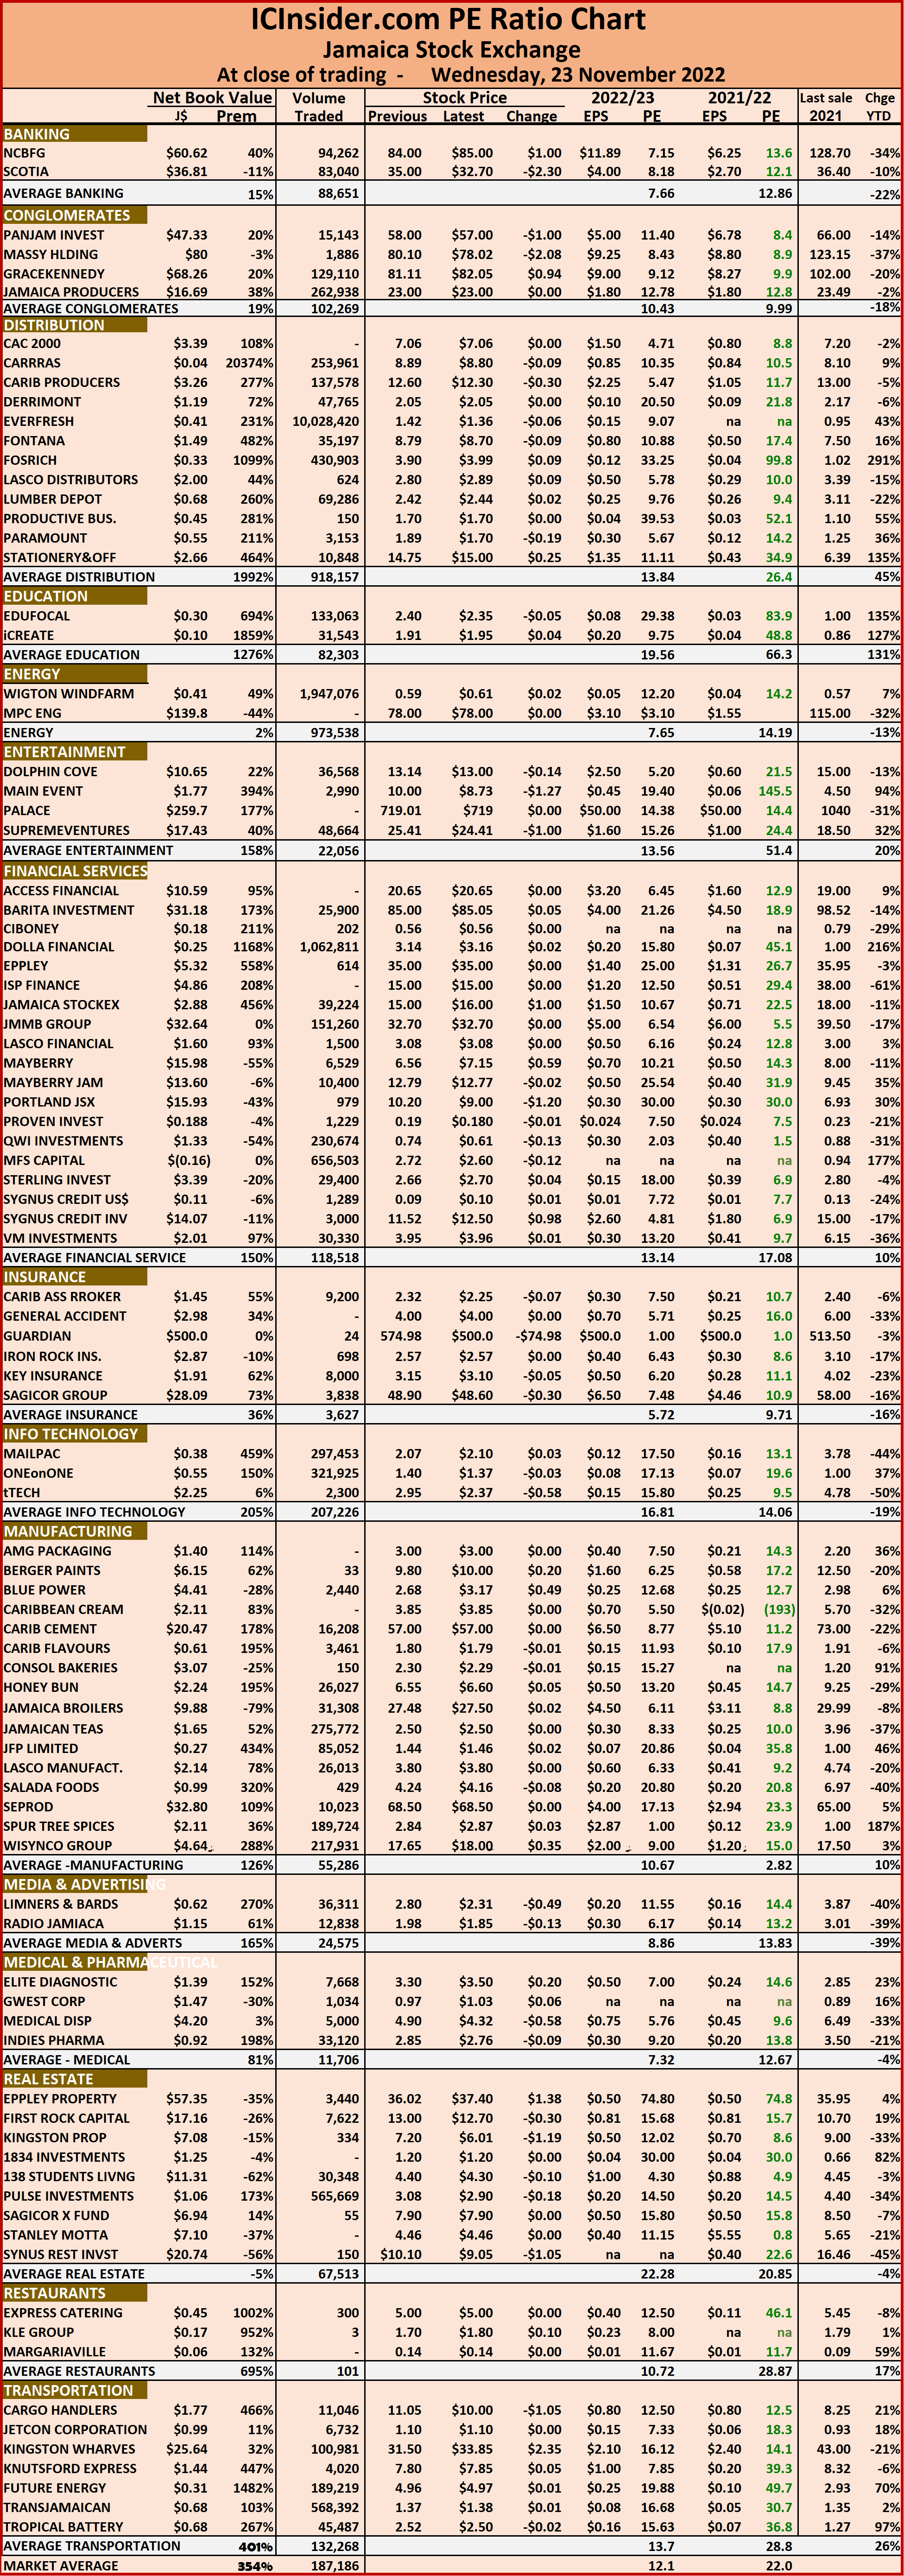 The chart also shows daily changes in stock prices and the percentage year to date price movement based on the last traded prices. Dividends payable and yields for each company are shown in the Main and Junior Markets’ daily report charts that show the closing volume for the bids and offers.
 At the end of trading the Combined Market Index rose 450.03 points to 350,832.08, the JSE Main Index popped 589.70 points at 338,498.41, the Junior Market Index dipped 11.12 points to 3,819.27 while the All Jamaica Composite Index added 792.81 points to close at 380,113.13 and the JSE US dollar market slipped 4.13 points to end at 224.76.
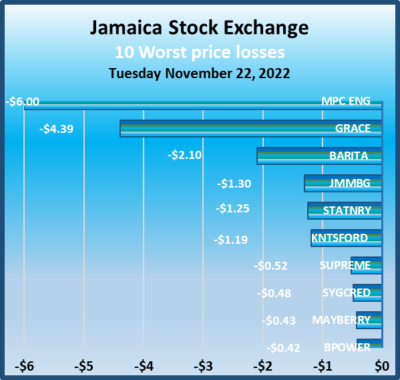 The ICInsider.com PE ratio chart and the more detailed daily report charts provide investors with regularly updated information to help decision-making.
 The chart also shows daily changes in stock prices and the percentage year to date price movement based on the last traded prices. Dividends payable and yields for each company are shown in the Main and Junior Markets’ daily report charts that show the closing volume for the bids and offers.
 The gains in the above two companies pushed the Main Market higher, at the same time that investors pushed the Junior Market down for another day, but the JSE US dollar market rose modestly at the close.
 The market’s PE ratio ended at 22.6 based on 2021-22 earnings and 12.4 times those for 2022-23 at the close of trading.
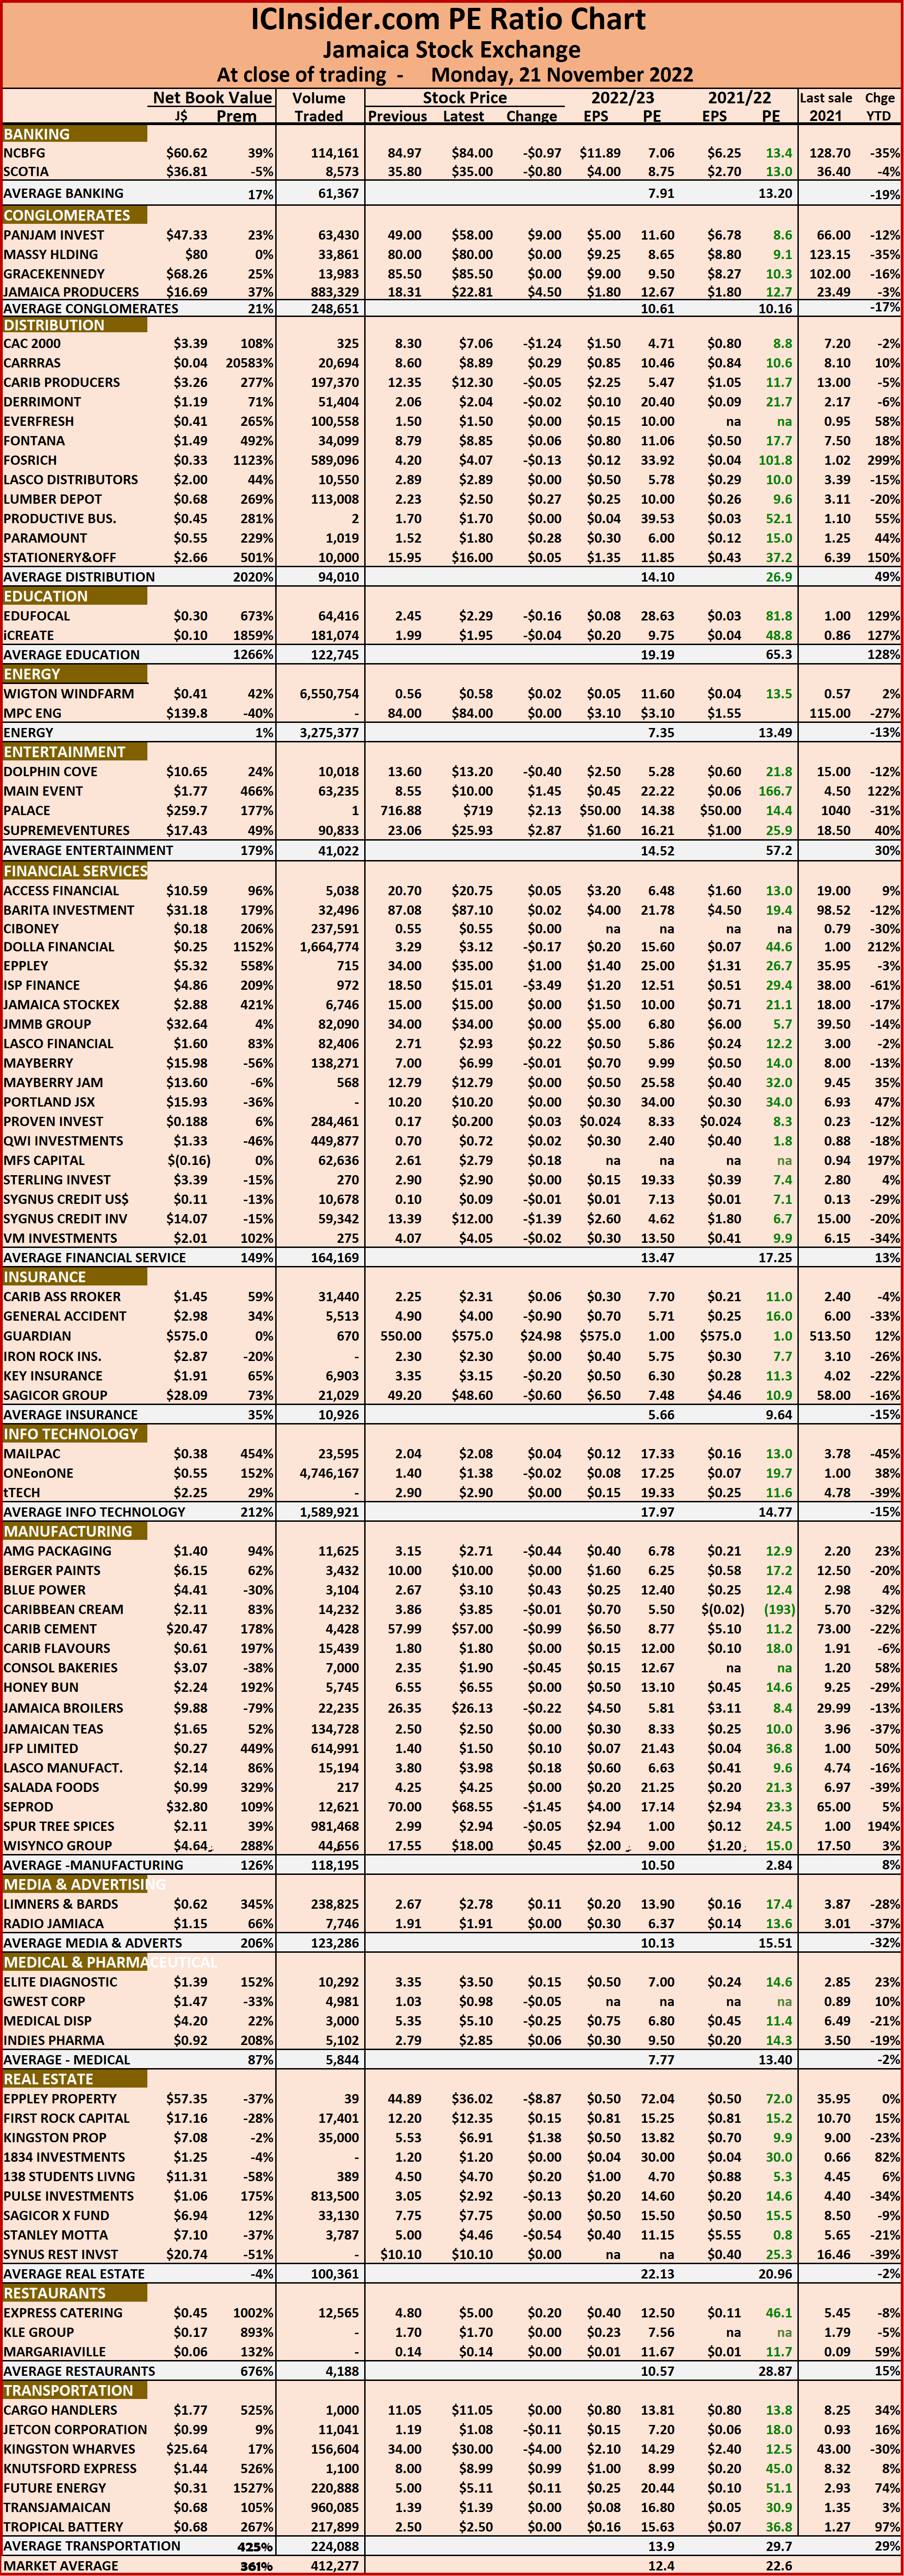 The net asset value of each company is reported as a guide to assess the value of stocks based on this measure quickly. The chart also shows daily changes in stock prices and the percentage year to date price movement based on the last traded prices. Dividends payable and yields for each company are shown in the Main and Junior Markets’ daily report charts that show the closing volume for the bids and offers.
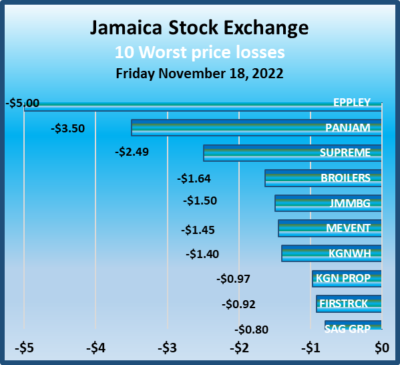 At the close, the JSE Main Index dropped 3,408.56 points in closing at 335,377.18, the Junior Market Index dropped 61.65 points to 3,871.96 while the All Jamaica Composite Index shed 2,975.20 points to 380,361.84 and the JSE US dollar market surged 29.58 points to end at 227.27.
 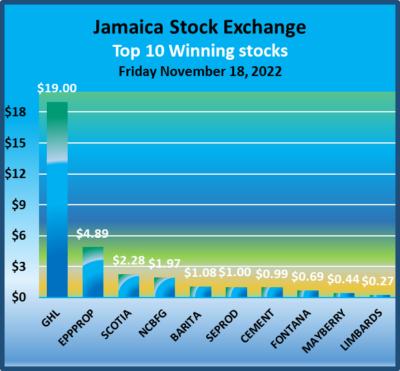 Investors should use the chart to help make rational investment decisions by investing in stocks close to the average for the sector and not going too far from it unless there are compelling reasons to do so. This approach helps to remove emotions from investment decisions and put in on fundamentals while at the same time not being too far from the majority of investors. Investors who buy when the price of a stock is close to the average will find that they are not inclined to overpay for a stock.
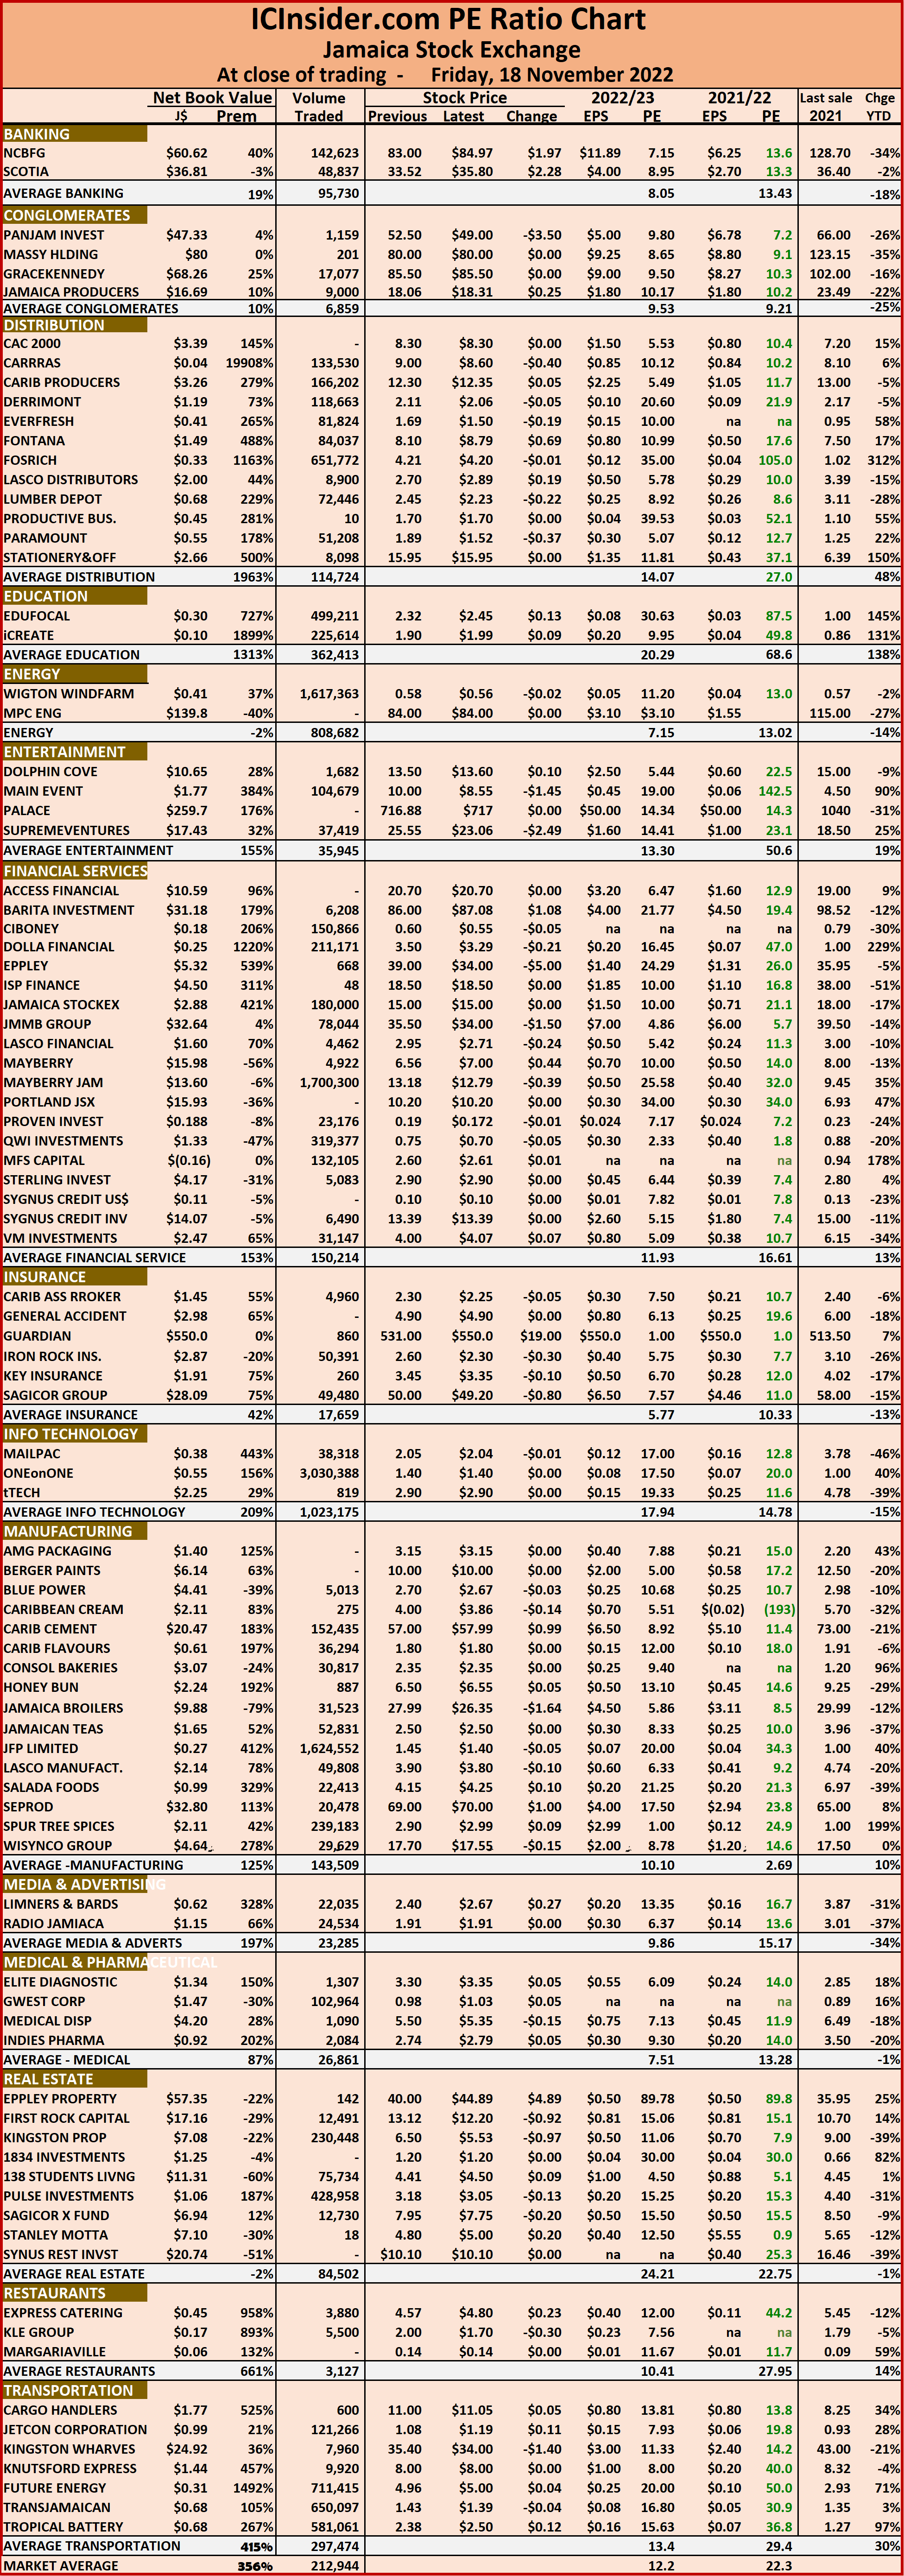 The chart also shows daily changes in stock prices and the percentage year to date price movement based on the last traded prices. Dividends payable and yields for each company are shown in the Main and Junior Markets’ daily report charts that show the closing volume for the bids and offers.


