Stocks drop on the Jamaica Stock Exchange


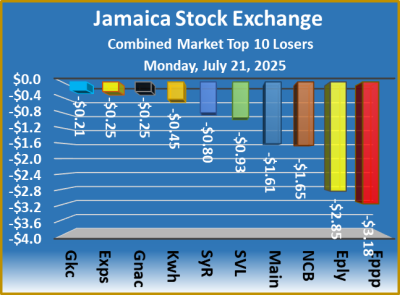
Falling stocks weighed the Jamaica Stock Exchange down on Monday following a rise in the volume of stocks exchanged after NCB Financial traded more than 3 million shares and the overall traded value dropped from that on Friday. Trading ended with all three market indices falling, following the prices of 28 shares rising, 43 declining and 31 remaining firm.
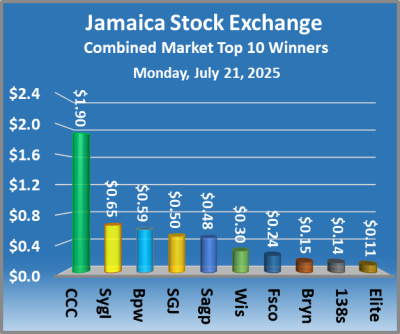
At the close of the market, the JSE Combined Market Index dropped 862.28 points to 315,699.29, the All Jamaican Composite Index shed 558.92 points to 351,847.98, the JSE Main Index shed 556.91 points to end at 304,921.89, the Junior Market Index fell 45.72 points to settle at 3,367.44 and the JSE USD Market Index dipped 4.61 points to 203.78.
At the close of trading, 22,282,668 shares were exchanged in all three markets, up from 10,248,411 units on Friday, with the value of stocks traded on the Junior and Main markets amounting to $144.84 million, down from $177.6 million on the previous day. The JSE USD market closed with an exchange of 273,618 shares for US$8,386 compared to 290,134 units at US$24,809 on Friday.
In Main Market activity, NCB Financial led with 3.07 million shares, followed by Innovative Energy with 2.99 million stocks and Wigton Energy with 2.25 million units.
In Junior Market trading, ONE on ONE Educational led with 6.12 million shares, followed by Dolla Financial with 1.28 million stocks and Stationery and Office Supplies with 289,011 units.
In the preference segment, 138 Student Living preference share lost $10 to finish at $200.
The market’s PE ratio, the most popular measure used to value stocks, ended at 13 based on 2024-5 earnings and 15.8 based on 2024 earnings.
The ICInsider.com PE ratio chart and the other more detailed daily charts that provide investors with regularly updated data to help decision-making. The PE ratio chart covers all ordinary shares listed on the Jamaica Stock Exchange, grouped by industry, allowing for easy comparisons within a sector and the overall market. The earnings per share (EPS) and PE ratios are based on 2024 and 2025 actual or projected earnings, excluding any major one time income or expense.
Pertinent information is required to navigate numerous investment options successfully in the stock market. The chart should be used in making rational decisions when investing in stocks close to the sector average, not staying too far from it, unless there are compelling reasons to do so. This approach helps to remove emotions from investment decisions and place them on fundamentals while at the same time not being too far from the majority of investors. Investors who buy when the price of a stock is close to the average will find that they are not inclined to overpay for a stock. The net asset value of each company is incorporated into the chart. Investors can use this measure in assessing stock values. The chart also shows daily changes in stock prices and the percentage year to date price movement based on the last traded prices. Dividends that are paid or are due to be paid and yields for each company are shown in the Main and Junior Markets’ daily report charts, along with the closing volume of the highest bid and the lowest offer for each company.
JSE markets rallied into the weekend


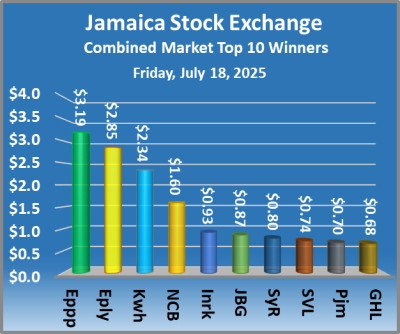
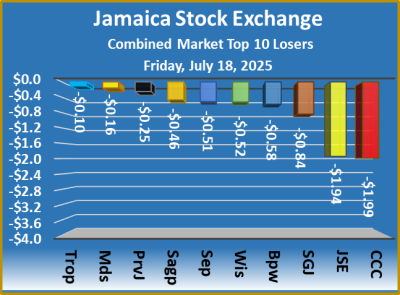
Prices rallied in 38 securities, overshadowing losses in 27 stocks, while 30 remained unchanged at the close of trading on the Jamaica Stock Exchange on Friday, resulting in all markets recording gains. Trading resulted in a fall in the volume of stocks that changed hands, with a greater value than on Thursday.

At the close of trading, the JSE Combined Market Index popped 673.13 points to 316,561.57, the All Jamaican Composite Index lost 2,367.05 points to end at 352,406.90, the JSE Main Index rose 474.89 points to finish at 305,478.80, the Junior Market Index climbed 30.38 points to conclude trading at 3,413.16 and the JSE USD Market Index gained 3.12 points to wrap up trading at 208.39.
At the close of market activity, 10,248,411 shares were traded in all three markets, down from 13,620,769 units on Thursday, with the value of stocks traded on the Junior and Main markets amounted to $177.6 million, up from $105.16 million on the previous day and the JSE USD market closed with an exchange of 290,134 shares for US$24,809 compared to 88,568 units at US$13,671 on Thursday.
In Main Market activity, Carreras led with 2.11 million shares, followed by NCB Financial with 1.43 million stocks and Transjamaican Highway with 1.04 million units.
In Junior Market trading, Jamaican Teas led with 460,337 shares, followed by Fontana with 293,850 stocks and Image Plus with 242,679 units.
In the preference segment, Eppley 7.75% preference share gained $2.97 and ended at $20.
The market’s PE ratio, the most popular measure used to value stocks, ended at 13.2 based on 2024-25 earnings and 16.1 based on 2024 earnings.
The ICInsider.com PE ratio chart and the other, more detailed daily charts provide investors with regularly updated information to help decision-making.
The PE ratio chart covers all of the ordinary shares listed on the Jamaica Stock Exchange and grouped by industry, allowing for easy comparisons within a sector and the overall market. The earnings per share (EPS) and PE ratios are based on 2024 and 2025 actual or projected earnings, excluding any major one time income or expense.
Pertinent information is required to navigate numerous investment options successfully in the stock market. The chart should be used in making rational decisions when investing in stocks close to the sector average, not going too far from it unless there are compelling reasons to do so. This approach helps to remove emotions from investment decisions and place them on fundamentals, while at the same time not being too far from the majority of investors. Investors who buy when the price of a stock is close to the average will find that they are not inclined to overpay for a stock. The net asset value of each company is incorporated into the chart. Investors can use this measure in assessing stock values. The chart also shows daily changes in stock prices and the percentage year to date price movement based on the last traded prices. Dividends that are paid or are due to be paid and yields for each company are shown in the Main and Junior Markets’ daily report charts, along with the closing volume of the highest bid and the lowest offer for each company.
JSE Markets fall as trading rises


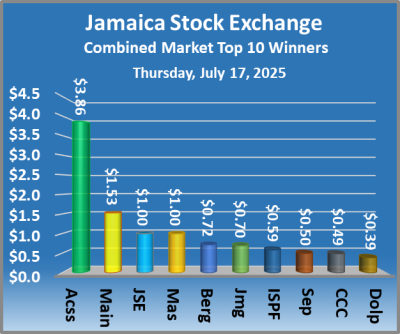
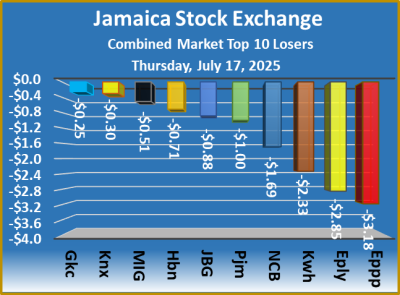
The Jamaica Stock Exchange closed on Thursday, with a rise in the volume and value of stocks traded, compared with Wednesday, resulting in the Main Market major indices closing with mixed fortunes. The Junior Market and the JSE USD Market Indices slipped, following the prices of 20 shares rising, 44 declining and 36 remaining firm.

At the close of the market, the JSE Combined Market Index fell 158.63 points to 315,888.44, the All Jamaican Composite Index rallied 2,903.92 points to end at 354,773.95, the JSE Main Index dipped just 64.00 points to 305,003.91, the Junior Market Index lost 13.50 points to close at 3,382.78 and the JSE USD Market Index slipped 2.57 points to finish at 205.27.
At the close of market activity, 13,620,769 shares were traded in all markets, up from 12,117,135 units on Wednesday, with the value of stocks traded on the Junior and Main markets amounting to $105.16 million, up from just $46.49 million on the previous day, The JSE USD market closed with an exchange of 88,568 shares for US$13,671, down from 221,759 units at US$20,033 on Wednesday.
In Main Market activity, Transjamaican Highway led with 5.0 million shares, followed by NCB Financial with 1.63 million stocks and Wigton Energy ending with 375,123 units.
In Junior Market trading, Mailpac Group led with 1.42 million shares, followed by One Great Studio with 626,041 stocks and Atlantic Hardware with 520,880 units.
In the preference segment, Sygnus Credit Investments C10.5% sank $4.75 to end at $105.
The market’s PE ratio, the most popular measure used to value stocks, ended at 13 based on 2024-25 earnings and 15.9 based on 2024-25 historical earnings.
The ICInsider.com PE ratio chart and the other, more detailed daily charts provide investors with information that is regularly to help decision-making. The PE ratio chart covers all ordinary shares listed on the Jamaica Stock Exchange, grouped by industry, allowing for easy comparisons within a sector and the overall market. The earnings per share (EPS) and PE ratios are based on 2024 and 2025 actual or projected earnings, excluding any major one time income or expense.
Pertinent information is required to navigate numerous investment options successfully in the stock market. The chart should be used in making rational decisions when investing in stocks close to the sector average, not going too far from it unless there are compelling reasons to do so. This approach helps to remove emotions from investment decisions and place them on fundamentals, while at the same time not being too far from the majority of investors. Investors who buy when the price of a stock is close to the average will find that they are not inclined to overpay for a stock. The net asset value of each company is incorporated into the chart. Investors can use this measure in assessing stock values. The chart also shows daily changes in stock prices and the percentage year to date price movement based on the last traded prices. Dividends that are paid or are due to be paid and yields for each company are shown in the Main and Junior Markets’ daily report charts, along with the closing volume of the highest bid and the lowest offer for each company.
Trading drops on Jamaica Stock Exchange

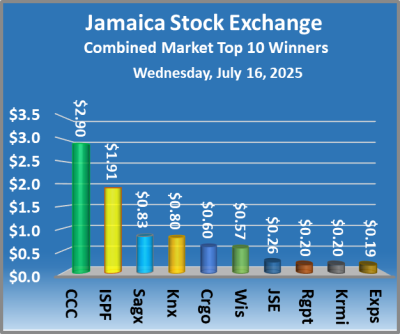
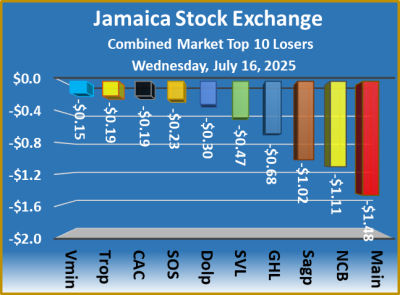
in Trading declined on Wednesday on the Jamaica Stock Exchange, following a minor slippage in the volume of stocks changing hands, accompanied by a lower value than on Tuesday. The Main Market major indices fell, the Junior Market and the JSE USD Market gained as the prices of 40 shares rose, 31 declined and 33 remained firm.

At the close of the market, the JSE Combined Market Index skidded 700.88 points to end at 316,047.07, the All Jamaican Composite Index declined by 1,049.80 points to 351,870.03, and the JSE Main Index dipped by 795.20 points to 305,067.91. The Junior Market Index rose 8.18 points to finish at 3,396.28 and the JSE USD Market Index added 1.02 points to end at 207.84.
At the close of the day’s, 12,117,135 shares were traded in all three markets, down from 12,704,818 units on Tuesday, with the value of stocks traded on the Junior and Main markets amounted to $46.49 million, down from $59.37 million on the previous day and the JSE USD market closed with an exchange of 221,759 shares for US$20,033 compared to 181,959 units at US$12,055 on Tuesday.
In Main Market activity, Sagicor Select Manufacturing & Distribution Fund led with 1.55 million shares, followed by Lasco Manufacturing with 1.36 million stocks and Sagicor Select Financial Fund with 1.20 million units.
In Junior Market trading, Stationery and Office Supplies led with 896,850 shares, followed by Image Plus with 841,028 stocks and Future Energy with 394,986 units.
In the preference segment, 138 Student Living preferred dipped $4.47 and ended at $210.
The market’s PE ratio, the most popular measure used to value stocks, ended at 13 based on 2024-25 earnings and for 2024 earnings, 15.9.
The ICInsider.com PE chart and the more detailed daily charts provide investors with regularly updated information to help in decision-making.
The PE ratio chart covers all ordinary shares that are listed on the Jamaica Stock Exchange, grouped by industry, allowing for easy comparisons within a sector and the overall market. The earnings per share (EPS) and PE ratios are based on 2024 and 2025 actual or projected earnings, excluding any major one time income or expense.
Pertinent information is required to navigate numerous investment options successfully in the stock market. The chart should be used as an aid in making rational decisions when investing in stocks close to the sector average, not straying too far from it unless there are compelling reasons to do so. This approach helps to remove emotions from investment decisions and place them on fundamentals, while not being too far from where the majority of investors are. Investors who buy when the price of a stock is close to the average will find that they are not inclined to overpay for a stock. The net asset value of each company is incorporated into the chart. Investors can use this measure in assessing stock values. The chart also reflects daily changes in stock prices and the percentage year to date price movement based on the last traded prices. Dividends that are paid or are due to be paid and yields for each company are shown in the Main and Junior Markets’ daily report charts, along with the closing volume of the highest bid and the lowest offer for each company.
Trading drops on Jamaica Stock Exchange


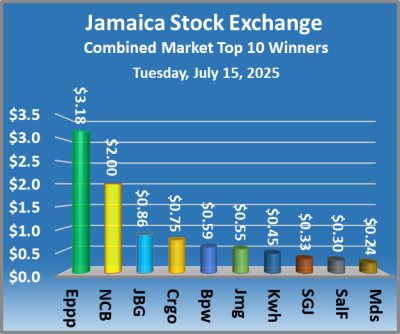
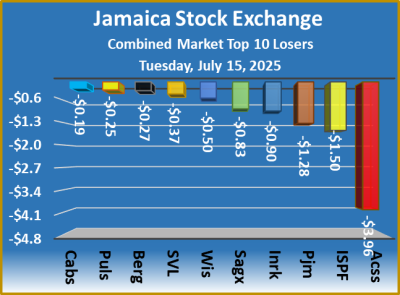
Trading closed Tuesday on the Jamaica Stock Exchange with a fall in the volume of stocks exchanged, with a lower value than on Monday, following Monday’s big trade of 113 million Cargo Handlers shares, worth $1 billion. At the close, the Main Market major indices and the JSE USD Market Index fell and the Junior Market index declined, following the prices of 44 shares rising, 38 declining and 24 remaining firm.

At the close of the market, the JSE Combined Market Index rose 143.04 points to close at 316,747.95, the All Jamaican Composite Index gained 68.59 points to conclude trading at 352,919.83, the JSE Main Index rallied 164.30 points to end at 305,863.11, the Junior Market Index slipped 1.94 points to end at 3,388.10 and the JSE USD Market Index increased 1.97 points to end at 206.82.
At close of a low-keyed session, 12,704,818 shares were traded in all three markets, down from 132,281,634 units on Monday, with the value of stocks traded on the Junior and Main markets amounted to $59.37 million, down from $1.17 billion on the previous day and the JSE USD market closed with an exchange of 181,959 shares for US$12,055, down from 353,790 units at US$13,093 on Monday.
In Main Market activity, Transjamaican Highway led trading with 2.22 million shares, followed by Wigton Energy with 1.0 million stocks and NCB Financial with 596,552 units.
In Junior Market trading, Spur Tree Spices led with 1.14 million shares, followed by RA Williams with 1.10 million stocks and Regency Petroleum with 778,464 units.
In the preference segment, Eppley 7.75% preference share shed $2.98 to $17, Jamaica Public Service 9.5% climbed $5 to finish at $2,655 and Sygnus Credit Investments C10.5% rose $1.24 and ended at $110.
The market’s PE ratio, the most popular measure used to value stocks, ended at 1314 based on 2024-25 earnings and that for 2024 earnings, 15.8.
The ICInsider.com PE chart and the other, more detailed daily charts provide investors with information that is regularly updated to help in making investment decisions.
The PE ratio chart covers all ordinary shares that are listed on Stock Exchange, grouped by industry, allowing for easy comparisons within a sector and the overall market. The earnings per share (EPS) and PE ratios are based on 2024 and 2025 actual or projected earnings, excluding any major one time income or expense.
Pertinent information is required to navigate numerous investment options successfully in the stock market. The chart should be used in making rational decisions when investing in stocks close to the sector average, not going too far from it unless there are compelling reasons to do so. This approach helps to remove emotions from investment decisions and place them on fundamentals while at the same time not being too far from the majority of investors. Investors who buy when the price of a stock is close to the average will find that they are not inclined to overpay for a stock. The net asset value of each company is incorporated into the chart. Investors can use this measure in assessing stock values. The chart also shows daily changes in stock prices and the percentage year to date price movement based on the last traded prices. Dividends that are paid or are due to be paid and yields for each company are shown in the Main and Junior Markets’ daily report charts, along with the closing volume of the highest bid and the lowest offer for each company.
The $1 billion Cargo Handlers trade


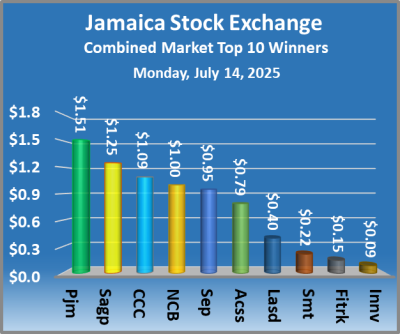
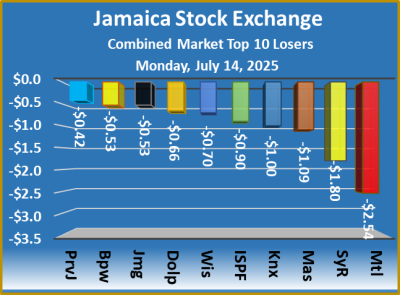
Trading jumped sharply on the Jamaica Stock Exchange with trading in a block of 119,911,980 held in the name of Anthony Mark Hart, with a value of $1.066 billion and pushing the volume of stocks that were exchanged, well over that on Friday, at the close, all three markets of the JSE declined, with the prices of 33 shares rising, 49 declining and 28 remaining firm.

At the close, the JSE Combined Market Index skidded by 641.19 points to end at 316,604.91, the All Jamaican Composite Index dropped 124.69 points to wrap up trading at 352,851.24, the JSE Main Index fell 572.60 points to end at 305,698.81, the Junior Market Index shed 13.02 points to finish at 3,390.04 and the JSE USD Market Index declined 6.08 points to 204.85.
The market closed trading with 132,281,634 shares traded in all three markets, up from 21,079,283 units on Friday, with the value of stocks traded on the Junior and Main markets amounting to $1.17 billion, up from just $117.07 million on the previous day. The JSE USD market closed with an exchange of 353,790 shares for US$13,093, down from 2,482,008 units at US$72,123 on Friday.
In Main Market activity, Transjamaican Highway led with 2.80 million shares followed by JMMB Group 10% with 1.57 million stocks and Sagicor Select Manufacturing & Distribution Fund with 1.46 million units.
In Junior Market trading, Cargo Handlers led with 112.99 million shares, followed by Regency Petroleum with 3.26 million stocks and One Great Studio with 1.44 million units.
In the preference segment, 138 Student Living preferred share lost $5.99 in closing at $215, Productive Business Solutions 10.5% rose $80 to $1,120 and Sygnus Credit Investments C10.5% sank $1.50 to finish at $109.
The market’s PE ratio, the most popular measure used to value stocks, ended at 13.2 based on 2026-25 earnings and 15.9 based on 2024 earnings.
The ICInsider.com PE ratio chart and the other, detailed daily charts provide investors with information that is regularly updated to help in decision-making. The PE ratio chart covers all ordinary shares that are listed on the Jamaica Stock Exchange, grouped by industry, allowing for easy comparisons within a sector and the overall market. The earnings per share (EPS) and PE ratios are based on 2024 and 2025 actual or projected earnings, excluding any major one time income or expense.
Pertinent information is required to navigate numerous investment options successfully in the stock market. The chart should be used in making rational decisions when investing in stocks close to the sector average, not going too far from it unless there are compelling reasons to do so. This approach helps to remove emotions from investment decisions and place them on fundamentals, while at the same time not being too far from the majority of investors. Investors who buy when the price of a stock is close to the average will find that they are not inclined to overpay for a stock. The net asset value of each company is incorporated into the chart. Investors can use this measure in assessing stock values. The chart also shows daily changes in stock prices and the percentage year to date price movement based on the last traded prices. Dividends that are paid or are due to be paid and yields for each company are shown in the Main and Junior Markets’ daily report charts, along with the closing volume of the highest bid and the lowest offer for each company.
Jamaica Stock Exchange trading jumps


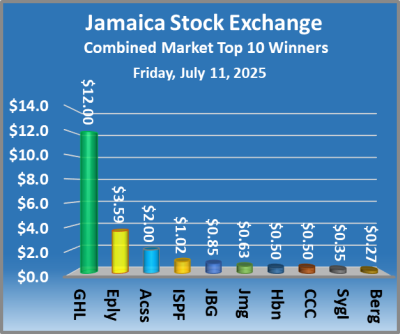
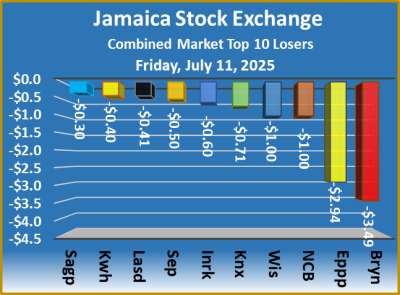
Trading closed Friday on the Jamaica Stock Exchange with a rise in the volume of stocks exchanged, with a greater value than on Thursday, resulting in the Main Market major indices and the Junior Market index slipping and the JSE USD Market climbing. At the end of trading, prices of 40 shares rose, 40 declined and 27 remained firm.

At the close of the market, the JSE Combined Market Index dropped 2,679.12 points to end at 317,246.10, the All Jamaican Composite Index shed 3,060.37 points to end at 352,975.93, the JSE Main Index dipped 2,752.72 points to finish at 306,271.41, the Junior Market Index slipped by 6.73 points to 3,403.06 and the JSE USD Market Index gained 5.95 points to finish at 210.93.
At the close of heighted trading session, 21,079,283 shares were exchanged in all three markets, up from 10,542,446 units on Thursday, with the value of stocks traded on the Junior and Main markets amounting to $117.07 million, up from $89.42 million on the previous day and the JSE USD market closed with an exchange of 2,482,008 shares for US$72,123, up from just 129,045 units at US$17,826 on Thursday.
In Main Market activity, Wigton Energy led trading with 3.97 million shares, followed by Transjamaican Highway with 3.64 million stocks and NCB Financial with 1.78 million units.
In Junior Market trading, Mailpac Group led with 2.94 million shares, followed by MFS Capital Partners with 712,006 stocks and Derrimon Trading with 357,372 units.
In the preference segment, 138 Student Living preference share jumped $25.99 to finish at $221, Productive Business Solutions 10.5% dropped $20 and ended at $1,040 and Sygnus Credit Investments C10.5% increased $4.70 to $110.
The market’s PE ratio, the most popular measure used to value stocks, ended at 13.5 based on 2024-25 earnings and 16 based on 2024 earnings.
The ICInsider.com PE ratio chart and the more detailed daily charts provide investors with regularly updated data to help decision-making.
The PE ratio chart covers all the ordinary shares listed on the Jamaica Stock Exchange and grouped by industry and allows for easy comparisons within a sector and the overall market. The earnings per share (EPS) and PE ratios are based on 2024 and 2025 actual or projected earnings, excluding any major one-time income or expense.
Pertinent information is required to navigate numerous investment options successfully in the stock market. The chart should be used in making rational decisions when investing in stocks close to the sector average, not going too far from it unless there are compelling reasons to do so. This approach helps to remove emotions from investment decisions and place them on fundamentals, while at the same time not being too far from the majority of investors. Investors who buy when the price of a stock is close to the average will find that they are not inclined to overpay for a stock. The net asset value of each company is incorporated into the chart. Investors can use this measure in assessing stock values. The chart also shows daily changes in stock prices and the percentage year to date price movement based on the last traded prices. Dividends that are paid or are due to be paid and yields for each company are shown in the Main and Junior Markets’ daily report charts, along with the closing volume of the highest bid and the lowest offer for each company.
JSE Main Market rallies, Juniors fall


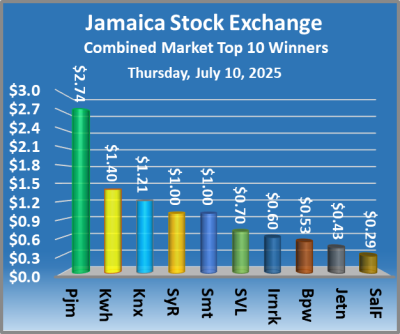
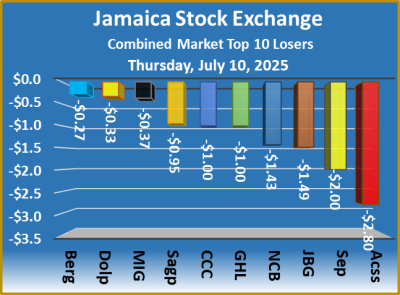
Trading closed Thursday on the Jamaica Stock Exchange with mixed results in the three markets, with gains in the Main Market major indices and that of the JSE USD Market. Trading on the Junior Market saw the index remaining positive until the dying moments of trading, when Access Financial traded more than 33,000 shares down to $17.20. The market closed with a rise in the volume of stocks exchanged, at a marginally lower value than on Wednesday, with prices of 37 shares rising, 42 declining and 29 remaining firm.

At the close of the market, the JSE Combined Market Index increased 1,983.60 points to finish at 319,925.22, the All Jamaican Composite Index rallied 3,048.96 points to 356,036.30, the JSE Main Index rose 2,158.39 points to end at 309,024.13, the Junior Market Index fell 10.94 points to 3,409.79 and the JSE USD Market Index climbed 1.14 points to 204.98.
At the close of trading, 10,542,446 shares were traded in all three markets, up from 8,624,363 units on Wednesday, with the value of stocks traded on the Junior and Main markets amounting to $89.42 million, down from $91 million on the previous day and the JSE USD market closed with an exchange of 129,045 shares for US$17,826 compared to 75,771 units at US$43,620 on Wednesday.
In Main Market activity, Sagicor Select Manufacturing & Distribution Fund led trading with 1.24 million shares, followed by Transjamaican Highway with 1.23 million stocks and GraceKennedy with 602,706 units.
In Junior Market trading, Lasco Financial led with 1.41 million shares, followed by MFS Capital Partners with 605,278 stocks and JFP with 512,086 units.
In the preference segment, Jamaica Public Service 7% sank $2.50 and ended at $40, Jamaica Public Service 9.5% shed $5 to $2,650 and 138 Student Living preference share declined $27.98 to end at $195.
The market’s PE ratio, the most popular measure used to value stocks, ended at 13.7 based on the 2025-26 earnings and 16.2 based on 2024 earnings.
The ICInsider.com PE ratio chart and the other, more detailed daily charts provide investors with regularly updated information to help decision-making. The PE ratio chart covers all ordinary shares listed on the Jamaica Stock Exchange, grouped by industry, allowing for easy comparisons within a sector and the overall market. The earnings per share (EPS) and PE ratios are based on 2024 and 2025 actual or projected earnings, excluding any major one time income or expense.
Pertinent information is required to navigate numerous investment options successfully in the stock market. The chart should be used in making rational decisions when investing in stocks close to the sector average, not going too far from it unless there are compelling reasons to do so. This approach helps to remove emotions from investment decisions and place them on fundamentals, while at the same time not being too far from the majority of investors. Investors who buy when the price of a stock is close to the average will find that they are not inclined to overpay for a stock. The net asset value of each company is incorporated into the chart. Investors can use this measure in assessing stock values. The chart also shows daily changes in stock prices and the percentage year to date price movement based on the last traded prices. Dividends that are paid or are due to be paid and yields for each company are shown in the Main and Junior Markets’ daily report charts, along with the closing volume of the highest bid and the lowest offer for each company.
JSE Main & Junior markets closed lower


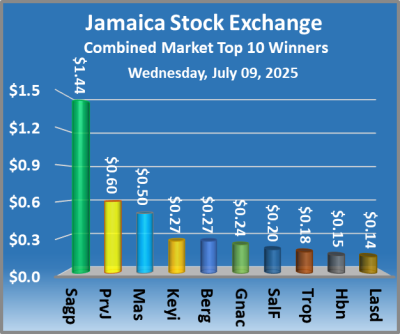
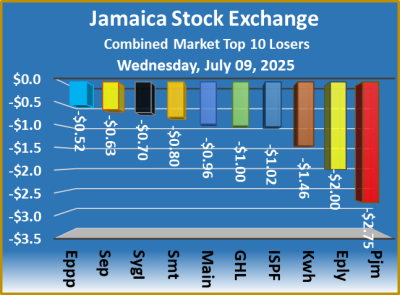
The Main and Junior markets closed lower at the end of trading on Wednesday on the Jamaica Stock Exchange, and the JSE USD Market finished higher, following prices of 33 shares rising, 41 declining and 34 remaining firm. The volume of stocks exchanged declined, with a greater value than on Tuesday.

At the close of the market, the JSE Combined Market Index declined 1,940.80 points to 317,941.62, the All Jamaican Composite Index dropped 2,145.68 points to end at 352,987.34, the JSE Main Index shed 1,909.54 points to settle at 306,865.74, the Junior Market Index sank 16.07 points to 3,420.73 and the JSE USD Market Index advanced 0.15 points to end at 203.84.
At the close of trading, 8,624,363 shares were exchanged in all three markets, down from 10,985,037 units on Tuesday, with the value of stocks traded on the Junior and Main markets amounting to $91 million, up from $52.94 million on the previous day. The JSE USD market closed with an exchange of 75,771 shares for US$43,620 compared to 90,425 units at US$17,687 on Tuesday.
In Main Market activity, Transjamaican Highway led trading with 1.91 million shares, followed by Sagicor Select Financial Fund with 803,640 stocks and NCB Financial with 758,939 units.
In Junior Market trading, Tropical Battery led with 571,644 shares, followed by One Great Studio with 376,843 stocks and Spur Tree Spices with 359,035 units.
In the preference segment, Jamaica Public Service 7% advanced $5.88 to $43 and 138 Student Living preference share slipped $2.85 to finish at $223.
The market’s PE ratio, the most popular measure used to value stocks, ended at 13.6 based on 2024-25 earnings and 16.1 based on 2024 earnings.
The ICInsider.com PE ratio chart and the other, more detailed daily charts provide investors with regularly updated information to help decision-making. The PE ratio chart covers all ordinary shares listed on the Jamaica Stock Exchange, grouped by industry, allowing for easy comparisons within a sector and the overall market. The earnings per share (EPS) and PE ratios are based on 2024 and 2025 actual or projected earnings, excluding any major one time income or expense.
Pertinent information is required to navigate numerous investment options successfully in the stock market. The chart should be used in making rational decisions when investing in stocks close to the sector average, not going too far from it unless there are compelling reasons to do so. This approach helps to remove emotions from investment decisions and place them on fundamentals, while at the same time not being too far from the majority of investors. Investors who buy when the price of a stock is close to the average will find that they are not inclined to overpay for a stock. The net asset value of each company is incorporated into the chart. Investors can use this measure in assessing stock values. The chart also shows daily changes in stock prices and the percentage year to date price movement based on the last traded prices. Dividends that are paid or are due to be paid and yields for each company are shown in the Main and Junior Markets’ daily report charts, along with the closing volume of the highest bid and the lowest offer for each company.
Steady Jamaica Stock Exchange markets


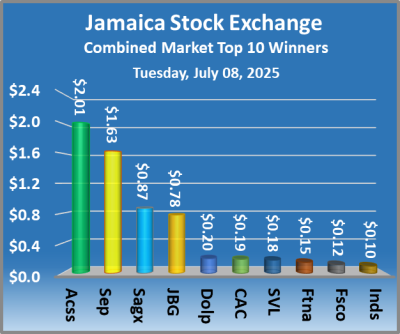
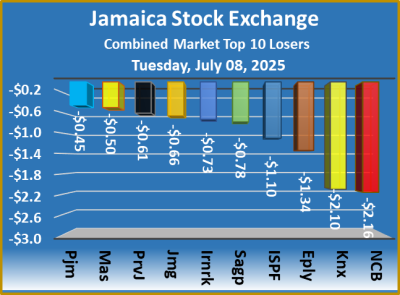
Steady Jamaica Stock Exchange activity on Tuesday ended with a big fall in the volume of stocks exchanged, at a lower value than on Monday, resulting in all three markets slipping marginally, resulting in prices of 30 shares rising, 45 declining and 31 remaining firm.

At the close of the market, the JSE Combined Market Index slipped 97.83 points to finish at 319,882.42, the All Jamaican Composite Index increased by just 2.00 points to settle at 355,133.02, the JSE Main Index dipped 80.17 points to 308,775.28, the Junior Market Index lost just 2.94 points to end at 3,436.80 and the JSE USD Market Index shed 1.25 points to finish at 203.69.
At the close of trading, 10,985,037 shares were exchanged in all three markets, down from 39,650,572 units on Monday, with the value of stocks traded on the Junior and Main markets amounted to $52.94 million, down from $113.82 million on the previous day and the JSE USD market closed with an exchange of 90,425 shares for US$17,687 up from 75,504 units at US$8,352 on Monday.
In Main Market activity, Transjamaican Highway led trading with 4.52 million shares, followed by Wigton Energy with 1.43 million stocks and JMMB Group 7.35% – 2028 with 603,691 units.
In Junior Market trading, Tropical Battery led with 549,104 shares, followed by Fontana with 483,158 stock units and Derrimon Trading with 375,500 units.
In the preference segment, Jamaica Public Service 7% sank $6.63 to $37, Productive Business Solutions 10.5% dipped $20 to end at $1,060 and Sygnus Credit Investments 10% popped $4.45 in closing at $108.
The market’s PE ratio, the most used measure to value stocks, ended at 13.7 based on 2024-25 earnings and 16.2 based on historical earnings.
The ICInsider.com PE ratio chart and the more detailed daily charts provide investors with regularly updated data to help decision-making.
The PE ratio chart covers all ordinary shares listed on the Jamaica Stock Exchange and grouped by industry, to allow for easy comparisons within a sector and the overall market. The earnings per share (EPS) and PE ratios are based on 2024 and 2025 actual or projected earnings, excluding any major one time income or expense.
Pertinent information is required to navigate numerous investment options successfully in the stock market. The chart should be used to help in making rational decisions when investing in stocks close to the sector average, not going too far from it unless there are compelling reasons to do so. This approach helps to remove emotions from investment decisions and place them on fundamentals, while at the same time not being too far from the majority of investors. Investors who buy when the price of a stock is close to the average will find that they are not inclined to overpay for a stock. The net asset value of each company is incorporated into the chart. Investors can use this measure in assessing stock values. The chart also shows daily changes in stock prices and the percentage year to date price movement based on the last traded prices. Dividends that are paid or are due to be paid and yields for each company are shown in the Main and Junior Markets’ daily report charts, along with the closing volume of the highest bid and the lowest offer for each company.