Juniors fall JSE Main Market rises

Access Financial was one of the standout performers in trading on Monday with a jump of $3.50 following the release of full year results showing a profit after taxing climbing 65 percent to $438 million as investors warmed to the news, but the move had little impact on the overall Junior Market that slipped in value at the close. But Main Market stocks inched higher at the finish.

Access Financial Services head office.

At the same time, recently listed Dolla Financial continued to trade above average volumes for Junior Market stocks, with 6.9 million shares accounting for 41 percent of Junior Market trading on Monday, but the price eased just a few cents at the close.
The market closed with the JSE Combined Index adding 826.79 points to close at 396,711.44, while the All Jamaican Composite Index climbed 1,833.85 points to end at 437,818.37, the JSE Main Index climbed 1338.41 points to 382,525.24, the Junior Market index lost 47.28 points in closing at 4,342.19 and the JSE USD market index lost 1.68 points to close at 217.99.
Investors exchanged 31,176,437 shares in all markets, with the value of stocks traded in the Main and Junior Markets ending at $134.1 million and in the JSE USD market, US$9,897.
The market’s PE ratio ended at 23.3 based on 2021-22 earnings and 13 times those for 2022-23 at the close of trading.
Investors need measures and pertinent information to navigate many investment choices in the local stock market successfully. The ICInsider.com PE ratio chart and the more detailed daily report charts provide investors with regularly updated information to help decision-making.
Investors should use the chart to help make rational investment decisions by investing in stocks close to the average for the sector and not going too far from it unless there are compelling reasons to do so. This approach helps to take emotions out of the investment decision and put in on fundamentals while at the same time not being too far from the majority of investors. Investors who buy when the price of a stock is close to the average will find that they are not inclined to overpay for a stock.
The ICInsider.com PE Ratio chart covers all ordinary shares on the Jamaica Stock Exchange. It shows companies grouped on an industry basis, allowing easy comparisons between the same sector companies and the overall market.
The net asset value of each company is reported as a guide to quickly assess the value of stocks based on this measure. The chart also shows daily changes in stock prices and the percentage year to date price movement based on the last traded prices. Dividends payable and yields for each company are shown in the Main and Junior Markets’ daily report charts that show the closing volume for the bids and offers.
The EPS & PE ratios are based on 2021 and 2022 actual or projected earnings, excluding major one off items. The PE Ratio is the most popular measure used to determine the value of stocks.

Dolla may be close to a bottom

Dolla Financial traded 11.8 million shares accounting for 62 percent of Junior Market trading on Friday against 12 million changing hands on Thursday, with the price slipping from $2.90 on Thursday to close at $2.72 still higher than the $2.32 closing last week but 24 percent from the peak of $3.60.
The JSE Combined Index fell 1,793,60 points to close at 395,884.64 while the All Jamaican Composite Index lost 3,281.67 points to end at 435,984.51, the JSE Main Index dropped 2,163.47 points to 381,186.83, the Junior Market index rose 25.57 points to 4,389.47 and the JSE USD market index climbed 3.76 points to close at 219.67.
Investors exchanged 36,015,776 shares in all markets, with the value of trading in the Main and Junior Markets amounting to $208.7 million and in the JSE USD market, US$15,839.
The market’s PE ratio ended at 24.1 based on 2021-22 earnings and 13 times those for 2022-23 at the close of trading.
Investors need a series of measures and pertinent information to successfully navigate many investment choices, in the local stock market. The ICInsider.com PE ratio chart and the more detailed daily report charts provide investors with regularly updated information to help with decision-making.
Investors should use the chart to help make rational investment decisions by investing in stocks that are close to the average for the sector and not going too far from it unless there are compelling reasons to do so. This approach helps to take emotions out of the investment decision and put in on fundamentals while at the same time not being too far from the majority of investors. Investors who buy when the price of a stock is close to the average will find that they are not inclined to overpay for a stock.
The ICInsider.com PE Ratio chart includes all ordinary shares on the Jamaica Stock Exchange. It shows companies grouped on an industry basis, allowing easy comparisons between the same sector companies and the overall market.

The net asset value of each company is reported as a guide to assess the value of stocks based on this measure quickly. The chart also shows daily changes in stock prices and the percentage year to date price movement based on the last traded prices. Dividends payable and yields for each company are shown in the Main and Junior Markets’ daily report charts that show the closing volume for the bids and offers.
The EPS & PE ratios are based on 2021 and 2022 actual or projected earnings, excluding major one off items. The PE Ratio is the most popular measure used to determine the value of stocks.


Dolla cool out

Dolla fever seems to be at an end with the price retreating a bit in trading on Thursday with only 12 million shares changing hands, but accounting for 39 percent of Junior Market trading, down from 42.7 million shares on Wednesday,
The JSE Combined Index climbed 2,003.09 points to close at 397,678.25, the All Jamaican Composite Index rose 3,067.03 points to 439,266.19, the JSE Main Index rallied 2,365.47 points to 383,350.63, the Junior Market index shed 23.25 points to 4,365.47 and the JSE USD market index slipped 0.07 points to close at 215.90.
Investors exchanged 47,498,863 shares in all markets, with the value of stocks traded in the Main and Junior Markets ended at $294.4 million and in the JSE USD market, US$7,758.
The market’s PE ratio ended at 24.4 based on 2021-22 earnings and 13 times those for 2022-23 at the close of trading.
Investors need a series of measures and pertinent information to successfully navigate many investment choices, in the local stock market. The ICInsider.com PE ratio chart and the more detailed daily report charts provide investors with regularly updated information to help with decision-making.
Investors should use the chart to help make rational investment decisions by investing in stocks that are close to the average for the sector and not going too far from it unless there are compelling reasons to do so. This approach helps to take emotions out of the investment decision and put in on fundamentals while at the same time not being too far from the majority of investors. Investors who buy when the price of a stock is close to the average will find that they are not inclined to overpay for a stock.
The ICInsider.com PE Ratio chart covers all ordinary shares listed on the Jamaica Stock Exchange. It shows companies grouped on an industry basis, allowing easy comparisons between the same sector companies and the overall market.
The net asset value of each company is reported as a guide to assess the value of stocks based on this measure quickly. The chart also shows daily changes in stock prices and the percentage year to date price movement based on the last traded prices. Dividends payable and yields for each company are shown in the Main and Junior Markets’ daily report charts that show the closing volume for the bids and offers.
The EPS & PE ratios are based on 2021 and 2022 actual or projected earnings, excluding major one off items. The PE Ratio is the most popular measure used to determine the value of stocks.


Dolla Financial drops

It was another day of Dolla Financial dominance in trading on the overall market trading of 42.7 million shares, following Tuesday, with 63.3 million units, but the stock faced more selling with the price slipping $3.22 at the close of Tuesday to $2.94 as the Junior Market held up well but slipped slightly at the close.
The JSE Combined Index dropped 606.61 points to close at 395,675.16, while the All Jamaican Composite Index rose 286.14 points to 436,199.16, the JSE Main Index rallied fell 624.84 points to 380,985.16, the Junior Market index slipped 2.48 points to 4,387.14 and the JSE USD market index added 3.42 points to close at 215.97.
Investors exchanged 69,885,419 shares in all markets, with the value of stocks traded in the Main and Junior Markets ending at $314.9 million and in the JSE USD market, US$718,784.
The market’s PE ratio ended at 24.2 based on 2021-22 earnings and 13 times those for 2022-23 at the close of trading.
Investors need measures and pertinent information to successfully navigate many investment choices in the local stock market. The ICInsider.com PE ratio chart and the more detailed daily report charts provide investors with regularly updated information to help decision-making.
Investors should use the chart to help make rational investment decisions by investing in stocks close to the average for the sector and not going too far from it unless there are compelling reasons to do so. This approach helps to take emotions out of the investment decision and put in on fundamentals while at the same time not being too far from the majority of investors. Investors who buy when the price of a stock is close to the average will find that they are not inclined to overpay for a stock.
The ICInsider.com PE Ratio chart covers all ordinary shares on the Jamaica Stock Exchange. It shows companies grouped on an industry basis, allowing easy comparisons between the same sector companies and the overall market.
The net asset value of each company is reported as a guide to quickly assess the value of stocks based on this measure. The chart also shows daily changes in stock prices and the percentage year to date price movement based on the last traded prices. Dividends payable and yields for each company are shown in the Main and Junior Markets’ daily report charts that show the closing volume for the bids and offers.
The EPS & PE ratios are based on 2021 and 2022 actual or projected earnings, excluding major one off items. The PE Ratio is the most popular measure used to determine the value of stocks.


Dolla Financial cools off

Trading in Dolla Financial cooled off on Tuesday, but with trading of 63.3 million shares, the largest daily amount so far since the shares were listed last week and bettering the 19 million units traded on Monday, as the price topped out at $3.60, but ended the day at $3.22.
The Main and Junior Markets rose and helped to push the JSE Combined Index up 1,243.59 points to close at 396,281.77.
The All Jamaican Composite Index rose 501.91 points to 435,913.02, the JSE Main Index rallied 603.43 points to 381,610, the Junior Market index rose a strong 75.60 points to 4,389.62 and the JSE USD market index slipped 1.28 points to close at 212.55.
Investors exchanged 87,888,049 shares in all markets, with the value of stocks traded in the Main and Junior Markets ended at $718.5 million and in the JSE USD market, US$11,186.
The market’s PE ratio ended at 24.9 based on 2021-22 earnings and 13.2 times those for 2022-23 at the close of trading.
Investors need a series of measures and pertinent information to successfully navigate many investment choices, in the local stock market. The ICInsider.com PE ratio chart and the more detailed daily report charts provide investors with regularly updated information to help with decision-making.
Investors should use the chart to help make rational investment decisions by investing in stocks that are close to the average for the sector and not going too far from it unless there are compelling reasons to do so. This approach helps to take emotions out of the investment decision and put in on fundamentals while at the same time not being too far from the majority of investors. Investors who buy when the price of a stock is close to the average will find that they are not inclined to overpay for a stock.
The ICInsider.com PE Ratio chart covers all ordinary shares listed on the Jamaica Stock Exchange. It shows companies grouped on an industry basis, allowing easy comparisons between the same sector companies and the overall market.
The net asset value of each company is reported as a guide to assess the value of stocks based on this measure quickly. The chart also shows daily changes in stock prices and the percentage year to date price movement based on the last traded prices. Dividends payable and yields for each company are shown in the Main and Junior Markets’ daily report charts that show the closing volume for the bids and offers.
The EPS & PE ratios are based on 2021 and 2022 actual or projected earnings, excluding major one off items. The PE Ratio is the most popular measure used to determine the value of stocks.

Dolla Financial 207% 4 days’ gains

Trading in Dolla Financial pushed the price to a maximum permitted for the day at $3.07, up 207 percent since listing last week, resulting in the biggest day of trading so far in the stock, with 19 million units and helped in pushing the Junior Market index up a solid 111.58 point to 4,324.02.
Dolla closed, with 31.5 million units to buy on the bid at $3.07, with only a few million units on offer. Activity in the Junior Market helped to push the JSE Combined Index up 514.73 points to close at 395,038.18.
The All Jamaican Composite Index slipped 860.46 points to 435,411.11, the JSE Main Index fell 521.64 points to 381,006.57 and the SE USD market index popped 2.90 points to close at 213.83.
Investors exchanged 45,540,179 shares in all markets, with the value of stocks traded in the Main and Junior Markets ended at $332.5 million and in the JSE USD market, US$46,352.
The market’s PE ratio ended at 24.4 based on 2021-22 earnings and 13 times those for 2022-23 at the close of trading.
Investors need a series of measures and pertinent information to successfully navigate many investment choices, in the local stock market. The ICInsider.com PE ratio chart and the more detailed daily report charts provide investors with regularly updated information to help with decision-making.
Investors should use the chart to help make rational investment decisions by investing in stocks that are close to the average for the sector and not going too far from it unless there are compelling reasons to do so. This approach helps to take emotions out of the investment decision and put in on fundamentals while at the same time not being too far from the majority of investors. Investors who buy when the price of a stock is close to the average will find that they are not inclined to overpay for a stock.
The ICInsider.com PE Ratio chart covers all ordinary shares listed on the Jamaica Stock Exchange. It shows companies grouped on an industry basis, allowing easy comparisons between the same sector companies and the overall market.
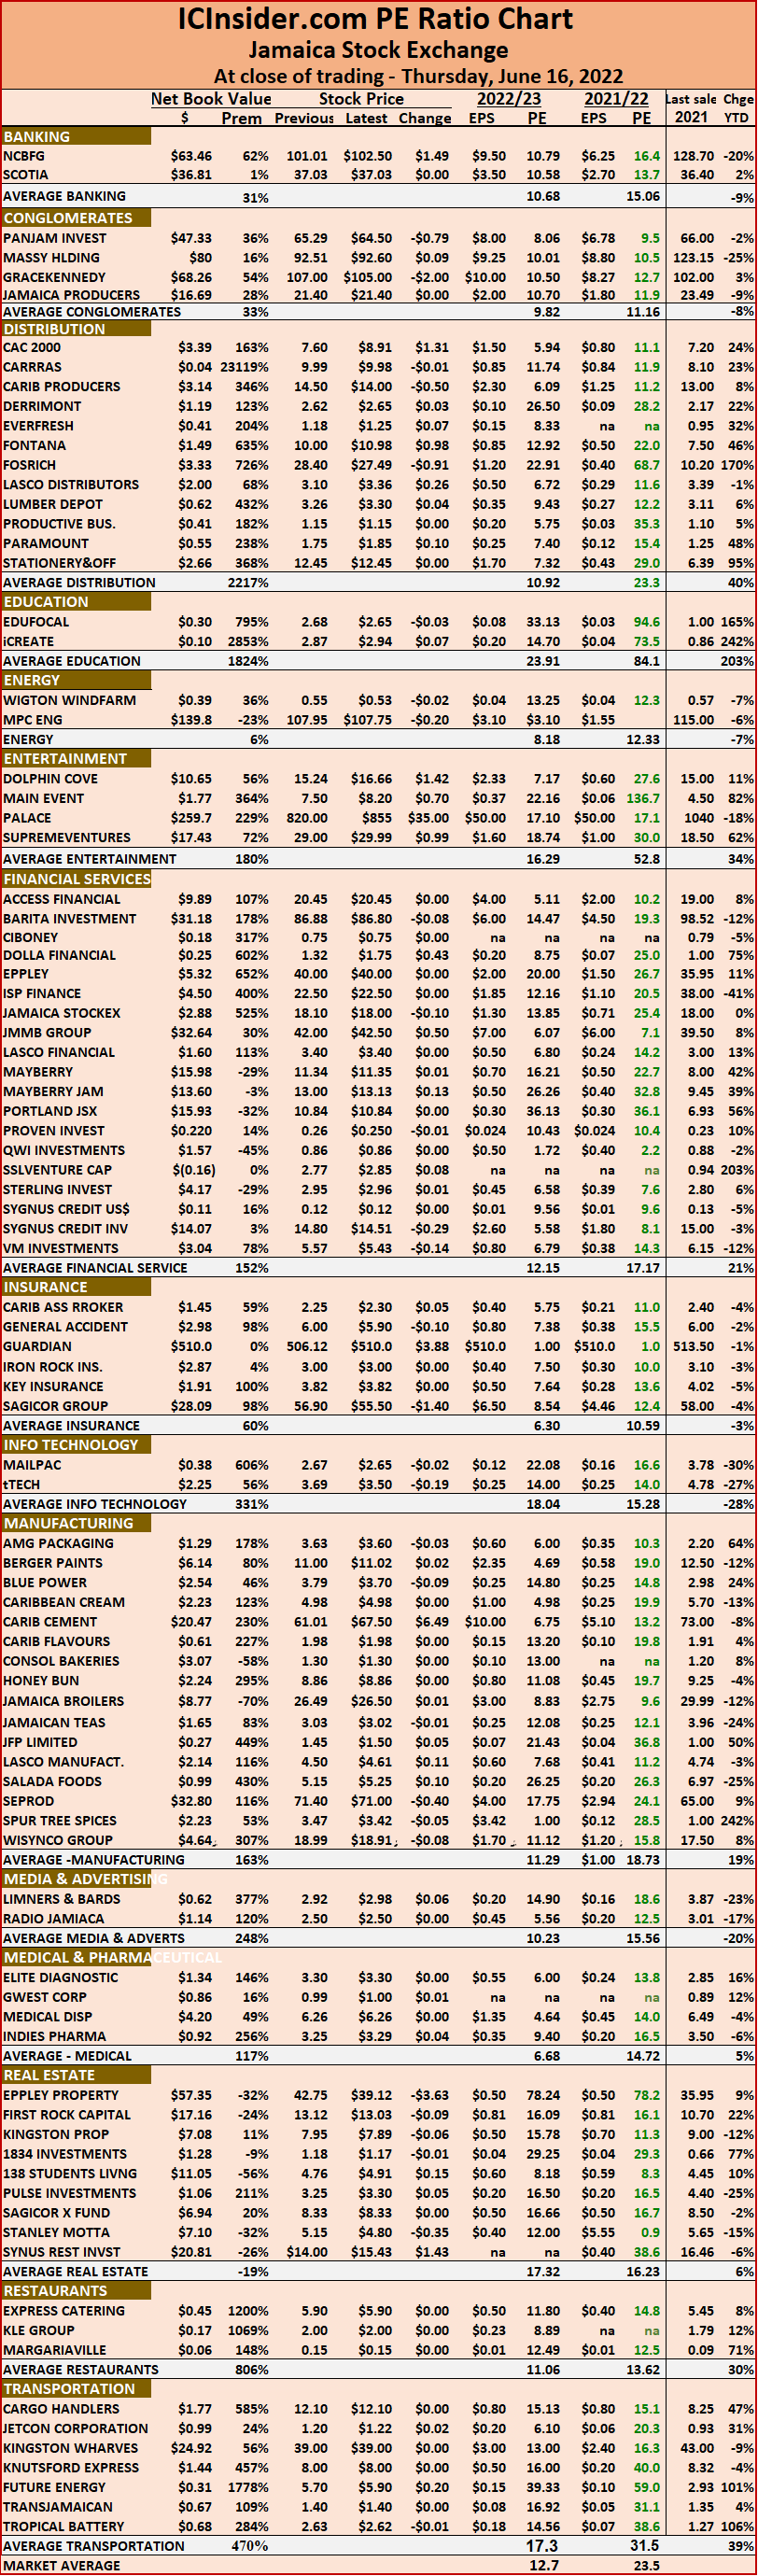
The net asset value of each company is reported as a guide to assess the value of stocks based on this measure quickly. The chart also shows daily changes in stock prices and the percentage year to date price movement based on the last traded prices. Dividends payable and yields for each company are shown in the Main and Junior Markets’ daily report charts that show the closing volume for the bids and offers.
The EPS & PE ratios are based on 2021 and 2022 actual or projected earnings, excluding major one off items. The PE Ratio is the most popular measure used to determine the value of stocks.

Dolla Financial up 75% in two days

On the second day of trading, Dolla Financial opened trading at the maximum 30 percent increase permitted to $1.72, with trading halted for an hour with the maximum for the day recomputed to $1.75, based on the change in the reference price to $1.52 from which it could trade up to 15 percent to $1.75 for the day, where it closed.
Trading ended with 365,000 shares trading, with bids to buy 100 million shares at $1.75 seconds before the close, with 200,000 on the offer at $1.92 and 1 million at $1.94. In short, there is not a great deal of selling below $3, but that may change on Friday.
At the close of trading, the Junior Market rose moderately, while the Main Market, and USD market all slipped moderately, with the JSE Combined Index falling 990.81 points to close at 394,099.84.
The All Jamaican Composite Index lost 1,238.51 points to 436,372.59, the JSE Main Index fell 1,477.94 points to 381,852.85, the Junior Market index rose 43.54 points to 4,121.50 and the SE USD market index dipped 3.42 points to close at 214.52.
Investors exchanged 18,381,484 shares in all markets, with the value of stocks traded in the Main and Junior Markets jumped to $513.2 million and in the JSE USD market, US$12,579.
The market’s PE ratio ended at 23.5 based on 2021-22 earnings and 12.7 times those for 2022-23 at the close of trading.
Investors need a series of measures and pertinent information to successfully navigate many investment choices, in the local stock market. The ICInsider.com PE ratio chart and the more detailed daily report charts provide investors with regularly updated information to help with decision-making.
Investors should use the chart to help make rational investment decisions by investing in stocks that are close to the average for the sector and not going too far from it unless there are compelling reasons to do so. This approach helps to take emotions out of the investment decision and put in on fundamentals while at the same time not being too far from the majority of investors. Investors who buy when the price of a stock is close to the average will find that they are not inclined to overpay for a stock.
The ICInsider.com PE Ratio chart covers all ordinary shares listed on the Jamaica Stock Exchange. It shows companies grouped on an industry basis, allowing easy comparisons between the same sector companies and the overall market.

The net asset value of each company is reported as a guide to assess the value of stocks based on this measure quickly. The chart also shows daily changes in stock prices and the percentage year to date price movement based on the last traded prices. Dividends payable and yields for each company are shown in the Main and Junior Markets’ daily report charts that show the closing volume for the bids and offers.
The EPS & PE ratios are based on 2021 and 2022 actual or projected earnings, excluding major one off items. The PE Ratio is the most popular measure used to determine the value of stocks.


JSE markets in consolidation mode

Trading on the Jamaica Stock Exchange on Tuesday ended in consolidation mode with moderate movements in market indices as investors sit on the sideline until closer to the major release of results towards the end of July when the first set should start appearing.  At the close of trading, the Main and USD Indices fell and Junior Market rose moderately, with the JSE Combined Index falling 1,393.72 points to close at 395,485.31.
The All Jamaican Composite Index shed 2,221.13 points to 437,943.69, the JSE Main Index fell 1,733.32 points to 383,550.61, the Junior Market index rose 25.80 points to 4,099.01 and the SE USD market index slipped 1.51 points to close at 218.97.
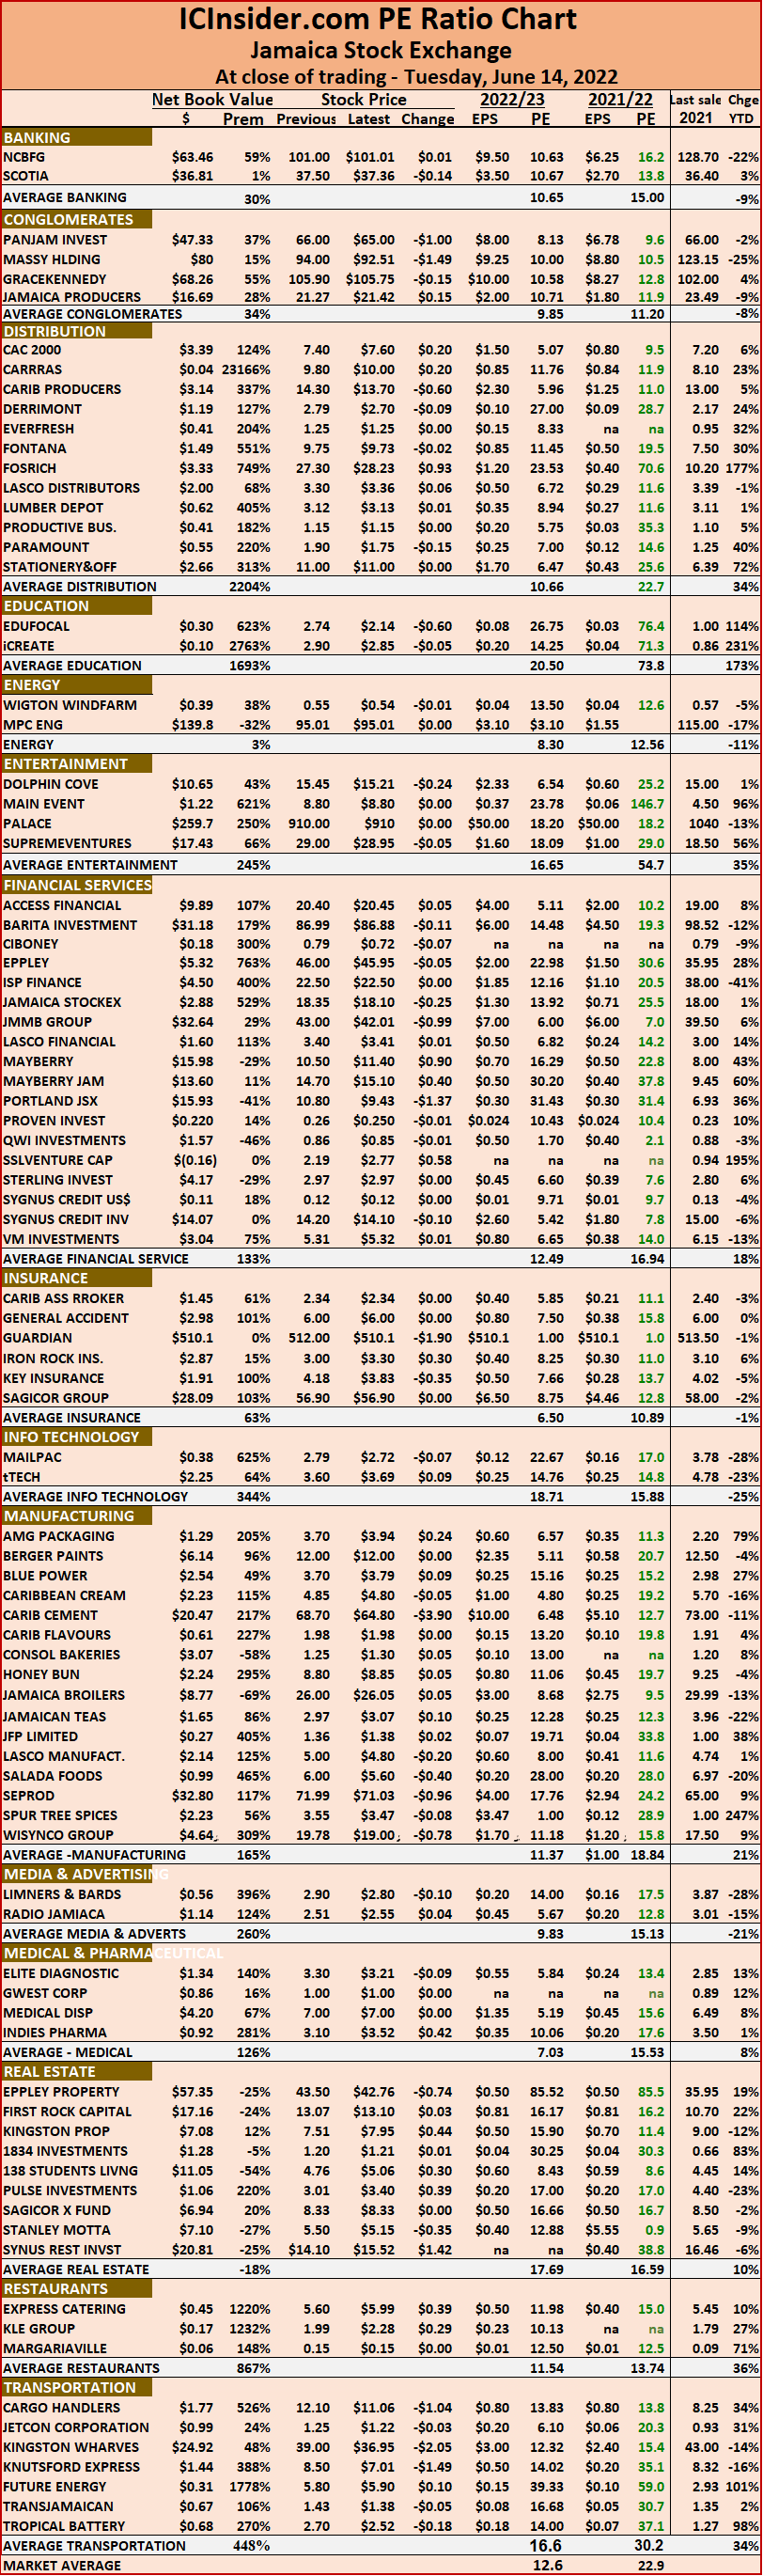
Investors exchanged 18,817,878 shares in all markets, with the value of stocks traded in the Main and Junior Markets amounting to $139.50 million and in the JSE USD market, US$15,551.
The market’s PE ratio ended at 22.9 based on 2021-22 earnings and 12.6 times those for 2022-23 at the close of trading.
Investors need a series of measures and pertinent information to successfully navigate the many investment choices in the local stock market. The ICInsider.com PE ratio chart and the more detailed daily report charts provide investors with regularly updated information to help with decision-making.
Investors should use the chart to help make rational investment decisions by investing in stocks that are close to the average for the sector and not going too far from it unless there are compelling reasons to do so. This approach helps to take emotions out of the investment decision and put in on fundamentals while at the same time not being too far from the majority of investors. Investors who buy when the price of a stock is close to the average will find that they are not inclined to overpay for a stock.
The ICInsider.com PE Ratio chart covers all ordinary shares listed on the Jamaica Stock Exchange. It shows companies grouped on an industry basis, allowing easy comparisons between the same sector companies and the overall market.

The net asset value of each company is reported as a guide to assess the value of stocks based on this measure quickly. The chart also shows daily changes in stock prices and the percentage year to date price movement based on the last traded prices. Dividends payable and yields for each company are shown in the Main and Junior Markets’ daily report charts that show the closing volume for the bids and offers.
The EPS & PE ratios are based on 2021 and 2022 actual or projected earnings, excluding major one off items. The PE Ratio is the most popular measure used to determine the value of stocks.

Modest changes to JSE market indices – Monday

Trading on the Jamaica Stock Exchange on Monday ended with more declines in Main and Junior markets, with a marginal increase in the JSE USD market, with the JSE Combined Index slipping 1,350.76 points rally to close at 396,879.03.
The All Jamaican Composite Index shed just 44.74 points to 440,164.82, the JSE Main Index fell 1,246.97 points to close at 385,283.93, the Junior Market index slipped 20.65 points to 4,073.21 and the SE USD market index added a mere 0.09 points to close at 220.48.
Investors exchanged 18,885,506 shares in all markets, with the value of stocks traded in the Main and Junior Markets amounting to $499.50 million and in the JSE USD market, US$4,111.
The market’s PE ratio ended at 23.9 based on 2021-22 earnings and 12.9 times those for 2022-23 at the close of trading.
Investors need a series of measures and pertinent information to successfully navigate the many investment choices in the local stock market. The ICInsider.com PE ratio chart and the more detailed daily report charts provide investors with regularly updated information to help with decision-making.
Investors should use the chart to help make rational investment decisions by investing in stocks that are close to the average for the sector and not going too far from it unless there are compelling reasons to do so. This approach helps to take emotions out of the investment decision and put in on fundamentals while at the same time not being too far from the majority of investors. Investors who buy when the price of a stock is close to the average will find that they are not inclined to overpay for a stock.
The ICInsider.com PE Ratio chart covers all ordinary shares listed on the Jamaica Stock Exchange. It shows companies grouped on an industry basis, allowing easy comparisons between the same sector companies and the overall market.

The net asset value of each company is reported as a guide to assess the value of stocks based on this measure quickly. The chart also shows daily changes in stock prices and the percentage year to date price movement based on the last traded prices. Dividends payable and yields for each company are shown in the Main and Junior Markets’ daily report charts that show the closing volume for the bids and offers.
The EPS & PE ratios are based on 2021 and 2022 actual or projected earnings, excluding major one off items. The PE Ratio is the most popular measure used to determine the value of stocks.


Rule changes likely at JSE

Investors have been agitating about the circuit breaker that seems to have stimulated the Jamaica Stock Exchange into action. Feedback received by this publication, suggests that investors could see changes in the length of time the freeze in trading last, with the possibility that it could drop from the current one hour to a lesser period.
The stock exchange is definitely not going to remove the circuit breaker Marlene Street-Forrest advises. That seems to be supported by the findings of the World Federation of Exchanges research that found, “on average, stock returns stabilize, selling pressure resolves, and prices become more informative after trading resumes from the market-wide trading halts.”
The report also states that a recent survey by the World Federation of Exchanges indicates that a large majority – 86 percent of exchanges in the world have circuit breakers, although their design and calibration vary to answer the needs of different individual market structures.
But the JSE is undertaking studies to garner pertinent information on the triggering of the circuit breaker in the past that can be used to guide decision making in any change to the rules.
It could be that the exchange may do away with the two tiered rule of 15 percent and 30 percent and instead have just a 30 percent limit that could sharply reduce the high number of interruptions that occurred over the past three months, primarily in the Junior Market that has been much more bullish than the main market.
The Exchange is also looking at the possibility of extending trading hours, which could well add an hour to the current trading session, feedback from the exchange suggest, bringing the local exchanges more in line with many exchanges worldwide. This may well be merited with the increasing number of listings on the market with the possibility that there could be another six added listings during the rest of the year, in addition to the imminent listing of Dolla Financial.
No timeline seems to be set for the above changes, but it could well take place before the year ends if approved by the JSE board.