The Junior Market made another solid move on Friday to close out April on a high, after gaining 42.27 points to end the week and month at a new record close of 4,451.62, after hitting a record high for the day of 4,462.92, within 18 minutes of the market’s opening. The Main Market had more gains and the JSE USD market rose at the close. The JSE Combined Index added 608.23 points to close at 415,756.52.
 The All Jamaican Composite Index added 608.23 points to settle at 459,174.28, the JSE Main Index rose 658.05 points to end at 401,858.38 and the JSE USD market index rose points just 1.35 points to 226.55.
Trading ended with 26,082,950 shares changing hands in all markets. The value of stocks exchanged in the Main and Junior markets amounts to $462.4 million and the JSE USD market traded US$3,165.
The market’s PE ratio ended at 25.5 based on 2021-22 earnings and 14.1 times those for 2022-23 at the close of the Jamaica Stock Exchange.
Investors need a series of measures and pertinent information to successfully navigate the many investment choices in the local stock market. The ICInsider.com PE ratio chart and the more detailed daily report charts provide investors with regularly updated information to help decision-making.
Investors should use the chart to help make rational investment decisions by investing in stocks that are close to the average for the sector and not going too far from it unless there are compelling reasons to do so. This approach helps to take emotions out of the investment decision and put in on fundamentals while at the same time not being too far from the majority of investors. Investors who buy when the price of a stock is close to the average will find that they are not inclined to overpay for a stock.
The ICInsider.com PE Ratio chart covers all ordinary shares listed on the Jamaica Stock Exchange. It shows companies grouped on an industry basis, allowing easy comparisons between the same sector companies and the overall market.
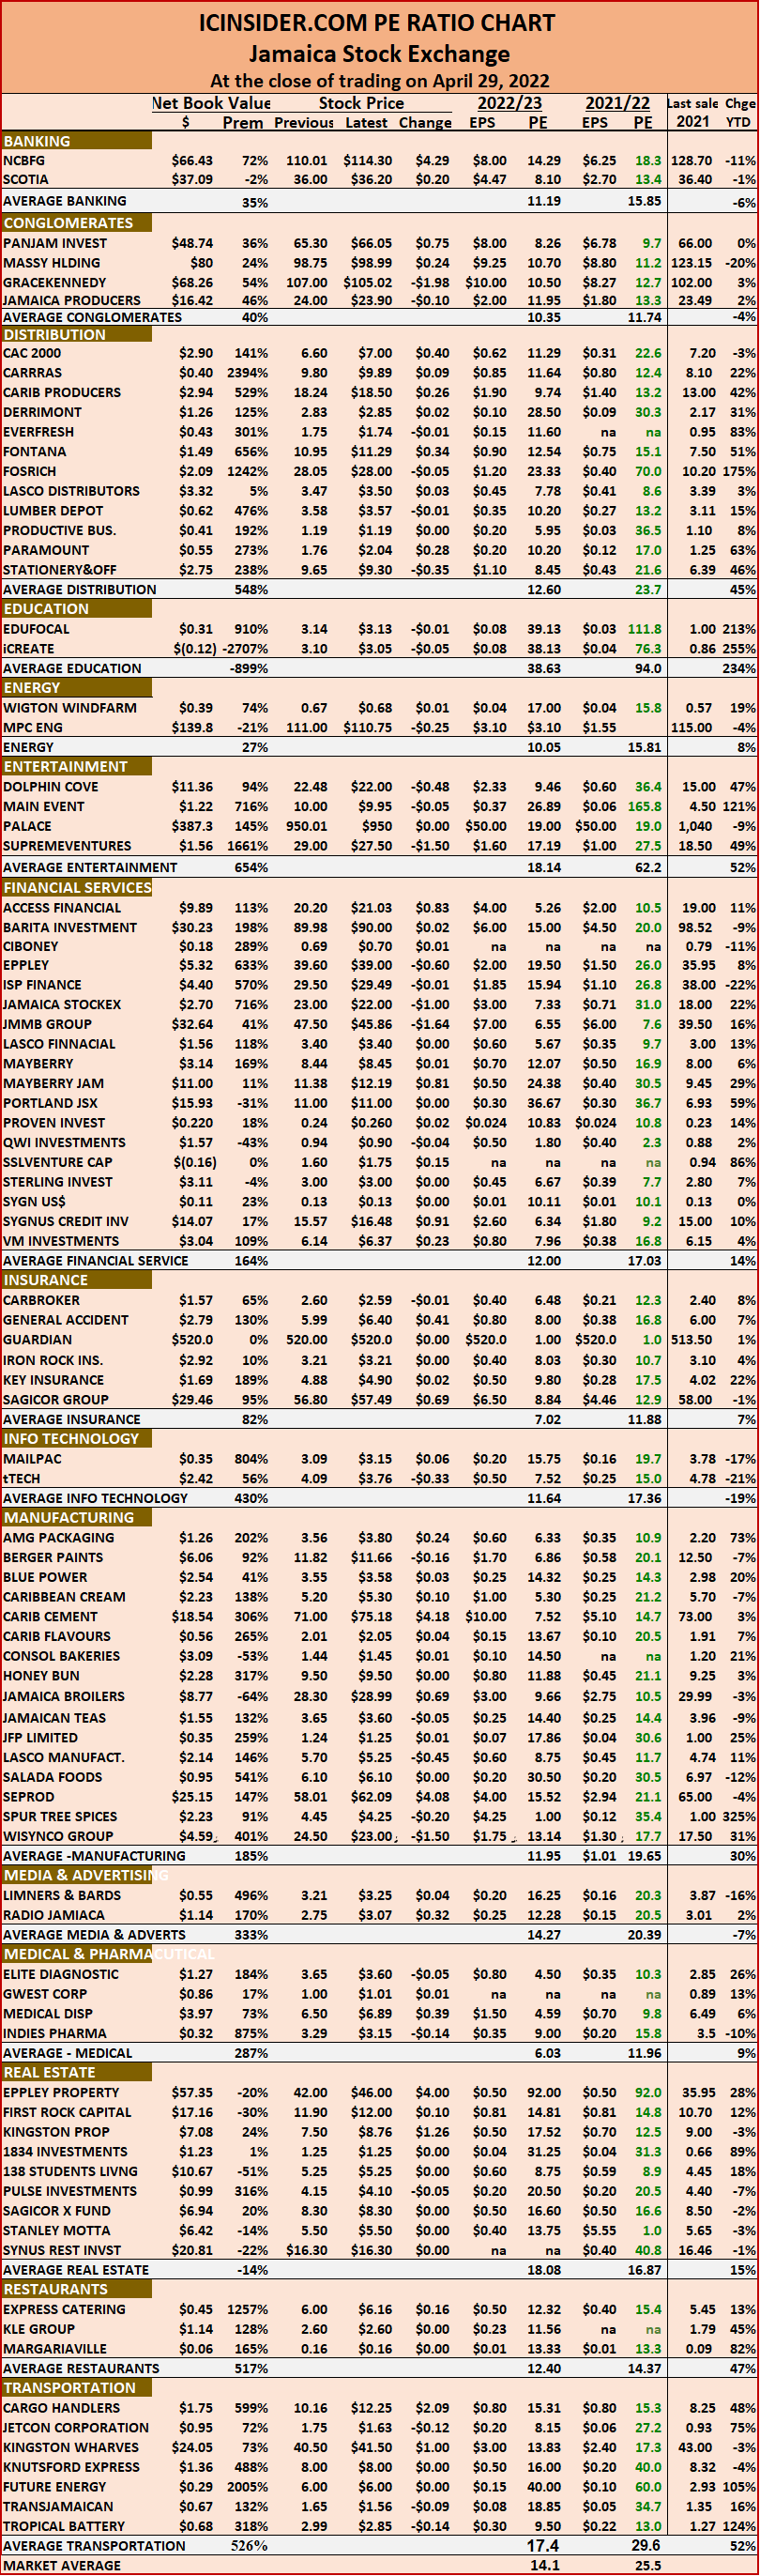 The net asset value of each company is reported as a guide to assess the value of stocks based on this measure quickly. The chart also shows daily changes in stock prices and the percentage year to date price movement based on the last traded prices. Dividends payable and yields for each company are shown in the Main and Junior Markets’ daily report charts that show the closing volume for the bids and offers.
The EPS & PE ratios are based on 2021 and 2022 actual or projected earnings, excluding major one off items. The PE Ratio is the most popular measure used to determine the value of stocks.
 With less than 5 minutes after opening NCB Financial traded at $150 and helped to push the All Jamaican Composite Index (AJI) of the Jamaica Stock Exchange up by 2,821.75 points to a record 450,573.44.
 The main market of the Jamaica Stock Exchange continue to surge forward on Wednesday, with the All Jamaica Composite Index climbing 2,310.44 points to a record 410,763.04 after