Trading closed Friday on the Jamaica Stock Exchange with a fall in the volume of stocks exchanged, with a much higher value than on Thursday, resulting in prices of 34 shares rising, 44 declining and 29 remaining firm. At the end of trading, the Main Market major indices and the Junior Market index rose and the JSE USD Market declined moderately.
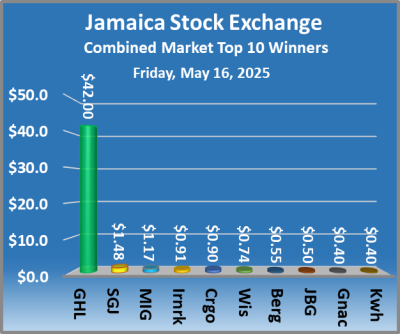 At the close of the market, the JSE Combined Market Index popped 1,575.13 points to 334,126.70, the All Jamaican Composite Index rallied 447.12 points to 369,936.32, the JSE Main Index rose 1,275.19 points to 323,655.85, the Junior Market Index climbed 49.08 points to close at 3,441.44 and the JSE USD Market Index slipped 0.55 points to conclude trading at 246.36.
At the close of trading, 27,044,763 shares were exchanged in all three markets, down from 39,686,285 units on Thursday, with the value of stocks traded on the Junior and Main markets amounted to $221.74 million, up from $178.36 million on the previous day. The JSE USD market closed with an exchange of 818,516 shares for US$25,705, up from just 154,390 units at US$9,049 on Thursday.
In Main Market activity, Transjamaican Highway led the market with 5.76 million shares, followed by Supreme Ventures with 5.63 million stocks and AS Bryden with 1.86 million units.
In Junior Market trading, MFS Capital Partners led with 5.14 million shares, followed by Everything Fresh with 2.04 million stocks and Regency Petroleum with 643,010 units.
In the preference segment, 138 Student Living preference share increased $56.50 to close at $242.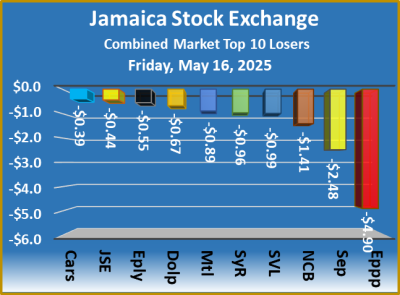 The market’s PE ratio, the most popular measure used to value stocks, ended at 12.6 based on 2024-25 earnings and 19.6 based on 2024 earnings. The ICInsider.com PE ratio chart and the other more detailed daily charts provide investors with regularly updated information to help decision-making. The PE ratio chart covers all ordinary shares listed on the Jamaica Stock Exchange and is grouped by industry, allowing for easy comparison within a sector and the overall market. The earnings per share (EPS) and PE ratios are based on 2024 and 2025 actual or projected earnings, excluding any major one time income or expense.
Pertinent information is required to navigate numerous investment options successfully in the stock market. The chart should be used in making rational decisions when investing in stocks close to the sector average, not going too far from it unless there are compelling reasons to do so. This approach helps to remove emotions from investment decisions and place them on fundamentals while at the same time not being too far from the majority of investors. Investors who buy when the price of a stock is close to the average will find that they are not inclined to overpay for a stock.  The net asset value of each company is incorporated into the chart. Investors can use this measure to assess stock values. The chart also shows daily changes in stock prices and the percentage year to date price movement based on the last traded prices. Dividends that are paid or are due to be paid and yields for each company are shown in the Main and Junior Markets’ daily report charts, along with the closing volume of the highest bid and the lowest offer for each company.
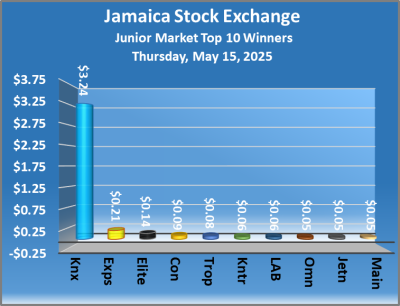 The market closed with the trading of 14,892,052 shares for a value of $29,081,001, from 18,164,035 units at $19,343,788 on Wednesday.
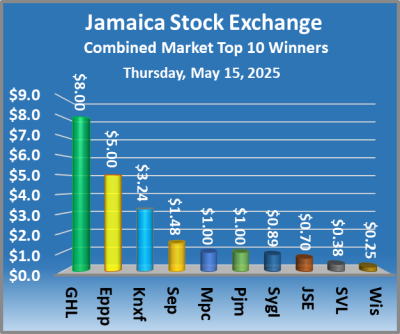
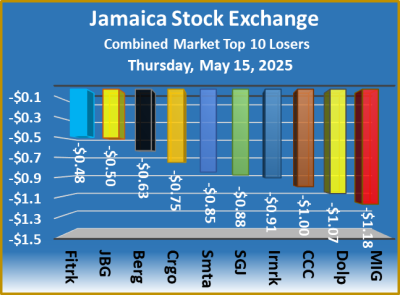
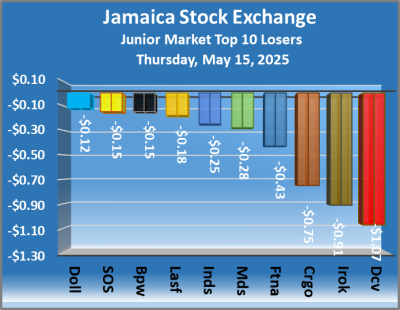 At the close of the market, Atlantic Hardware declined 9 cents to 86 cents after an exchange of 131,794 shares, Blue Power shed 15 cents to end at $5.05 with investors swapping 4,357 units, Cargo Handlers dropped 75 cents to close trading at $10.20 with traders exchanging 58 shares. Consolidated Bakeries rose 9 cents to $1.75 with investors trading 302 stocks, Derrimon Trading lost 10 cents to close at $1.75 in an exchange of 6,708,292 stocks, Dolla Financial dropped 12 cents to finish at $2.34 with 956,545 stock units passing through the market. Dolphin Cove sank $1.07 and ended at $12.50 with an exchange of 20,753 shares, Elite Diagnostic popped 14 cents to $1.40 with 6,297 stock units changing hands, Express Catering climbed 21 cents to finish at $2.75 with traders dealing in 7,000 stocks. Fontana slipped 43 cents to end at $9.05 after an exchange of 102,180 shares, Indies Pharma fell 25 cents in closing at $3.55 with 863,147 stocks clearing the market, Iron Rock Insurance dipped 91 cents to close at $2.99 with investors trading 12,446 units.
 Kintyre Holdings increased 6 cents to 35 cents with 574,737 shares being traded, Knutsford Express advanced $3.24 to $14.44, after 597 shares crossed the market, Lasco Financial skidded 18 cents to end at $1.62 with a transfer of 1,000,341 stock units. Limners and Bards rose 6 cents in closing at $1.16 as investors traded 3,500 stocks, Medical Disposables sank 28 cents and ended at $1.44 with 3,036 stocks crossing the market. ONE on ONE Educational dipped 7 cents to finish at 83 cents after a transfer of 177,133 stocks. RA Williams fell 7 cents to 51 cents with 358,700 units crossing the exchange. Stationery and Office Supplies dropped 15 cents to close at $1.44 after trading of 191,236 shares and Tropical Battery gained 8 cents to end at $2 as investors exchanged 624,083 stock units.
 Prices of securities trading are those for the last transaction of each stock unless otherwise stated.
 At the close of the market, the JSE Combined Market Index advanced 319.32 points to 332,551.57, the All Jamaican Composite Index shed 597.24 points to end at 369,489.20, the JSE Main Index rallied 474.82 points to 322,380.66, the Junior Market Index dropped 17.61 points to finish at 3,392.36 and the JSE USD Market Index popped 2.22 points to 246.91.
 The market’s PE ratio, the most popular measure used to value stocks, ended at 12.6 based on 2024-25 earnings and 19.7 based on 2024 earnings. The ICInsider.com PE ratio chart and the other more detailed daily charts provide investors with regularly updated information to aid in decision-making. The PE ratio chart covers all ordinary shares listed on the Jamaica Stock Exchange, grouped by industry, allowing for easy comparisons within a sector and the overall market. The earnings per share (EPS) and PE ratios are based on 2024 and 2025 actual or projected earnings, excluding any major one time income or expense.
 The net asset value of each company is incorporated into the chart. Investors can use this measure to assess stock values. The chart also shows daily changes in stock prices and the percentage year to date price movement based on the last traded prices. Dividends that are paid or are due to be paid and yields for each company are shown in the Main and Junior Markets’ daily report charts, along with the closing volume of the highest bid and the lowest offer for each company.
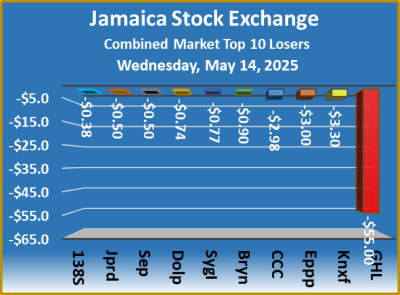
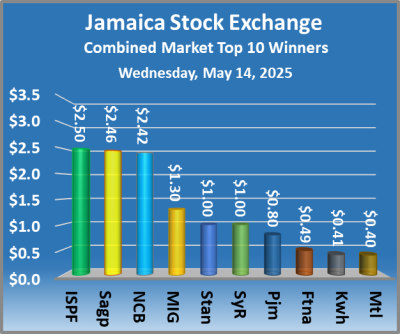 At the close of the market, the JSE Combined Market Index dropped 2,730.36 points to wrap up trading at 332,232.25, the All Jamaican Composite Index slipped 86.43 points to 370,086.44, the JSE Main Index shed 2,480.82 points to settle at 321,905.84, the Junior Market Index lost 48.82 points to 3,409.97 and the JSE USD Market Index skidded 2.83 points to settle at 244.69.
 The market’s PE ratio, the most popular measure used to value stocks, ended at 12.7 based on 2024-25 earnings and 19.5 based on 2024 earnings.
 Investors who buy when the price of a stock is close to the average will find that they are not inclined to overpay for a stock. The net asset value of each company is incorporated into the chart. Investors can use this measure in assessing stock values. The chart also shows daily changes in stock prices and the percentage year to date price movement based on the last traded prices. Dividends that are paid or are due to be paid and yields for each company are shown in the Main and Junior Markets’ daily report charts, along with the closing volume of the highest bid and the lowest offer for each company.
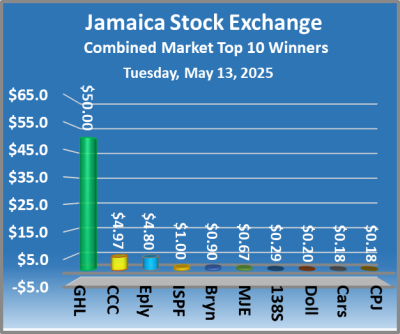 At the close of the market, the JSE Combined Market Index rallied 305.99 points to 334,962.61, the All Jamaican Composite Index fell 1,626.79 points to 370,172.87, the JSE Main Index rose 450.89 points to end at 324,386.66, the Junior Market Index dipped 16.36 points to 3,458.79 and the JSE USD Market Index popped 1.74 points to settle at 247.52. At the close of trading, 24,470,893 shares were exchanged in all three markets, up from 15,361,463 units on Monday, with the value of stocks traded on the Junior and Main markets amounted to $95.02 million, up from $50.72 million on the previous day and the JSE USD market closed with an exchange of 134,176 shares for US$5,186, down from 329,701 units at US$12,304 on Monday.
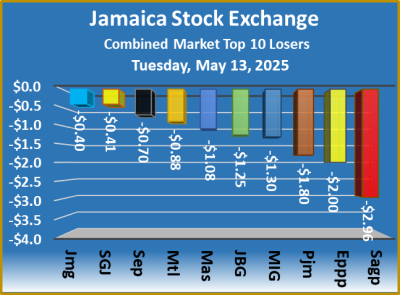 In the preference segment, Eppley 7.25% preference share shed $2.49 to end at $18, 138 Student Living preference share dropped $8.65 in closing at $233 and Sygnus Credit Investments 10% dipped $2 to $102. The market’s PE ratio, the most popular measure used to value stocks, ended at 13 based on 2024-25 earnings and 19.9 based on 2024 earnings. The ICInsider.com PE ratio chart and the other more detailed daily charts provide investors with regularly updated information to help decision-making. The PE ratio chart covers all ordinary shares listed on the Jamaica Stock Exchange, grouped by industry, allowing for easy comparisons within a sector and the overall market. The earnings per share (EPS) and PE ratios are based on 2024 and 2025 actual or projected earnings, excluding any major one time income or expense. Pertinent information is required to navigate numerous investment options successfully in the stock market. The chart should be used in making rational decisions when investing in stocks close to the sector average, not going too far from it unless there are compelling reasons to do so.
 This approach helps to remove emotions from investment decisions and place them on fundamentals while at the same time not being too far from the majority of investors. Investors who buy when the price of a stock is close to the average will find that they are not inclined to overpay for a stock. The net asset value of each company is incorporated into the chart. Investors can use this measure in assessing stock values. The chart also shows daily changes in stock prices and the percentage year to date price movement based on the last traded prices. Dividends that are paid or are due to be paid and yields for each
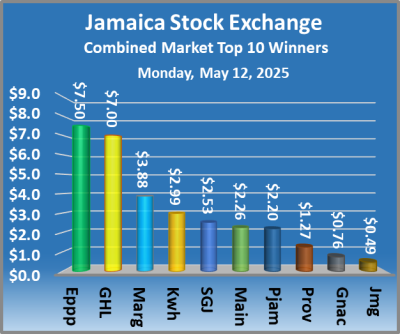 At the close of the market, the JSE Combined Market Index popped 1,084.25 points to settle at 334,656.62, the All Jamaican Composite Index rose a solid 1,043.56 points to 371,799.66, the JSE Main Index climbed 996.82 points to 323,935.77, the Junior Market Index rallied by 17.92 points to 3,475.15 and the JSE USD Market Index dipped 1.23 points to 245.78.
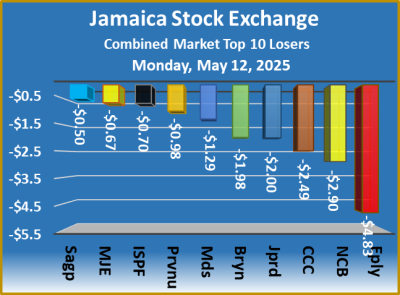 The market’s average PE ratio, the most popular measure used to value stocks, ended at 13.3 based on 2024-25 earnings and 20.1 based on 2024 earnings. The ICInsider.com PE ratio chart and the other more detailed daily charts provide investors with regularly updated information to help decision-making. The PE ratio chart covers all ordinary shares listed on the Jamaica Stock Exchange, grouped by industry to allow for easy comparisons within a sector and the overall market. The earnings per share (EPS) and PE ratios are based on 2024 and 2025 actual or projected earnings, excluding any major one time income or expense.
 Investors who buy when the price of a stock is close to the average will find that they are not inclined to overpay for a stock. The net asset value of each company is incorporated into the chart. Investors can use this measure to assess stock values. The chart also shows daily changes in stock prices and the percentage year to date price movement based on the last traded prices. Dividends that are paid or are due to be paid and yields for each company are shown in the Main and Junior Markets’ daily report charts, along with the closing volume of the highest bid and the lowest offer for each company.
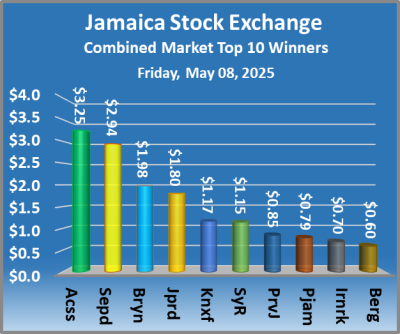 At the close of the market, the JSE Combined Market Index climbed 733.99 points to end at 333,572.37, the All Jamaican Composite Index popped 223.61 points higher to wrap up trading at 370,756.10, the JSE Main Index rallied 578.46 points to settle at 322,938.95, the Junior Market Index gained 24.29 points to 3,457.23 and the JSE USD Market Index shed 1.19 points to finish at 247.01.
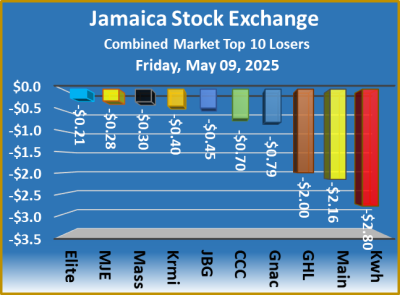 The market’s PE ratio, the most popular measure used to value stocks, ended at 12.7 based on 2025-26 earnings and 18.6 based on 2024-25 historical earnings. The ICInsider.com PE ratio chart and the other more detailed daily charts provide investors with regularly updated information to help decision-making. The PE ratio chart covers all ordinary shares listed on the Jamaica Stock Exchange, grouped by industry, allowing for easy comparisons within a sector and the overall market. The earnings per share (EPS) and PE ratios are based on 2024 and 2025 actual or projected earnings, excluding any major one time income or expense.
 The net asset value of each company is incorporated into the chart. Investors can use this measure to assess stock values. The chart also shows daily changes in stock prices and the percentage year to date price movement based on the last traded prices. Dividends that are paid or are due to be paid and yields for each company are shown in the Main and Junior Markets’ daily report charts, along with the closing volume of the highest bid and the lowest offer for each company.
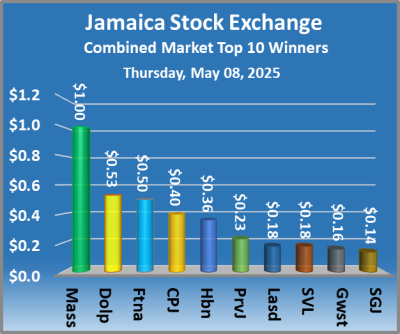 At the close of the market, the JSE Combined Market Index fell 2,080.68 points to wrap up trading at 332,838.38, while the All Jamaican Composite Index dropped 2,211.66 points to end at 370,532.49, the JSE Main Index skidded 2,055.72 points to settle at 322,360.49, the Junior Market Index shed 16.34 points to 3,432.94 and the JSE USD Market Index rose 0.27 points higher to end at 248.20.
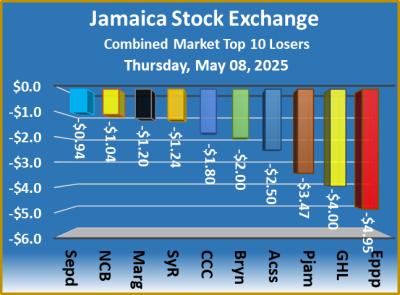 The market’s PE ratio, the most popular measure used to value stocks, ended at 12.7 based on 2024-25 earnings and 18.8 based on 2024 earnings.
 The net asset value of each company is incorporated into the chart. Investors can use this measure in assessing stock values. The chart also shows daily changes in stock prices and the percentage year to date price movement based on the last traded prices. Dividends that are paid or are due to be paid and yields for each company are shown in the Main and Junior Markets’ daily report charts, along with the closing volume of the highest bid and the lowest offer for each company.
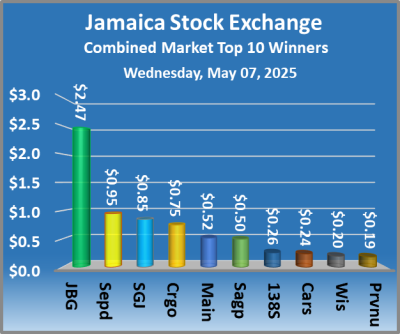 At the close of the market, the JSE Combined Market Index dipped 683.98 points to end at 334,919.06, the All Jamaican Composite Index declined by 148.80 points to wrap up trading at 372,744.15, the JSE Main Index sank 634.02 points to finish at 324,416.21, the Junior Market Index fell 10.65 points to settle at 3,449.28 and the JSE USD Market Index advanced 8.84 points to 247.93.
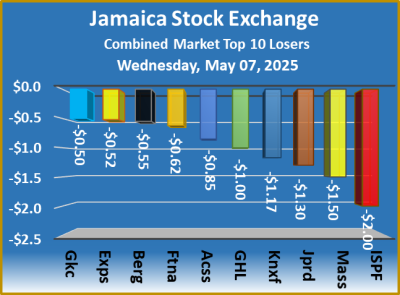 The market’s PE ratio, the most popular measure used to value stocks, ended at 13 based on 2024-25 earnings and 19.2 based on 2024 earnings. The ICInsider.com PE ratio chart and the other, more detailed daily charts provide investors with updated information to help decision-making. The PE ratio chart covers all ordinary shares listed on the Jamaica Stock Exchange, grouped by industry, allowing for easy comparisons within a sector and the overall market. The earnings per share (EPS) and PE ratios are based on 2024 and 2025 actual or projected earnings, excluding any major one time income or expense.
 The net asset value of each company is incorporated into the chart. Investors can use this measure in assessing stock values. The chart also shows daily changes in stock prices and the percentage year to date price movement based on the last traded prices. Dividends that are paid or are due to be paid and yields for each company are shown in the Main and Junior Markets’ daily report charts, along with the closing volume of the highest bid and the lowest offer for each company.
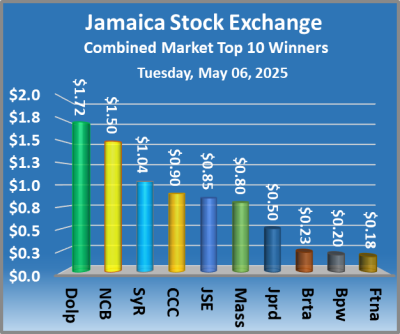 At the close of the market, the JSE Combined Market Index slipped 1,444.01 points to wrap up trading at 335,603.04, the All Jamaican Composite Index sank 1,253.96 points to 372,892.95, the JSE Main Index dropped 1,351.13 points to conclude trading at 325,050.23, the Junior Market Index slipped 20.88 points to end at 3,459.93 and the JSE USD Market Index popped 9.21 points to settle at 239.09.
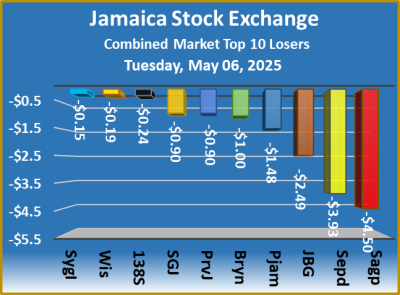 The market’s PE ratio, the most popular measure used to value stocks, ended at 13 based on 2024-25 earnings and 19.5 based on 2024 historical earnings. The ICInsider.com PE ratio chart and the other more detailed daily charts provide investors with regularly updated information to help decision-making. The PE ratio chart covers all ordinary shares listed on the Jamaica Stock Exchange, grouped by industry, allowing for easy comparisons within a sector and the overall market. The earnings per share (EPS) and PE ratios are based on 2024 and 2025 actual or projected earnings, excluding any major one time income or expense.
 Investors who buy when the price of a stock is close to the average will find that they are not inclined to overpay for a stock. The net asset value of each company is incorporated into the chart. Investors can use this measure in assessing stock values. The chart also shows daily changes in stock prices and the percentage year to date price movement based on the last traded prices. Dividends that are paid or are due to be paid and yields for each company are shown in the Main and Junior Markets’ daily report charts, along with the closing volume of the highest bid and the lowest offer for each company.