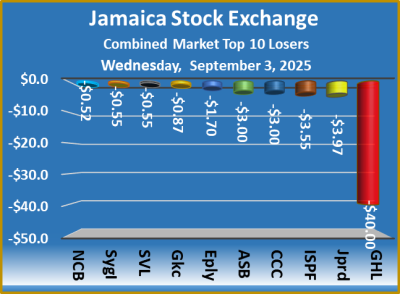
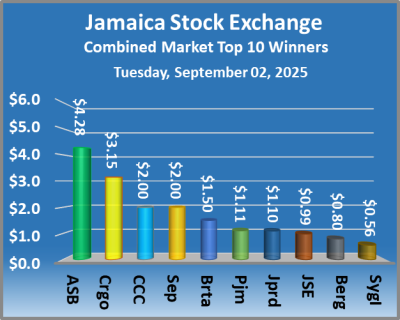
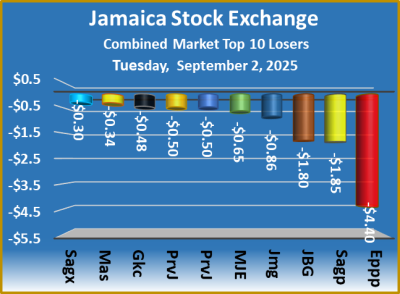
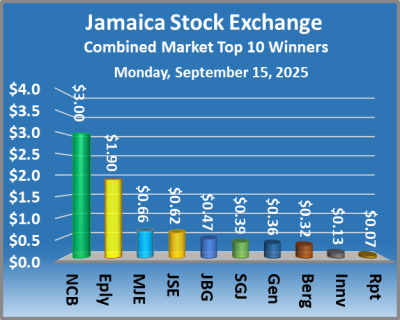
NCB makes a solid recovery


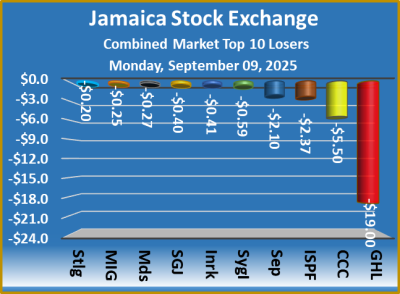
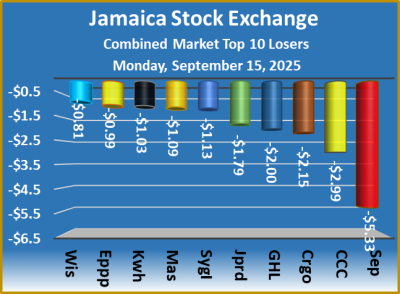
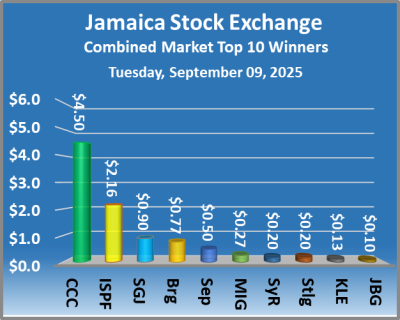
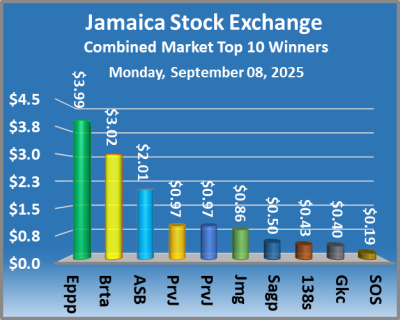
NCB Financial continues to make a B recovery, on the Jamaica Stock Exchange, with the stock gaining $3 after closing at $47 on Monday, and is now up Bly by 71 percent from the recent low of $27.50 on August 4, helping drive the major indices of the Main Market higher, while the Junior Market index declined and the JSE USD Market popped higher. At the end of trading, the prices of 26 shares rose, 63 declined and 26 remained firm.
At the close of the market, the JSE Combined Market Index popped 418.63 points higher to 328,594.09, the All Jamaican Composite Index rallied 743.81 points to end at 368,332.06, the JSE Main Index gained 541.83 points to settle at 318,501.75, the Junior Market Index lost 14.07 points to 3,353.41 and the JSE USD Market Index gained 0.58 points to 205.43.
Trading closed on Monday with a decline in the volume of stocks exchanged, with a lower value than on Friday, with 14,136,447 shares trading in all three markets, down from 34,173,098 units on Friday, resulting in the value of stocks traded on the Junior and Main markets amounted to $157.71 million, down from $200.62 million on the previous day. The JSE USD market closed with an exchange of 61,580 shares for US$21,533 compared to 102,680 units at US$6,965 on Friday.
In Main Market activity, Transjamaican Highway led trading with 3.36 million shares, followed by Wisynco Group with 1.94 million stock units and QWI Investments with 1.16 million units.
In Junior Market trading, Kintyre Holdings led with 681,240 shares, followed by Spur Tree Spices with 521,773 stock units and GWest Corporation with 470,430 units.
In the preference segment, Jamaica Public Service 9.5% sank $299 to $2,300, Productive Business Solutions 10.5% slipped $137.90 to end at $1,002 and Sygnus Credit Investments 10% lost $4.90 in closing at $100.
The market’s PE ratio, the most popular measure used to value stocks, ended at 13.2 based on 2025-26 earnings and 15.9 based on 2024-25 historical earnings.
The ICInsider.com PE ratio chart and the other detailed daily charts provide regularly updated information to help with decision-making. The PE ratio chart covers all ordinary shares listed on the Jamaica Stock Exchange, grouped by industry, allowing for easy comparisons within a sector and the overall market. The earnings per share (EPS) and PE ratios are based on 2024 and 2025 actual or projected earnings, excluding any major one time income or expense.
Pertinent information is required to navigate numerous investment options successfully in the stock market. The chart should be used to make rational decisions when investing in stocks that are close to the sector average, not deviating too far from it unless there are compelling reasons to do so. This approach helps to remove emotions from investment decisions and place them on fundamentals, while also staying within the realm of the majority of investors. Investors who buy when the price of a stock is close to the average will find that they are not inclined to overpay for a stock. The net asset value of each company is incorporated into the chart. Investors can use this measure in assessing stock values. The chart also includes daily changes in stock prices and the percentage year to date price movement based on the last traded prices. Dividends that are paid or are due to be paid and yields for each company are shown in the Main and Junior Markets’ daily report charts, along with the closing volume of the highest bid and the lowest offer for each company.

Trading drops on Jamaica Stock Exchange


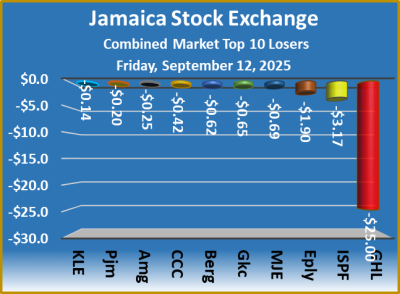
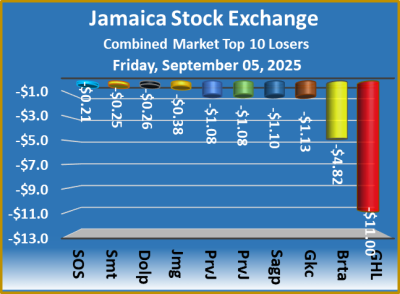
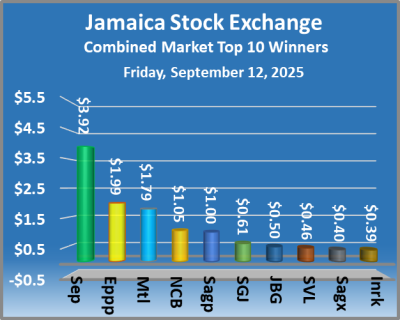
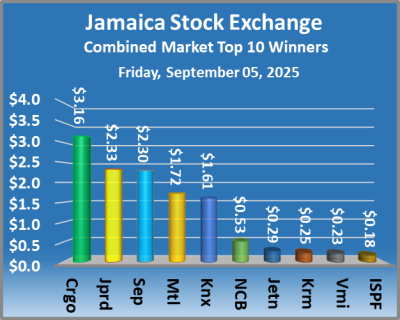
Trading in Transjamaican Highway shares fell by just less than a half on Friday from Thursday’s level on the Jamaica Stock Exchange, resulting in a fall in the volume of stocks changing hands, with a lower value than on Thursday. At the close, the major indices of the Main Market rose, the Junior Market index declined and the JSE USD Market closed higher following a rise in prices of 54 shares, a decline of 30, while 27 remained firm.

At the close of the market, the JSE Combined Market Index rallied 1,073.19 points to finish at 328,175.46, the All Jamaican Composite Index rose 1,663.64 points to conclude trading at 367,588.25, the JSE Main Index jumped by 1,284.45 points to 317,959.92, the Junior Market Index lost 21.97 points to settle at 3,367.48 and the JSE USD Market Index rose 1.08 points to 204.85.
At the close of trading, 34,173,098 shares were exchanged in all three markets, down from 58,489,635 units on Thursday, with the value of stocks traded on the Junior and Main markets amounting to $200.62 million, down from $230.76 million on the previous day. The JSE USD market closed with an exchange of 102,680 shares for US$6,965 compared to 654,501 units at US$127,810 on Thursday.
In Main Market activity, Transjamaican Highway led trading on the market with 26.84 million shares, followed by Lasco Manufacturing with 1.36 million stocks and Wigton Energy with 444,580 units.
In Junior Market trading, Fosrich led with 663,250 shares, followed by Jamaican Teas with 462,380 stocks and MFS Capital Partners with 295,728 units.
In the preference segment, Eppley 7.25% preference share rose $1.39 in closing at $20 and Jamaica Public Service 7% declined $2.90 to $42.
The market’s PE ratio, the most popular measure used to value stocks, ended at 13.4 based on 2025-26 earnings per share and 16.1 based on 2024 historical earnings.
The ICInsider.com PE chart and the more detailed daily charts provide investors with regularly updated information to help decision-making.
The PE chart covers all ordinary shares listed on the Jamaica Stock Exchange, grouped by industry, allowing for easy comparisons within a sector and the overall market. The earnings per share (EPS) and PE ratios are based on 2024 and 2025 actual or projected earnings, excluding any major one time income or expense.
Pertinent information is required to navigate numerous investment options successfully in the stock market. The chart should be used in making rational decisions when investing in stocks close to the sector average, not straying too far from it unless there are compelling reasons to do so. This approach helps to remove emotions from investment decisions and place them on fundamentals, while not being too far from the majority of investors. Investors who buy when the price of a stock is close to the average will find that they are not inclined to overpay for a stock. The net asset value of each company is incorporated into the chart. Investors can use this measure in assessing stock values. The chart also shows daily changes in stock prices and the percentage year to date price movement based on the last traded prices. Dividends that are paid or are due to be paid and yields for each company are shown in the Main and Junior Markets’ daily report charts, along with the closing volume of the highest bid and the lowest offer for each company.

Transjamaican pumps up JSE trading


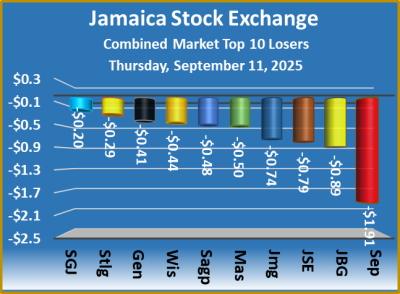
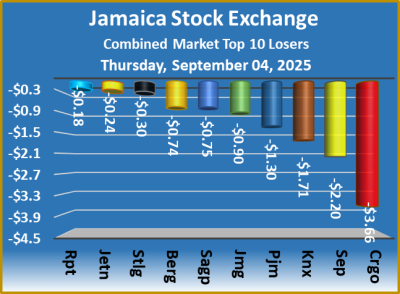
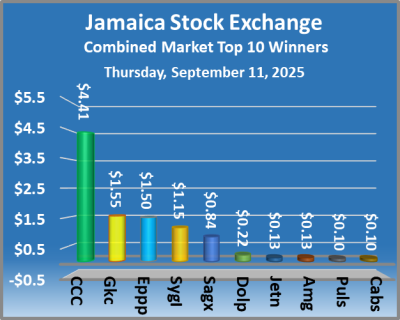
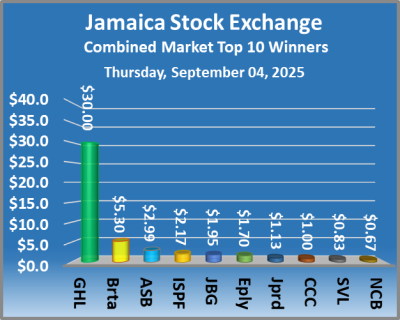
The Jamaica Stock Exchange closed on Thursday, resulting in a sharp rise in the volume and value of stocks exchanged, compared to Wednesday, with Transjamaican Highway dominating trading with 85 percent of the day’s volume. Trading closed with the major indices of all markets declining. At the end of trading, the prices of 37 shares rose, 43 declined and 28 remained firm.

At the close of the market, the JSE Combined Market Index declined by 1,194.22 points to 327,102.27, the All Jamaican Composite Index slipped 160.90 points to finish at 365,924.61, the JSE Main Index shed 1,122.67 points to 316,675.47, the Junior Market Index lost 16.89 points to close at 3,389.45 and the JSE USD Market Index dipped 0.69 points to conclude trading at 203.77.
At the close of trading, 58,489,635 shares were exchanged in all three markets, up from just 10,394,061 units on Wednesday, with the value of stocks traded on the Junior and Main markets amounted to $230.76 million, up from $43.88 million on the previous day and the JSE USD market closed with an exchange of 654,501 shares for US$127,810 compared to 991,036 units at US$40,146 on Wednesday.
In Main Market activity, Transjamaican Highway led with 49.68 million shares, followed by Wigton Energy with 1.33 million stocks and Kingston Wharves with 286,335 units.
In Junior Market trading, Fosrich led with 2.71 million shares, followed by Dolla Financial with 639,384 stocks and Fontana with 293,929 units.
In the preference segment, 138 Student Living preference share dropped $5 to close at $250.
The market’s PE ratio, the most popular measure used to value stocks, ended at 13.3 based on 2025-26 earnings and 16.1 based on 2024 historical earnings. The ICInsider.com PE ratio chart and the other, detailed daily charts provide investors with regularly updated information to assits in decision-making.
The PE ratio chart covers all of the ordinary shares that are listed on Jamaica Stock Exchange, grouped by industry, allowing for easy comparisons within a sector and the overall market. The earnings per share (EPS) and PE ratios are based on 2024 and 2025 actual or projected earnings, excluding any major one time income or expense.
Pertinent information is required to navigate numerous investment options successfully in the stock market. The chart should be used in making rational decisions when investing in stocks close to the sector average, not going too far from it unless there are compelling reasons to do so. This approach helps to remove emotions from investment decisions and place them on fundamentals, while at the same time not being too far from the majority of investors. Investors who buy when the price of a stock is close to the average will find that they are not inclined to overpay for a stock. The net asset value of each company is incorporated into the chart. Investors can use this measure in assessing stock values. The chart also shows daily changes in stock prices and the percentage year to date price movement based on the last traded prices. Dividends that are paid or are due to be paid and yields for each company are shown in the Main and Junior Markets’ daily report charts, along with the closing volume of the highest bid and the lowest offer for each company.
Trading drops on Jamaica Stock Exchange


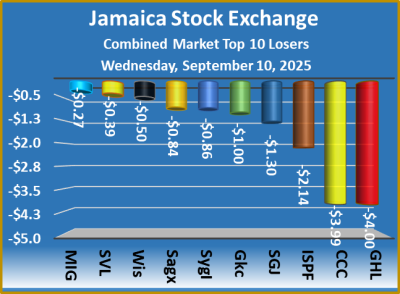
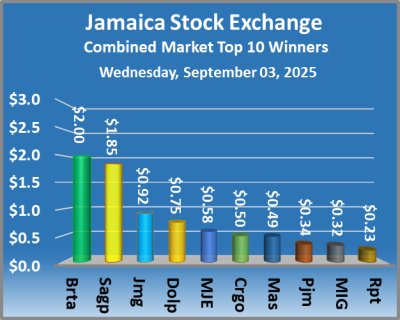
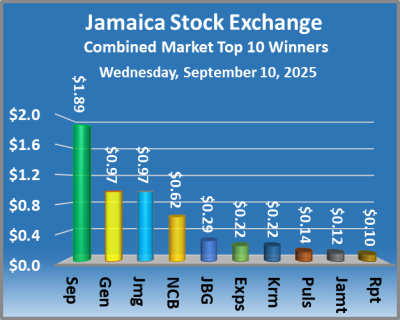
Trading closed Wednesday on the Jamaica Stock Exchange with fewer shares changing hands, with a lower value than on Tuesday, resulting in the major indices of the Main Market rising moderately, the Junior Market index just slipping lower and the JSE USD Market inching marginally higher. At the end of trading, the prices of 33 shares rose, 39 declined and 32 remained firm.

At the close of the market, the JSE Combined Market Index popped 145.27 points to conclude trading at 328,296.49, the All Jamaican Composite Index rose 1,045.43 points to wrap up trading at 366,085.51, the JSE Main Index increased 157.76 points to settle at 317,798.14, the Junior Market Index slipped by just 0.81 points to 3,406.34 and the JSE USD Market Index edged 0.09 points up to 204.46.
At the close of the day’s trading, 10,394,061 shares were exchanged in all three markets, down from 11,984,502 units on Tuesday, with the value of stocks traded on the Junior and Main markets amounted to $43.88 million, down from $59.48 million on the previous day and the JSE USD market closed with an exchange of 991,036 shares for US$40,146 compared to 99,949 units at US$34,172 on Tuesday.
In Main Market activity, Transjamaican Highway was the leading traded stock with 4.09 million units, followed by Sagicor Select Financial Fund with 1.0 million stocks and Radio Jamaica with 575,001 shares.
In Junior Market trading, Future Energy led with 509,675 shares, followed by Indies Pharma with 246,026 stocks and Derrimon Trading with 136,967 units.
The market’s PE ratio, the most popular measure used in valuing stocks, ended at 13.3 based on the 2025-26 earnings and 15.9 based on 2024 historical earnings. The ICInsider.com PE ratio chart and the other, more detailed daily charts provide investors with regularly updated data to help in decision-making. The PE ratio chart covers all ordinary shares listed on the Jamaica Stock Exchange, grouped by industry, allowing for easy comparisons within a sector and the overall market. The earnings per share (EPS) and PE ratios are based on 2024 and 2025 actual or projected earnings, excluding any major one time income or expense.
Pertinent information is required to navigate numerous investment options successfully in the stock market. The chart is a useful guide in making rational decisions when investing in stocks close to the sector average, not straying too far from it, unless there are compelling reasons to do so. This approach helps to remove emotions from investment decisions and place them on fundamentals, while at the same time not being too far from the majority of investors. Investors who buy when the price of a stock is close to the average will find that they are not inclined to overpay for a stock. The net asset value of each company is incorporated into the chart. Investors can use this measure in assessing stock values. The chart also shows daily changes in stock prices and the percentage year to date price movement based on the last traded prices. Dividends that are paid or are due to be paid and yields for each company are shown in the Main and Junior Markets’ daily report charts, along with the closing volume of the highest bid and the lowest offer for each company.
JSE Main & Junior Markets drop


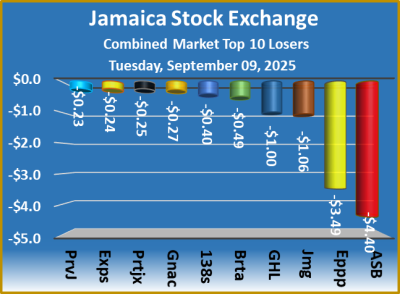
The Jamaica Stock Exchange closed Tuesday following a decline in the value and quantity of stocks traded, compared to Monday, resulting in the major indices of the Main Market ending mixed, the Junior Market index declining and the JSE USD Market rising. At the end of trading, the prices of 41 shares rose, 35 declined and 31 remained firm.

At the close of the market, the JSE Combined Market Index shed 1,030.10 points to end at 328,151.22, the All Jamaican Composite Index gained 493.98 points to finish at 365,040.08, the JSE Main Index sank 837.41 points to 317,640.38, the Junior Market Index dropped 32.22 points to end at 3,407.15 and the JSE USD Market Index rallied 1.13 points to 204.37.
At the close of trading, 11,984,502 shares were exchanged in all three markets, down from 17,244,927 units on Monday, with the value of stocks traded on the Junior and Main markets amounting to $59.48 million, down from $109.27 million on the previous day. The JSE USD market closed with an exchange of 99,949 shares for US$34,172 compared to 142,485 units at US$29,278 on Monday.
In Main Market activity, Transjamaican Highway led with 5.46 million shares, followed by Sagicor Select Financial Fund with 735,326 stocks and Radio Jamaica with 680,000 units.
In Junior Market trading, Kintyre Holdings led with 449,794 shares, followed by One Great Studio with 401,057 stocks and Express Catering with 311,369 stock units.
In the preference segment, 138 Student Living preference share dropped $78.50 and ended at $255.
The market’s PE ratio, the most popular measure used to value stocks, ended at 13.3 based on 2025-26 earnings and 15.9 based on 2024 historical earnings. The ICInsider.com PE ratio chart and the other more detailed daily charts provide investors with regularly updated information to help decision-making. The PE ratio chart covers all ordinary shares listed on the Jamaica Stock Exchange and grouped by industry, allowing for easy comparisons within a sector and the overall market. The earnings per share (EPS) and PE ratios are based on 2024 and 2025 actual or projected earnings, excluding any major one time income or expense.
Pertinent information is required to navigate numerous investment options successfully in the stock market. The chart should be used in making rational decisions when investing in stocks close to the sector average, not going too far from it unless there are compelling reasons to do so. This approach helps to remove emotions from investment decisions and place them on fundamentals while at the same time not being too far from the majority of investors. Investors who buy when the price of a stock is close to the average will find that they are not inclined to overpay for a stock. The net asset value of each company is incorporated into the chart. Investors can use this measure in assessing stock values. The chart also shows daily changes in stock prices and the percentage year to date price movement based on the last traded prices. Dividends that are paid or are due to be paid and yields for each company are shown in the Main and Junior Markets’ daily report charts, along with the closing volume of the highest bid and the lowest offer for each company.
JSE Main Market falls, Juniors rise


The Jamaica Stock Exchange ended trading on Monday with a rise in the volume of stocks exchanged, with a greater value than on Friday, resulting in the major indices of the Main Market declining, the Junior Market index rising and the JSE USD Market declining. At the end of trading, the prices of 34 shares rose, 50 declined and 22 remained firm.

At the close of the market, the JSE Combined Market Index shed 1,950.07 points to end at 329,181.32, the All Jamaican Composite Index declined by 2,630.31 points to 364,546.10, the JSE Main Index slipped 2,144.87 points to 318,477.79, while the Junior Market Index rallied 14.44 points to 3,439.37 and the JSE USD Market Index shed 1.25 points to 203.24.
At the close of the market, 16,034,779 shares were traded in all three markets, up from 13,694,070 units on Friday, with the value of stocks traded on the Junior and Main markets amounting to $86.35 million, up from $66.59 million on the previous day. The JSE USD market closed with an exchange of 142,485 shares for US$29,278 compared to 234,618 units at US$22,007 on Friday.
In Main Market activity, Transjamaican Highway led with 5.39 million shares, followed by Sagicor Select Financial Fund with 1.14 million stocks and Radio Jamaica with 1.01 million stock units.
In Junior Market trading, Kintyre Holdings led with 1.97 million shares, followed by Dolla Financial with 463,498 stocks and Mailpac Group with 288,371 units.
In the preference segment, Jamaica Public Service 7% increased $1.65 to finish at $45 and 138 Student Living preference share climbed $93.50 and ended at $334.
The market’s PE ratio, the most popular measure used to value stocks, ended at 13.6 based on 2025-26 earnings and 16.2 based on 2024-25 historical earnings. The ICInsider.com PE chart and other detailed daily charts provide investors with updated data to help decision-making.
The PE ratio chart covers all the ordinary shares that are listed on the Jamaica Stock Exchange, grouped by industry, allowing for easy comparisons within a sector and the overall market. The earnings per share (EPS) and PE ratios are based on 2024 and 2025 actual or projected earnings, excluding any major one time income or expense.
Pertinent information is required to navigate numerous investment options successfully in the stock market. The chart should be used in making rational decisions when investing in stocks close to the sector average, not going too far from it unless there are compelling reasons to do so. This approach helps to remove emotions from investment decisions and place them on fundamentals, while not being staying too far from the majority of investors. Investors who buy when the price of a stock is close to the average will find that they are not inclined to overpay for a stock. The net asset value of each company is incorporated into the chart. Investors can use this measure in assessing stock values. The chart also shows daily changes in stock prices and the percentage year to date price movement based on the last traded prices. Dividends that are paid or are due to be paid and yields for each company are shown in the Main and Junior Markets’ daily report charts, along with the closing volume of the highest bid and the lowest offer for each company.
Gains for the Jamaica Stock Exchange 


The Jamaica Stock Exchange recorded gains following a rise in the volume and value of stocks traded compared to Thursday, resulting in the major indices of the Main Market, the Junior Market and the JSE USD Market rising. At the end of trading, the prices of 34 shares rose, 41 declined and 31 remained firm.

At the close of the market, the JSE Combined Market Index increased 1,362.05 points to 331,131.39, the All Jamaican Composite Index gained 2,464.41 points to finish at 367,176.41, the JSE Main Index rallied 1,256.26 points to end at 320,622.66, the Junior Market Index increased 22.52 points to finish at 3,424.93 and the JSE USD Market Index popped 1.55 points to end at 204.49.
At the close of trading, 13,694,070 shares were exchanged in all three markets, up from 8,965,784 units on Thursday, with the value of stocks traded on the Junior and Main markets amounted to $66.59 million, up from $35.71 million on the previous day and the JSE USD market closed with an exchange of 234,618 shares for US$22,007 compared to 1,092,929 units at US$65,621 on Thursday.
In Main Market activity, Transjamaican Highway led with 4.23 million shares, followed by Salada Foods with 1.55 million stock units and Sagicor Select Financial Fund with 1.27 million units.
In Junior Market trading, Dolla Financial led with 1.13 million shares, followed by Derrimon Trading with 240,730 stock units and One Great Studio with 221,986 units.
The market’s PE ratio, the most popular measure used to value stocks, ended at 13.4 based on 2025-26 earnings and 16.1, based on 2024 historical earnings. The ICInsider.com PE ratio chart and the more detailed daily charts provide regularly updated data to help in decision-making. The PE ratio chart covers all the ordinary shares on the Jamaica Stock Exchange, grouped by industry, allowing for easy comparisons within a sector and the overall market. The earnings per share (EPS) and PE ratios are based on 2024 and 2025 actual or projected earnings, excluding any major one time income or expense.
Pertinent information is required to navigate numerous investment options successfully in the stock market. The chart should be used in making rational decisions when investing in stocks close to the sector average, not going too far from it unless there are compelling reasons to do so. This approach helps to remove emotions from investment decisions and place them on fundamentals, while at the same time not being too far from the majority of investors. Investors who buy when the price of a stock is close to the average will find that they are not inclined to overpay for a stock. The net asset value of each company is incorporated into the chart. Investors can use this measure in assessing stock values. The chart also includes daily changes in stock prices and the percentage year to date price movement based on the last traded prices. Dividends that are paid or are due to be paid and yields for each company are shown in the Main and Junior Markets’ daily report charts, along with the closing volume of the highest bid and the lowest offer for each company.
Trading dives on Jamaica Stock Exchange 


Trading closed Thursday on the Jamaica Stock Exchange with a fall in the volume and value of stocks switching owners from Wednesday, resulting in the major indices of the Main Market rose, the Junior Market index fell and the JSE USD Market index just popped higher. At the end of trading, the prices of 43 shares rose, 33 declined and 30 remained firm.

At the close of the market, the JSE Combined Market Index rose 1,826.66 points to wrap up trading at 329,769.34, the All Jamaican Composite Index dipped 411.34 points to end at 364,712.00, while the JSE Main Index rose 1,950.74 points to settle at 319,366.40, the Junior Market Index dropped by 5.65 points to 3,402.41 and the JSE USD Market Index increased 0.23 points to 202.94.
At the close, 8,965,784 shares were exchanged in all three markets, down from 20,061,863 units on Wednesday, with the value of stocks traded on the Junior and Main markets amounted to a mere $35.71 million, down from $83.38 million on the previous day and the JSE USD market closed with an exchange of 1,092,929 shares for US$65,621, up from a mere 203,548 units at US$5,046 on Wednesday.
In Main Market activity, Transjamaican Highway led with 1.50 million shares, followed by Sterling Investments with 967,647 stocks and Wigton Energy with 598,612 units.
Junior Market trading was very thin, with Fosrich leading trading with 834,417 shares, followed by Derrimon Trading with 325,218 stocks and Dolla Financial with 200,500 units.
In the preference segment, Eppley 7.75% preference share gained $1.65 to close at $21.
The market’s PE ratio, the most popular measure used to value stocks, ended at 12.8 based on 2025-26 earnings and .16 based on 2024 historical earnings. The ICInsider.com PE ratio chart and the more detailed daily charts provide investors with regularly updated information to help decision-making. The PE ratio chart covers all ordinary shares listed on the Jamaica Stock Exchange, grouped by industry, allowing for easy comparisons within a sector and the overall market. The earnings per share (EPS) and PE ratios are based on 2024 and 2025 actual or projected earnings, excluding any major one time income or expense.
Pertinent information is required to navigate numerous investment options successfully in the stock market. The chart should be used in rational investment decisions, when investing in stocks close to the sector average, not straying too far from it unless there are compelling reasons to do so. This approach helps to remove emotions from investment decisions and place them on fundamentals, while not being too far from the majority of investors. Investors who buy when the price of a stock is close to the average will find that they are not inclined to overpay for a stock. The net asset value of each company is incorporated into the chart. Investors can use this measure in assessing stock values. The chart also includes daily changes in stock prices and the percentage year to date price movement based on the last traded prices. Dividends that are paid or are due to be paid and yields for each company are shown in the Main and Junior Markets’ daily report charts, along with the closing volume of the highest bid and the lowest offer for each company.
Jamaica Stock Exchange markets slip


Trading on the Jamaica Stock Exchange closed on Wednesday with a decline in the volume of stocks exchanged, but with a greater value than on Tuesday, resulting in the major indices of the Main Market declining, along with the Junior Market and the JSE USD Market indices falling. At the end of trading, the prices of 36 shares rose, 39 declined and 24 remained firm.

At the close of the market, the JSE Combined Market Index dropped by 964.70 points to 327,942.68, the All Jamaican Composite Index lost 1,192.33 points to end at 365,123.34, while the JSE Main Index sank 989.06 points to end trading at  317,415.66, the Junior Market Index slipped 2.57 points to 3,408.06 and the JSE USD Market Index dipped by just 0.58 points to 202.71.
At the close of trading, 20,061,863 shares were exchanged in all three markets, down from 21,684,352 units on Tuesday, with the value of stocks traded on the Junior and Main markets amounted to $83.38 million, up from $65.46 million on the previous day and the JSE USD market closed with an exchange of 203,548 shares for US$5,046 well below the 7,320,894 units that traded at US$182,827 on Tuesday.
In Main Market activity, Transjamaican Highway led with 14.13 million shares, followed by Sagicor Select Financial Fund with 1.0 million stocks and Sagicor Select Manufacturing & Distribution Fund with 580,185 units.
In Junior Market trading, Jetcon Corporation led with 533,448 shares, followed by RA Williams with 378,675 stocks and Future Energy with 277,508 units.
The market’s PE ratio, the most popular measure used to value stocks, ended at 13.2 based on 2025-26 earnings and 15.8 based on the 2024 earnings. The ICInsider.com PE ratio chart and the more detailed daily charts provide regularly updated information to help decision-making.
The PE ratio chart covers all ordinary shares listed on the Jamaica Stock Exchange, grouped by industry, allowing for easy comparisons within a sector and the overall market. The earnings per share (EPS) and PE ratios are based on 2024 and 2025 actual or projected earnings, excluding any major one time income or expense.
Pertinent information is required to navigate numerous investment options successfully in the stock market. The chart should be used in making rational decisions when investing in stocks close to the sector average, not going too far from it unless there are compelling reasons to do so. This approach helps to remove emotions from investment decisions and place them on fundamentals, while not being too far from the majority of investors. Investors who buy when the price of a stock is close to the average will find that they are not inclined to overpay for a stock.
The net asset value of each company is incorporated into the chart. Investors can use this measure in assessing stock values. The chart also reflects daily changes in stock prices and the percentage year to date price movement based on the last traded prices. Dividends that are paid or are due to be paid and yields for each company are shown in the Main and Junior Markets’ daily report charts, along with the closing volume of the highest bid and the lowest offer for each company.
Mixed Tuesday trading on the Jamaica Stock Exchange 


Trading ended with mixed results at the close of the Jamaica Stock Exchange on Tuesday, with a near doubling in the volume of stocks exchanged, with marginal gains in value. At the end of trading, the major indices of the Main Market declined, while the Junior and JSE USD markets rallied, with prices of 45 shares rising, 43 declining and 22 remaining firm.

At the close of the market, the JSE Combined Market Index shed 864.72 points to finish at 328,907.38, the All Jamaican Composite Index declined by 1,018.92 points to 366,315.67, the JSE Main Index dropped 1,021.00 points to 318,404.72, the Junior Market Index rose 15.83 points to end at 3,410.63 and the JSE USD Market Index rallied just 0.04 points to end at 203.29.
At the close of trading on Tuesday, a total of 21,684,352 shares were exchanged in all three markets, up from just 11,033,090 units on Monday, with the value of stocks traded on the Junior and Main markets amounted to $65.46 million, up from only $50.89 million on the previous day, while the JSE USD market closed with an exchange of 7,320,894 shares for US$182,827 well over the 126,779 units at US$11,408 on Monday.
In Main Market activity, Transjamaican Highway led trading with 3.60 million shares, followed by Wigton Energy with 2.54 million stocks and Lasco Manufacturing with 2.02 million units.
In Junior Market trading, One Great Studio led with 1.01 million shares, followed by RA Williams with 503,663 stocks and Fosrich with 247,628 units.
In the preference segment, Jamaica Public Service 7% rose $3 to close at $43 and Sygnus Credit Investments C10.5% advanced $3.90 to $104.
The market’s PE ratio, the most popular measure used to value stocks, ended at 13.2 based on 2025-26 earnings compared with 16 using the 2024 historical earnings.
The ICInsider.com PE ratio chart and the other more detailed daily charts provide investors with regularly updated information to help decision-making. The PE ratio chart covers all ordinary shares listed on Jamaica Stock Exchange, grouped by industry, allowing for easy comparisons within a sector and the overall market. The earnings per share (EPS) and PE ratios are based on 2024 and 2025 actual or projected earnings, excluding any major one time income or expense.
Pertinent information is required to navigate numerous investment options successfully in the stock market. The chart should be used in making rational decisions when investing in stocks close to the sector average, not going too far from it unless there are compelling reasons to do so. This approach helps to remove emotions from investment decisions and place them on fundamentals, while not being too far from the majority of investors. Buying stocks when the prices are close to the average will protect against overpaying for a stock. The net asset value of each company is incorporated into the chart. Investors can use this measure in assessing stock values. The chart also displays daily stock price changes and percentage year to date price movements based on the last traded prices.

Dividends that are paid or are due to be paid and yields for each company are shown in the Main and Junior Markets’ daily charts, along with the closing volume of the highest bid and the lowest offer for each company.