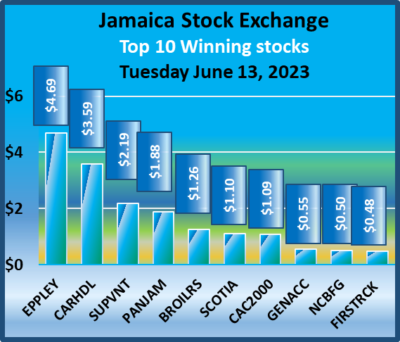
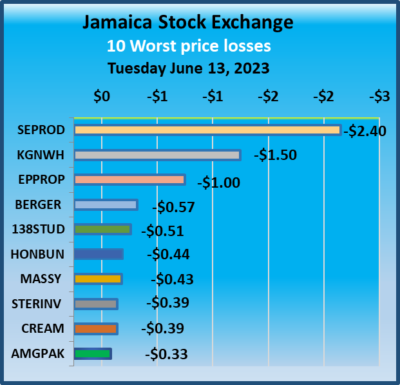
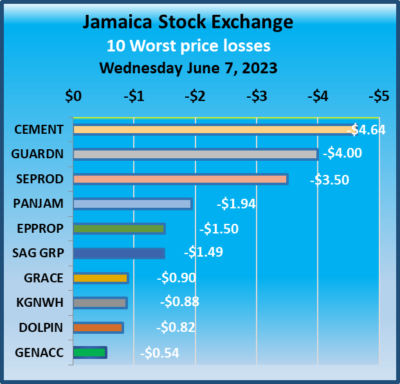
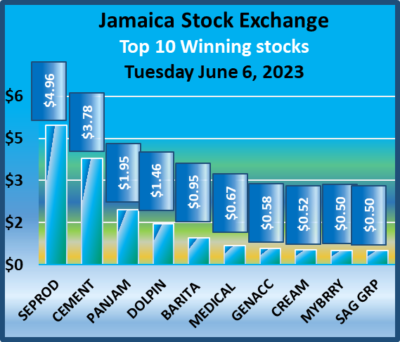
Trading surged on the Jamaica Stock Exchange on Tuesday Kingston Wharves traded 17.7 million shares valued at $496 million and swelled the overall trade for the day sharply higher than on Monday with all three markets rising at the close with Transjamaican Highway continuing to hit record highs and closed at $2.21.
 Trading ended with the JSE Combined Market Index popping 826.66 points to 342,175.85, while the All Jamaican Composite Index rallied 810.40 points to 362,087.53, the JSE Main Index climbed 469.12 points to 329,000.52. The Junior Market Index jumped 42.50 points to close at 3,844.90 and seems to be breaking out from wedge-shaped chart formation, while the JSE USD Market Index popped 4.19 points to 238.13.
Preference shares with notable price movements but are not in the Main Market TOP10 graphs are Eppley 7.25% preference share declined $2.85 in closing at $16.15, Eppley 7.50% preference share added $1.19 to end at $7.39, Jamaica Public Service 7% gained $2 in closing at $52, Jamaica Public Service 9.5% fell $22 to close at $2978. 138 Student Living preference share rose $6.99 and ended at $87.99 and Productive Business Solutions 9.75% preference share dipped $14.50 to $91.50.
 At the close, investors exchanged 60,867,391 shares in all three markets on Tuesday compared to 22,548,034 shares on Tuesday. The value of stocks trading in the Junior and main markets was $609.18 million, up sharply from $90.9 million on Tuesday. Trading on the JSE USD market resulted in investors exchanging 132,703 shares for US$3,992 compared to 2,048,216 units at US$53,374 on Tuesday.
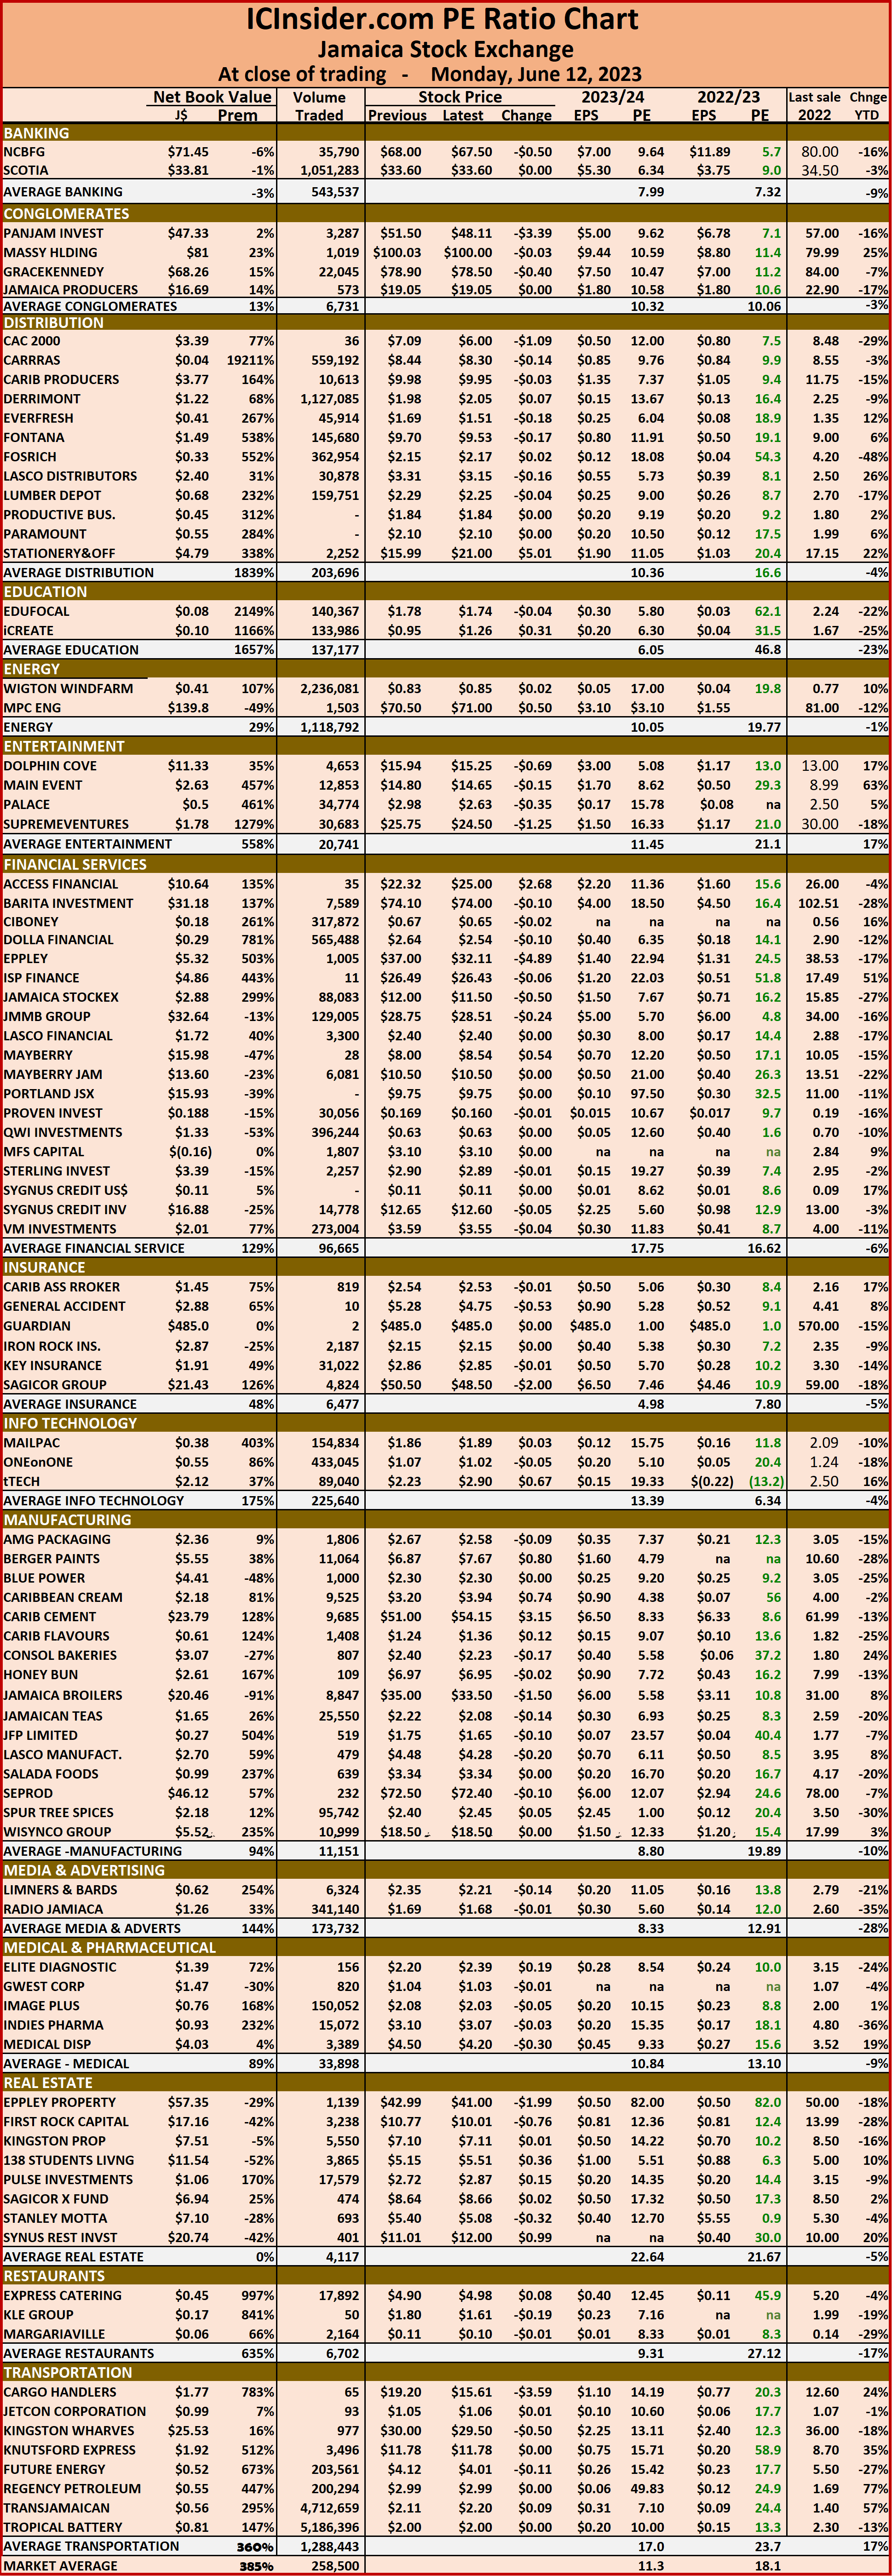
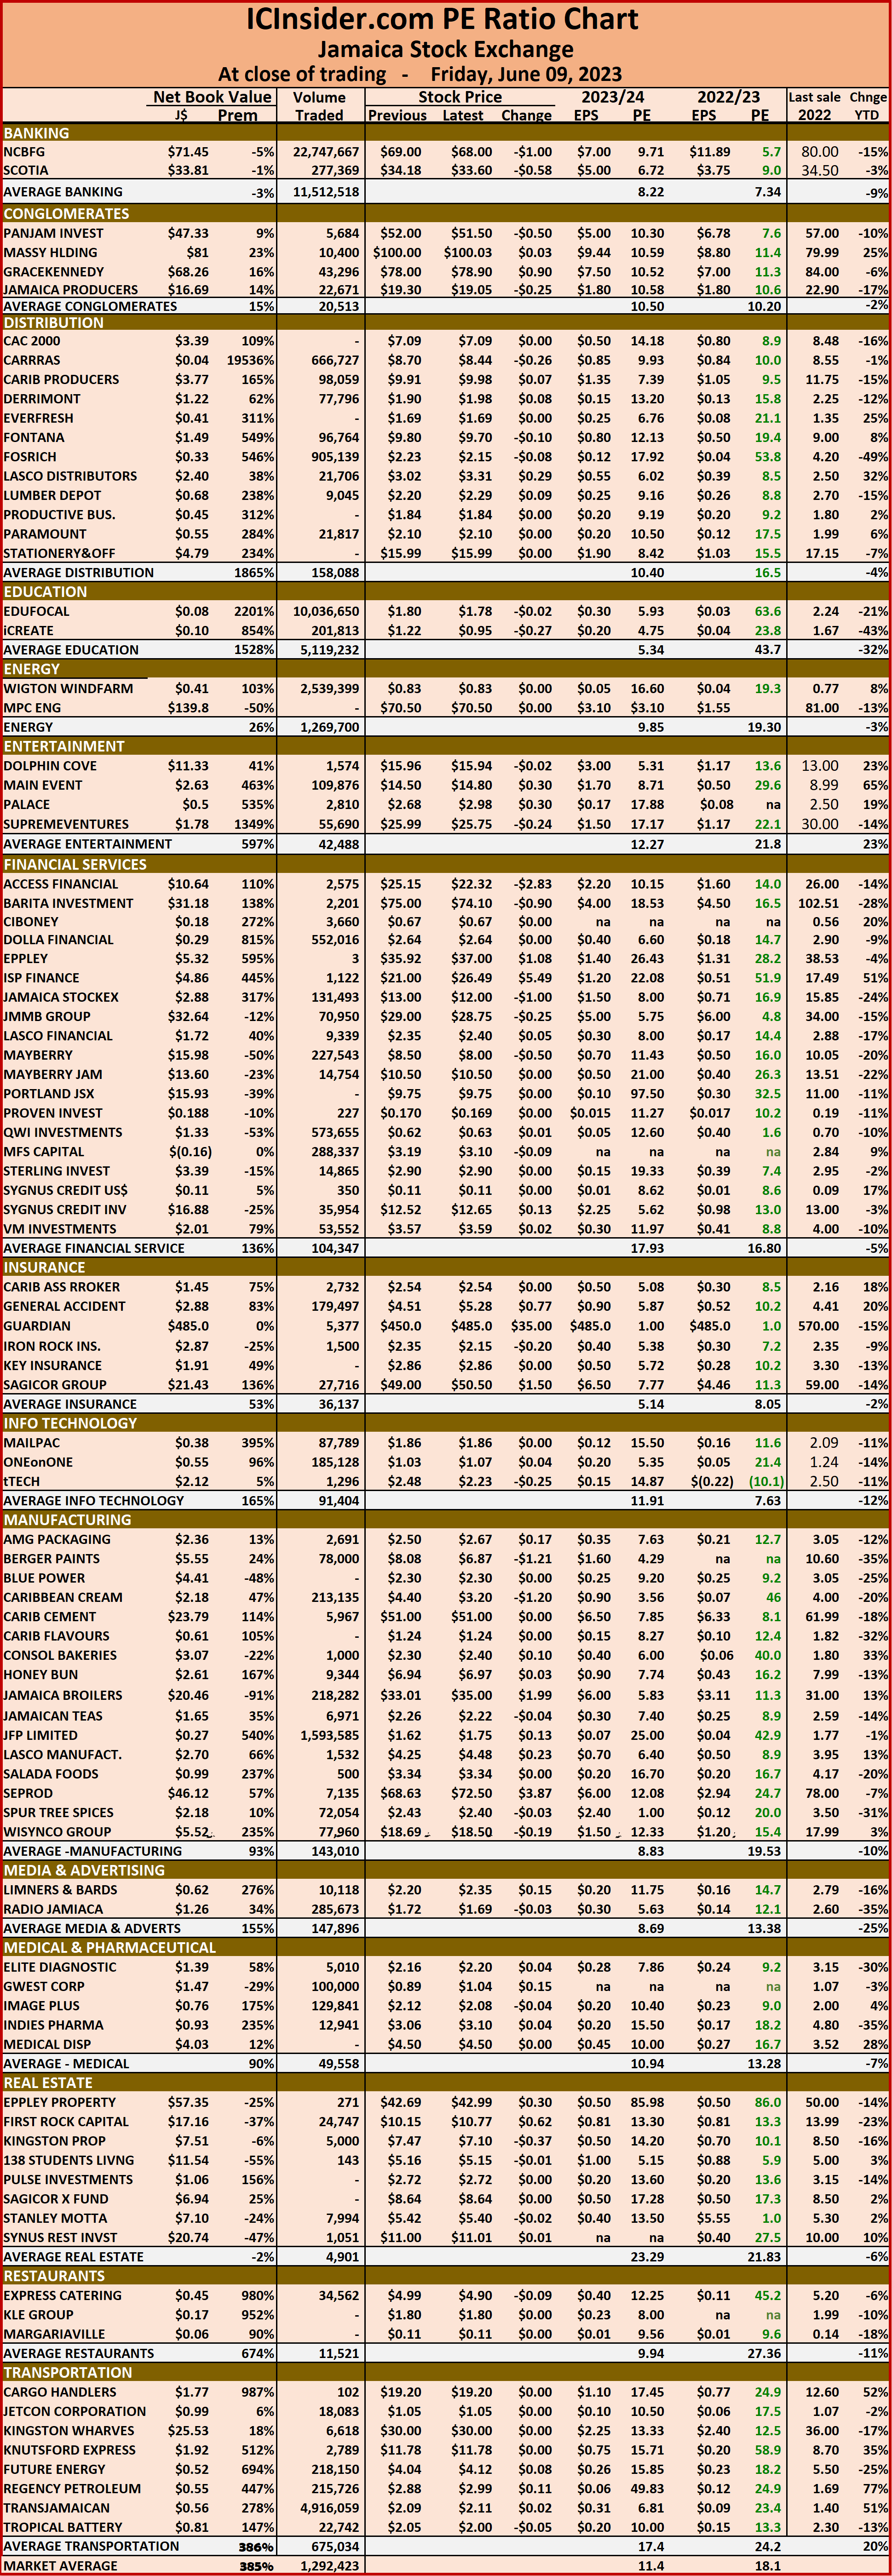
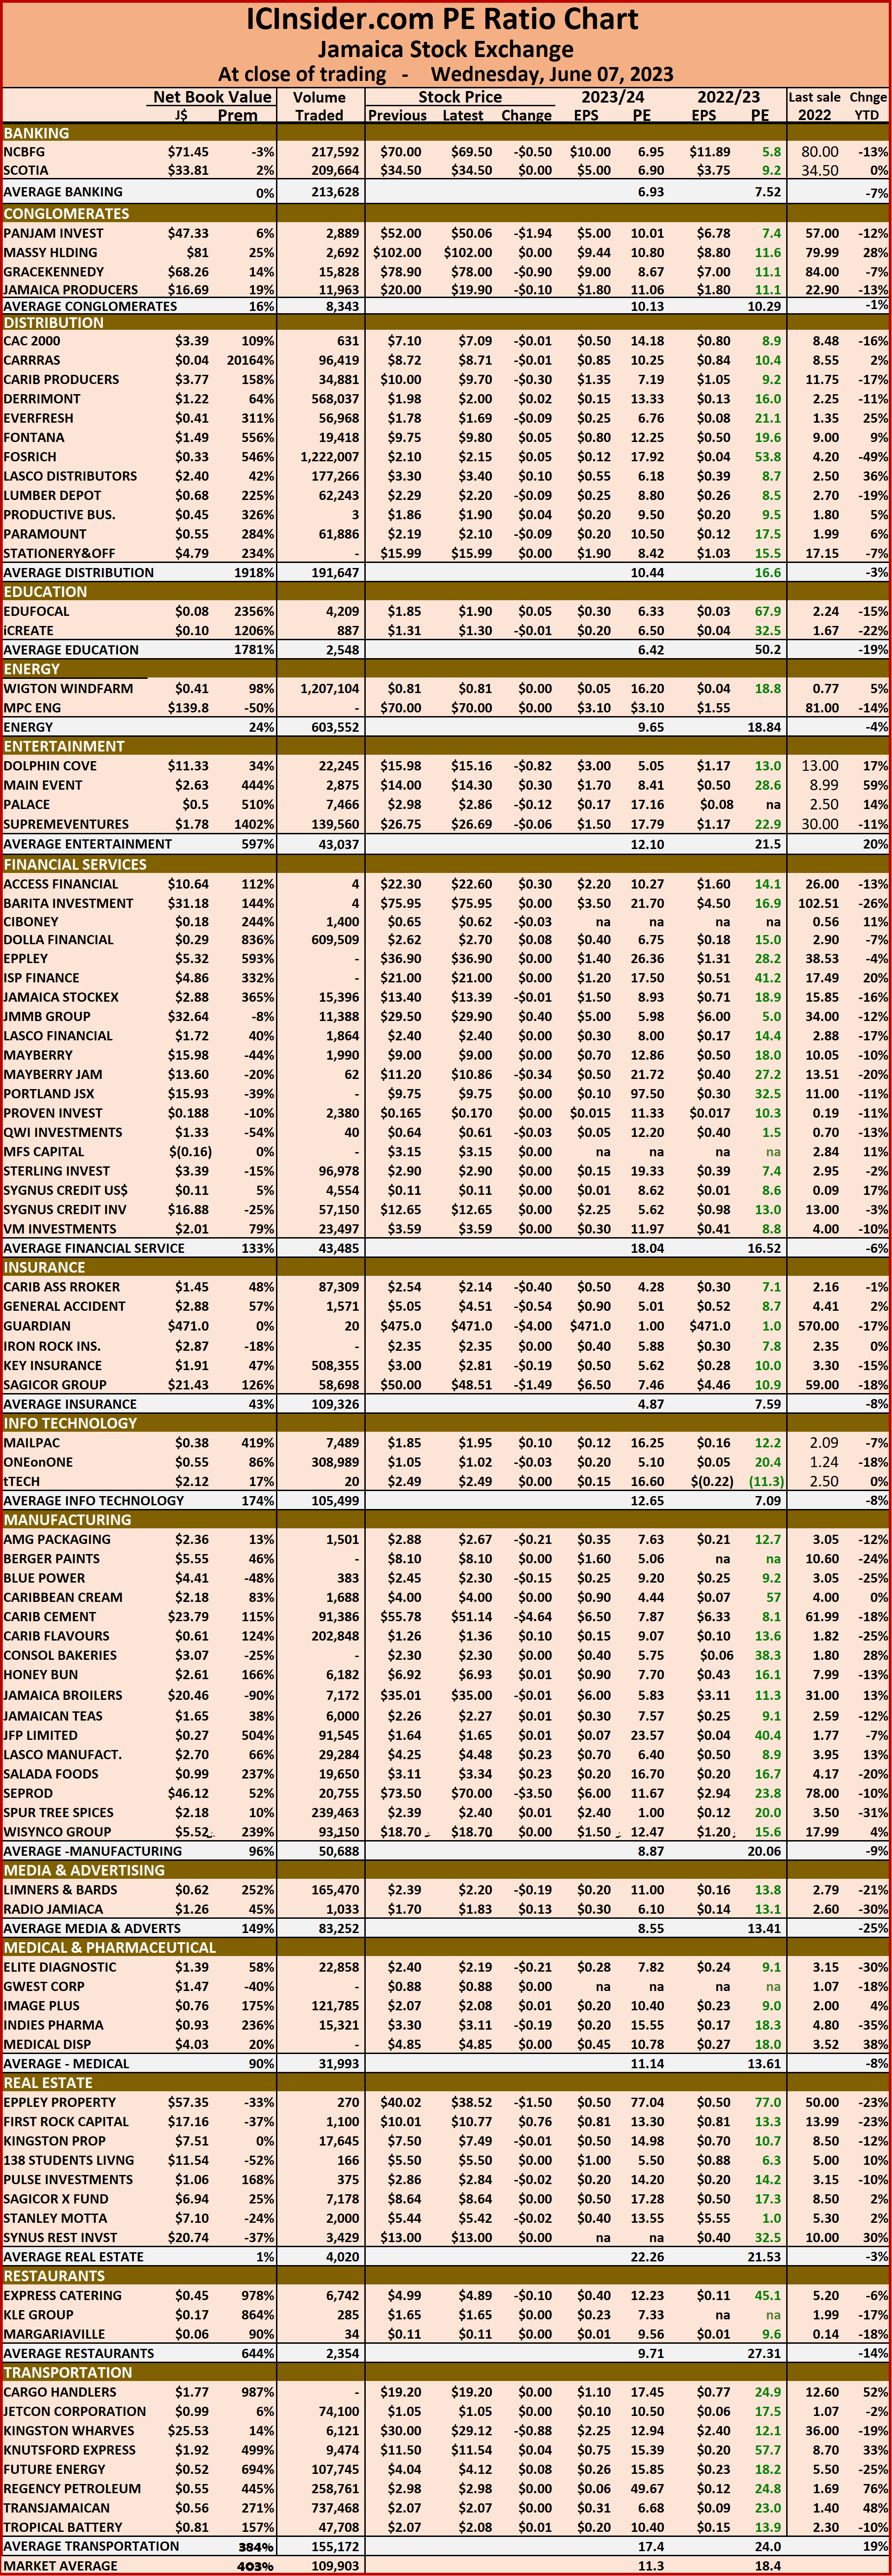
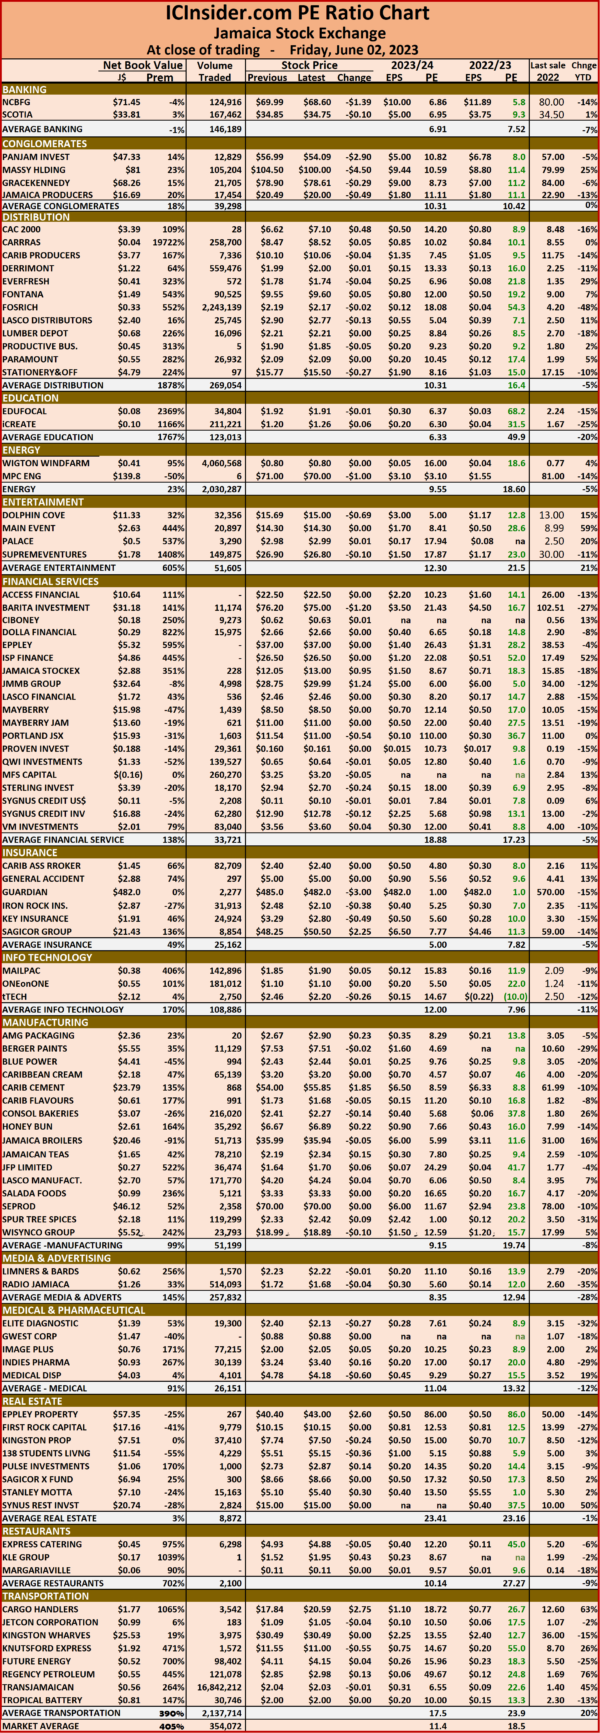
The market’s PE ratio ended at 18.2 on 2022-23 earnings and 11.4 times those for 2023-24 at the close of trading.
Investors need pertinent information to successfully navigate numerous investment options in the local stock market. The ICInsider.com PE ratio chart and the more detailed daily report charts provide investors with regularly updated information to help decision-making.
Investors should use the chart to help make rational decisions when investing in stocks close to the average for the sector and not going too far from it unless there are compelling reasons to do so. This approach helps to remove emotions from investment decisions and put in on fundamentals while at the same time not being too far from the majority of investors. Investors who buy when the price of a stock is close to the average will find that they are not inclined to overpay for a stock.
The ICInsider.com PE ratio chart covers all ordinary shares on the Jamaica Stock Exchange and shows companies grouped on an industry basis, allowing easy comparisons between the same sector companies and the overall market.
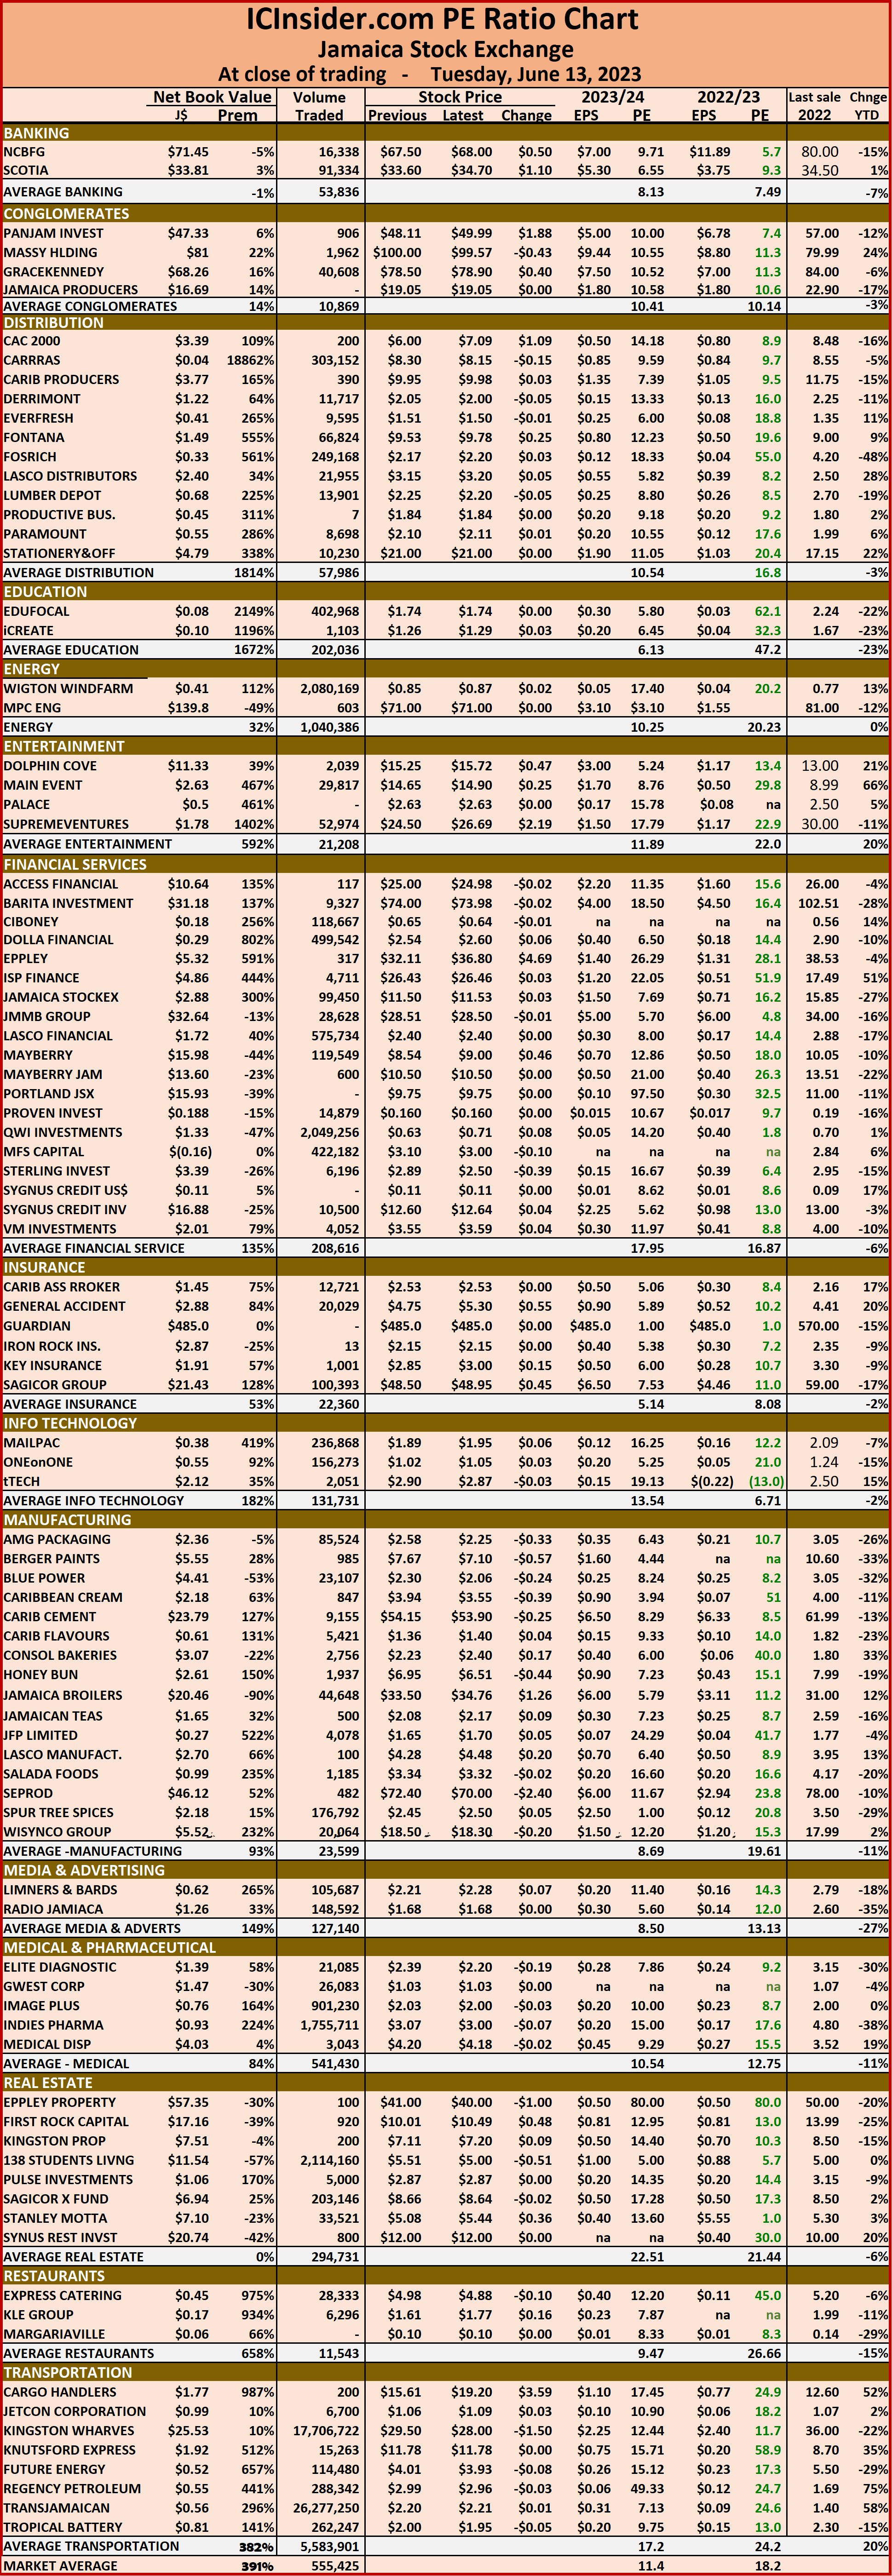 The net asset value of each company is reported as a guide to assess the value of stocks based on this measure quickly. The chart also shows daily changes in stock prices and the percentage year to date price movement based on the last traded prices.
Dividends paid or payable and yields for each company are shown in the Main and Junior Markets’ daily report charts along with the closing volume pertaining to the highest bid and the lowest offer for each company.
The EPS & PE ratios are based on 2021 and 2022 actual or projected earnings, excluding major one off items. The PE Ratio is the most popular measure used to determine the value of stocks.
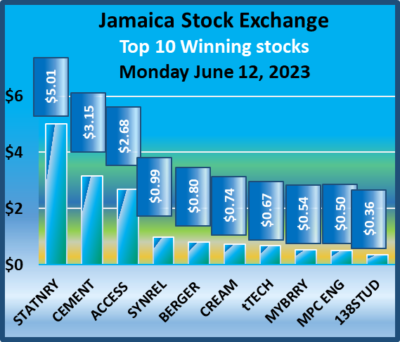
JSE Main Market rises Juniors & JSE USD fall
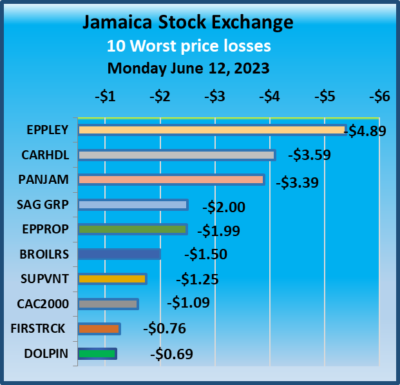
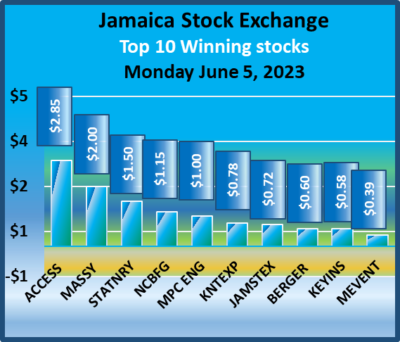
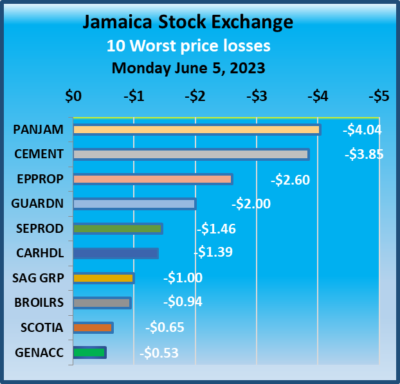
The Main Market of the Jamaica Stock Exchange broke its losing streak after closing moderately higher than Friday and Transjamaican Highway continues to hit record closing highs and closed at $2.20, but the Junior and the JSE USD Markets slipped below Friday’s close after six Junior Market stocks triggered the exchange circuit breaker at varying times during the trading session.
 At the close, the JSE Combined Market Index rose 1,083.75 points to end at 341.349.19, the All Jamaican Composite Index lost 325.98 points to close at 361,277.13, the JSE Main Index popped 1,197.20 points to 328,531.40, the Junior Market Index dipped 3.64 points to 3,802.40 and the JSE USD Market Index dipped 4.97 points to 233.94.
Preference shares with notable price movements but are not in the Main Market TOP10 graphs are Eppley 7.50% preference share shed $1.28 to close at $6.20, Jamaica Public Service 7% fell $10.48 in closing at $50. 138 Student Living preference share declined $6.99 and ended at $81, Productive Business 10.50% preference share dropped $50 to $1200 and Productive Business Solutions 9.75% preference share lost 94 cents to close at $106.
At the close, investors exchanged 22,548,034 shares in all three markets on Monday compared to 52,143,554 shares on Friday. The value of stocks trading in the Junior and main markets was $90.9 million, down from $1.637 billion on Friday. Trading on the JSE USD market resulted in an exchange of 2,048,216 shares for US$53,374 compared to 857,775 units at US$11,684 on Friday.
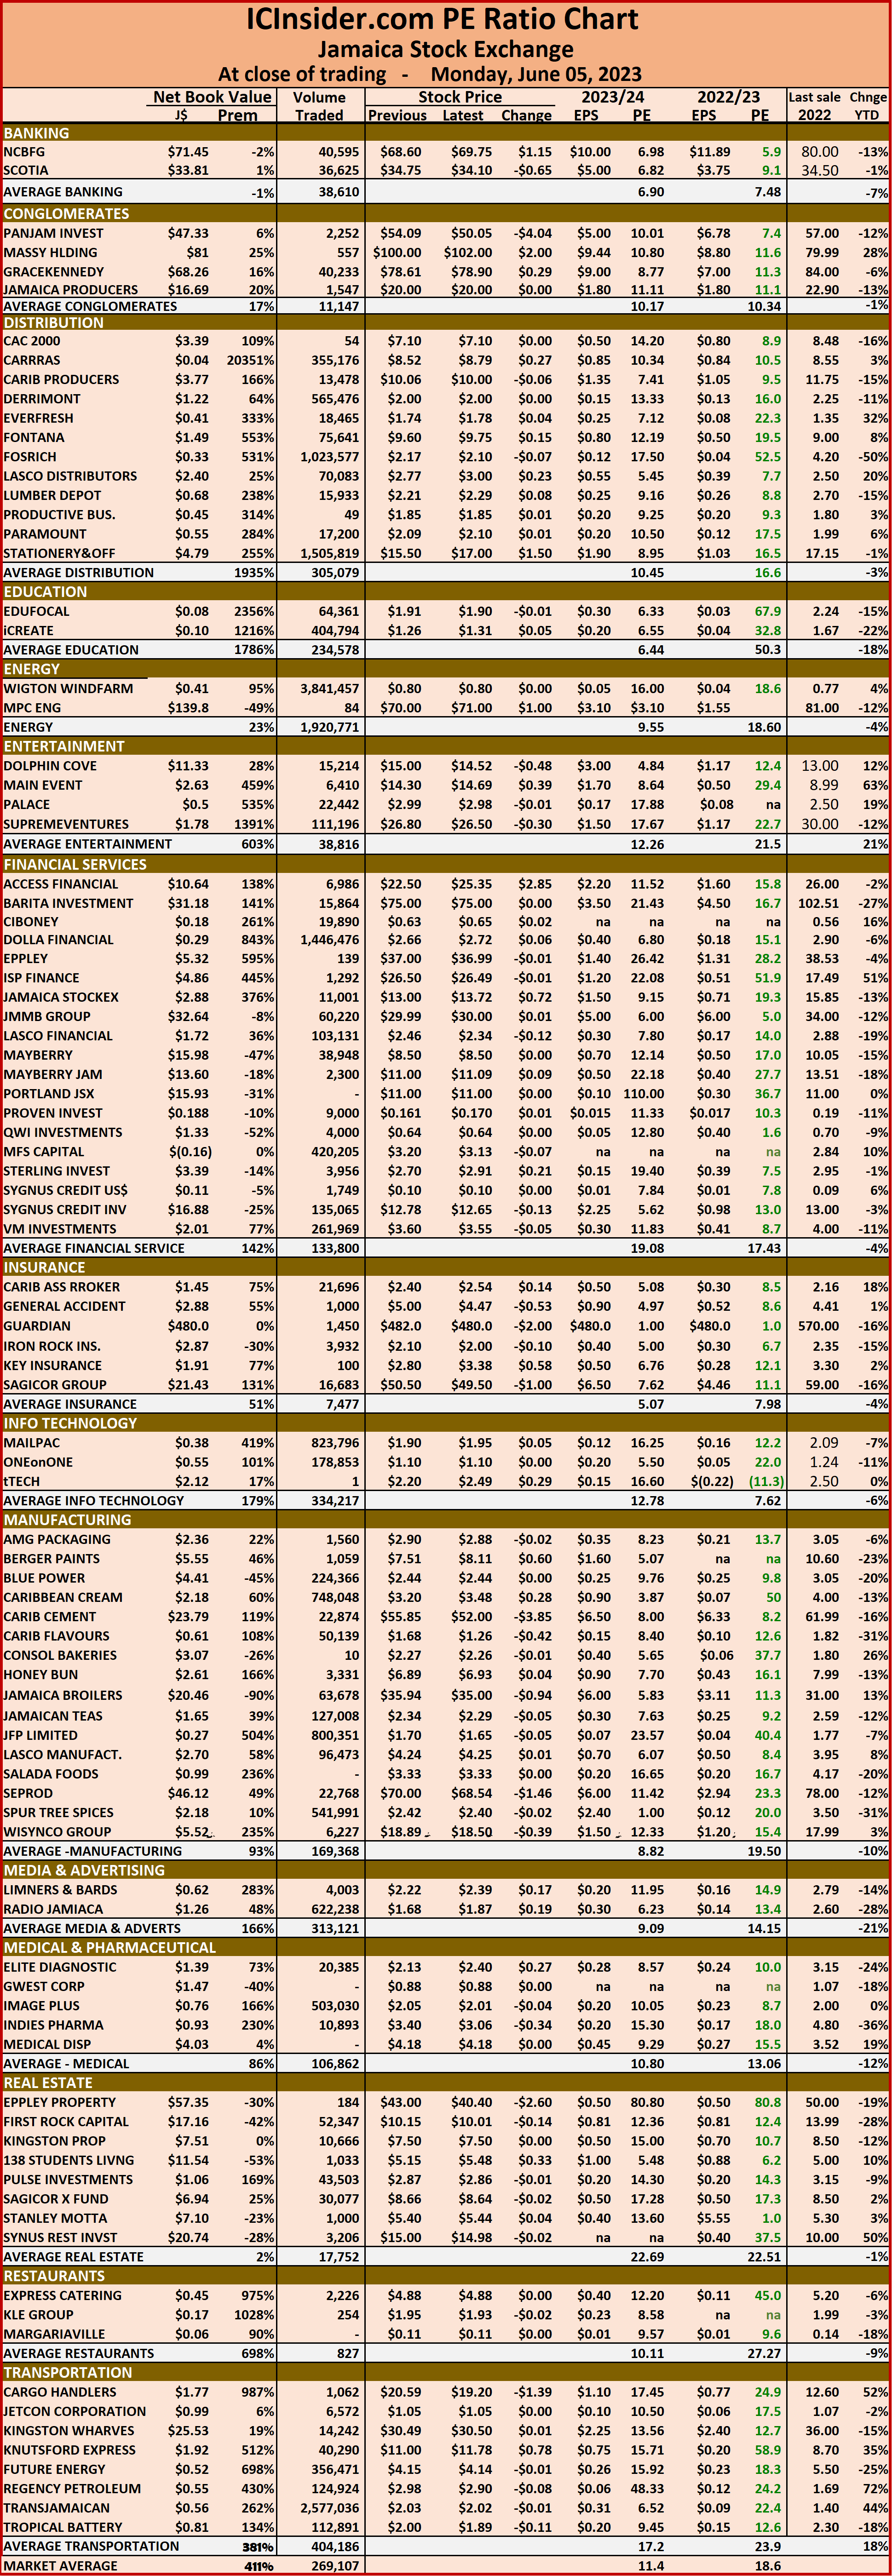
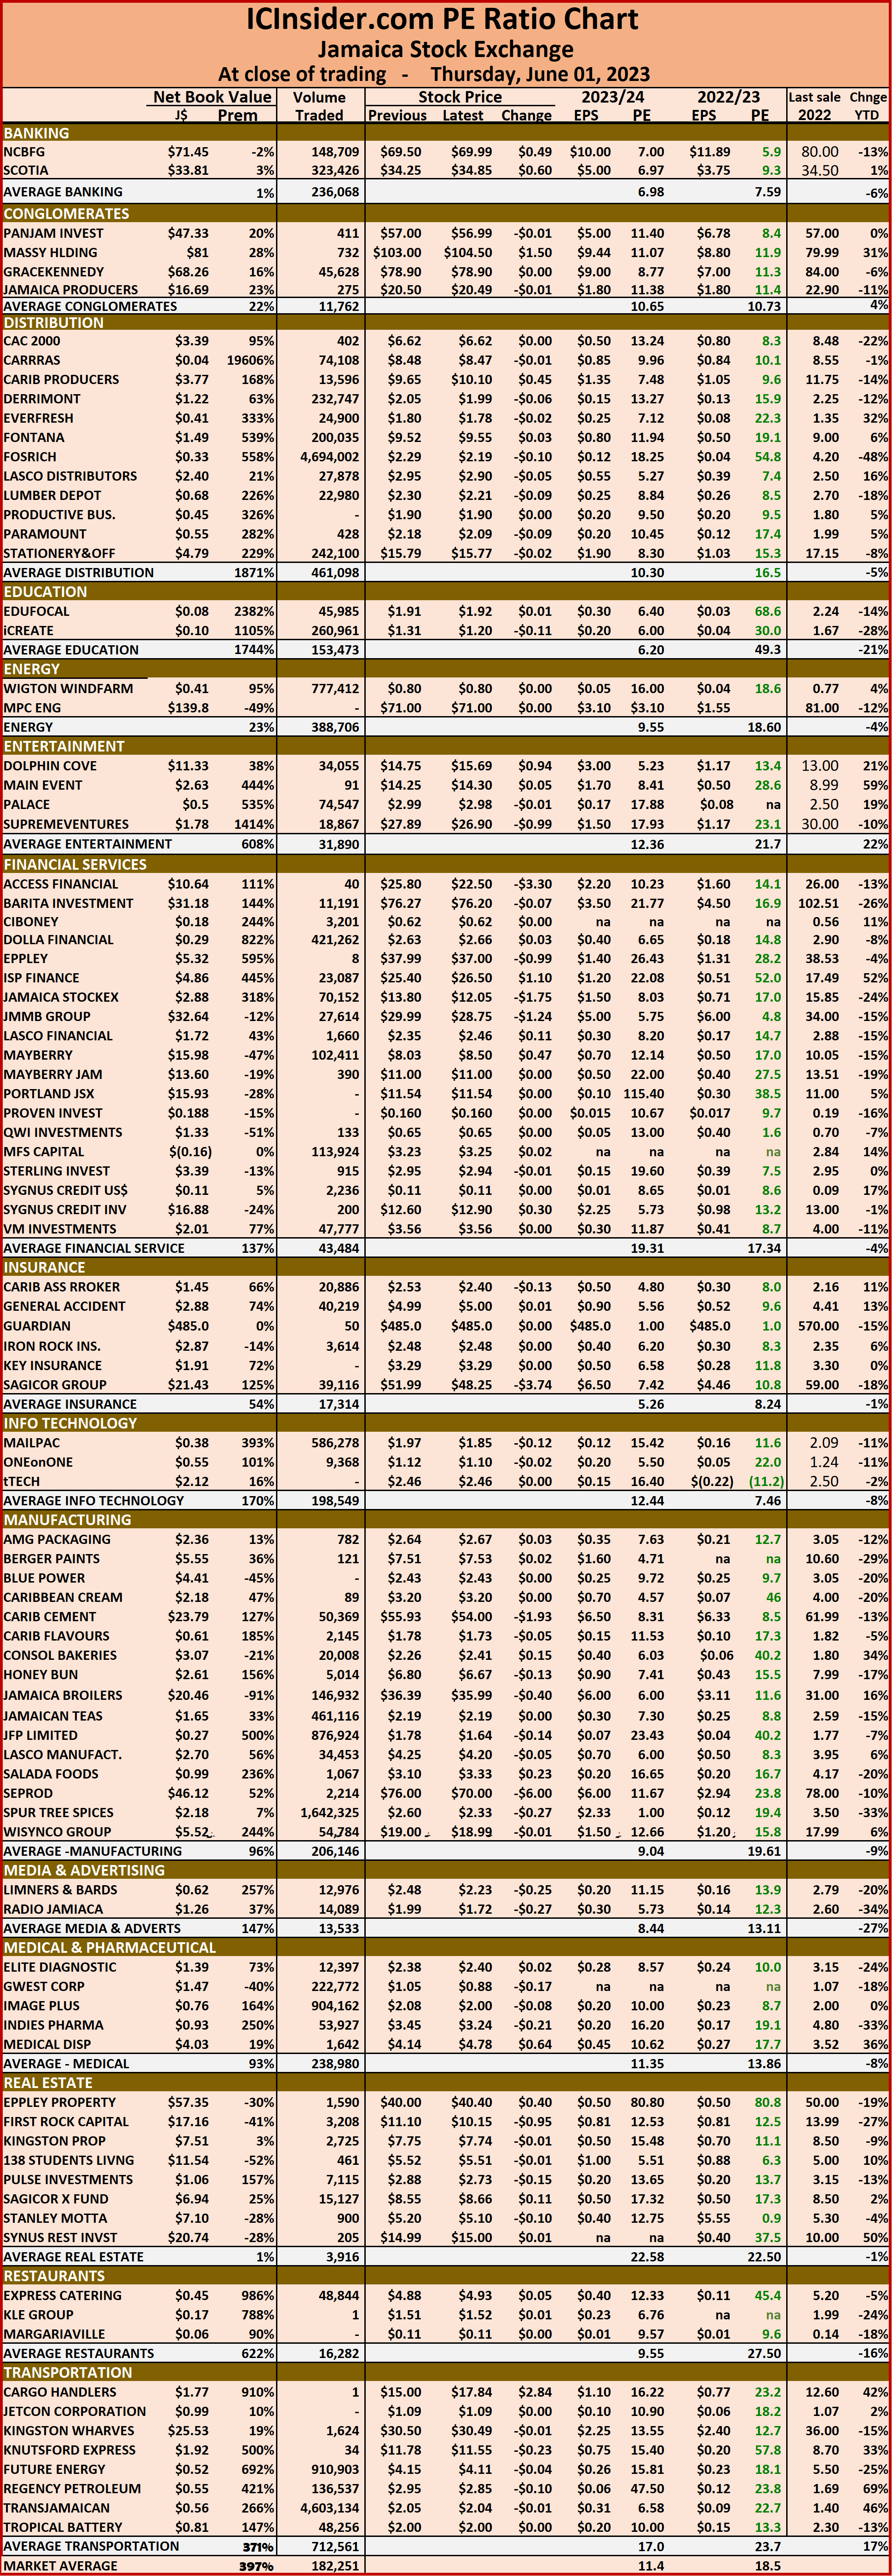
 The market’s PE ratio ended at 18.1 on 2022-23 earnings and 11.3 times those for 2023-24 at the close of trading.
Investors need pertinent information to successfully navigate numerous investment options in the local stock market. The ICInsider.com PE ratio chart and the more detailed daily report charts provide investors with regularly updated information to help decision-making.
Investors should use the chart to help make rational decisions when investing in stocks close to the average for the sector and not going too far from it unless there are compelling reasons to do so. This approach helps to remove emotions from investment decisions and put in on fundamentals while at the same time not being too far from the majority of investors. Investors who buy when the price of a stock is close to the average will find that they are not inclined to overpay for a stock.
The ICInsider.com PE ratio chart covers all ordinary shares on the Jamaica Stock Exchange and shows companies grouped on an industry basis, allowing easy comparisons between the same sector companies and the overall market.
The net asset value of each company is reported as a guide to assess the value of stocks based on this measure quickly. The chart also shows daily changes in stock prices and the percentage year to date price movement based on the last traded prices.
 Dividends paid or payable and yields for each company are shown in the Main and Junior Markets’ daily report charts along with the closing volume pertaining to the highest bid and the lowest offer for each company.
The EPS & PE ratios are based on 2021 and 2022 actual or projected earnings, excluding major one off items. The PE Ratio is the most popular measure used to determine the value of stocks.
JSE Markets ends week negatively
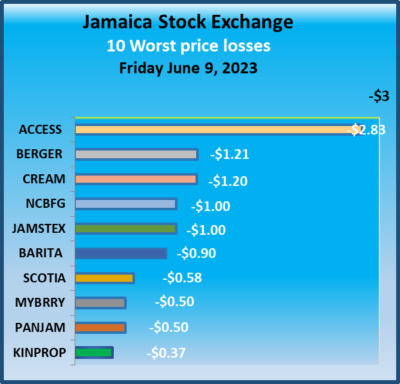
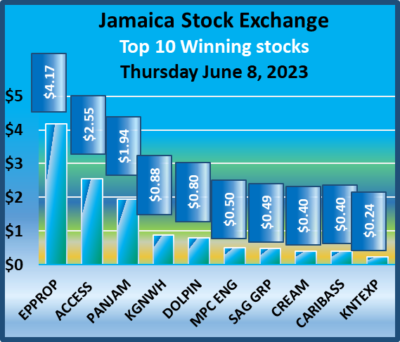
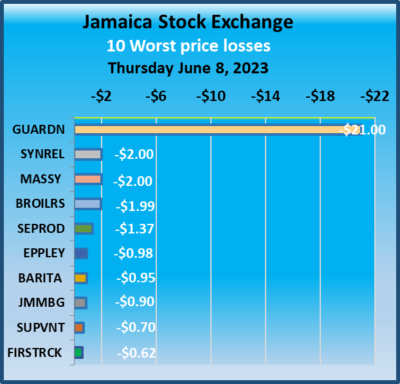
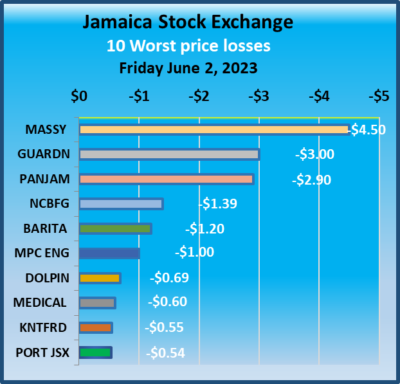
Trading surged sharply on the Jamaica Stock Exchange on Friday but the Main Market suffered more declines at the close, even as Transjamaica Highway continues to hit record closing highs as the indices suffered another four digit fall, following the previous two trading days while the Junior Market just slipped below Thursday’s close, after opening at 3,854.64 points, but market index stayed above the 3,800 mark for a third day while JSE USD Market eked out a modest rise at the close.
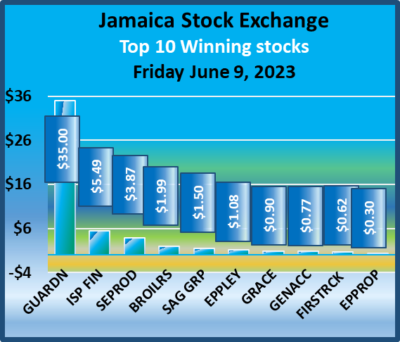 At the close of trading, the JSE Combined Market Index dropped 2,327.36 points to 340,265.44, the All Jamaican Composite Index shed 2,291.49 points to close at 361,603.11, the JSE Main Index dived 2,486.07 points to 327,334.20, the Junior Market Index dipped 0.84 points to settle at 3,806.04 and the JSE USD Market Index rose 0.05 points to close at 238.91.
Preference shares with notable movement but are not in the Main Market TOP10 graphs are Eppley 7.50% preference share with a rise of $1.28 to $7.48, Jamaica Public Service 7% down $3.35 to $60.48 and 138 Student Living preference share up $13.99 to $87.99.
At the close, investors exchanged 52,143,554 shares in all three markets, with NCB Financial accounting for 22,747,667 shares valued at $1.55 billion. Trading on Thursday amounted to 19,714,383 shares in all three markets, with the value of stocks trading amounting to $1.637 billion, down from $161.15 million. Trading on the JSE USD market resulted in investors exchanging 857,775 shares for US$11,684 compared to 269,277 units at US$11,912 on Thursday.
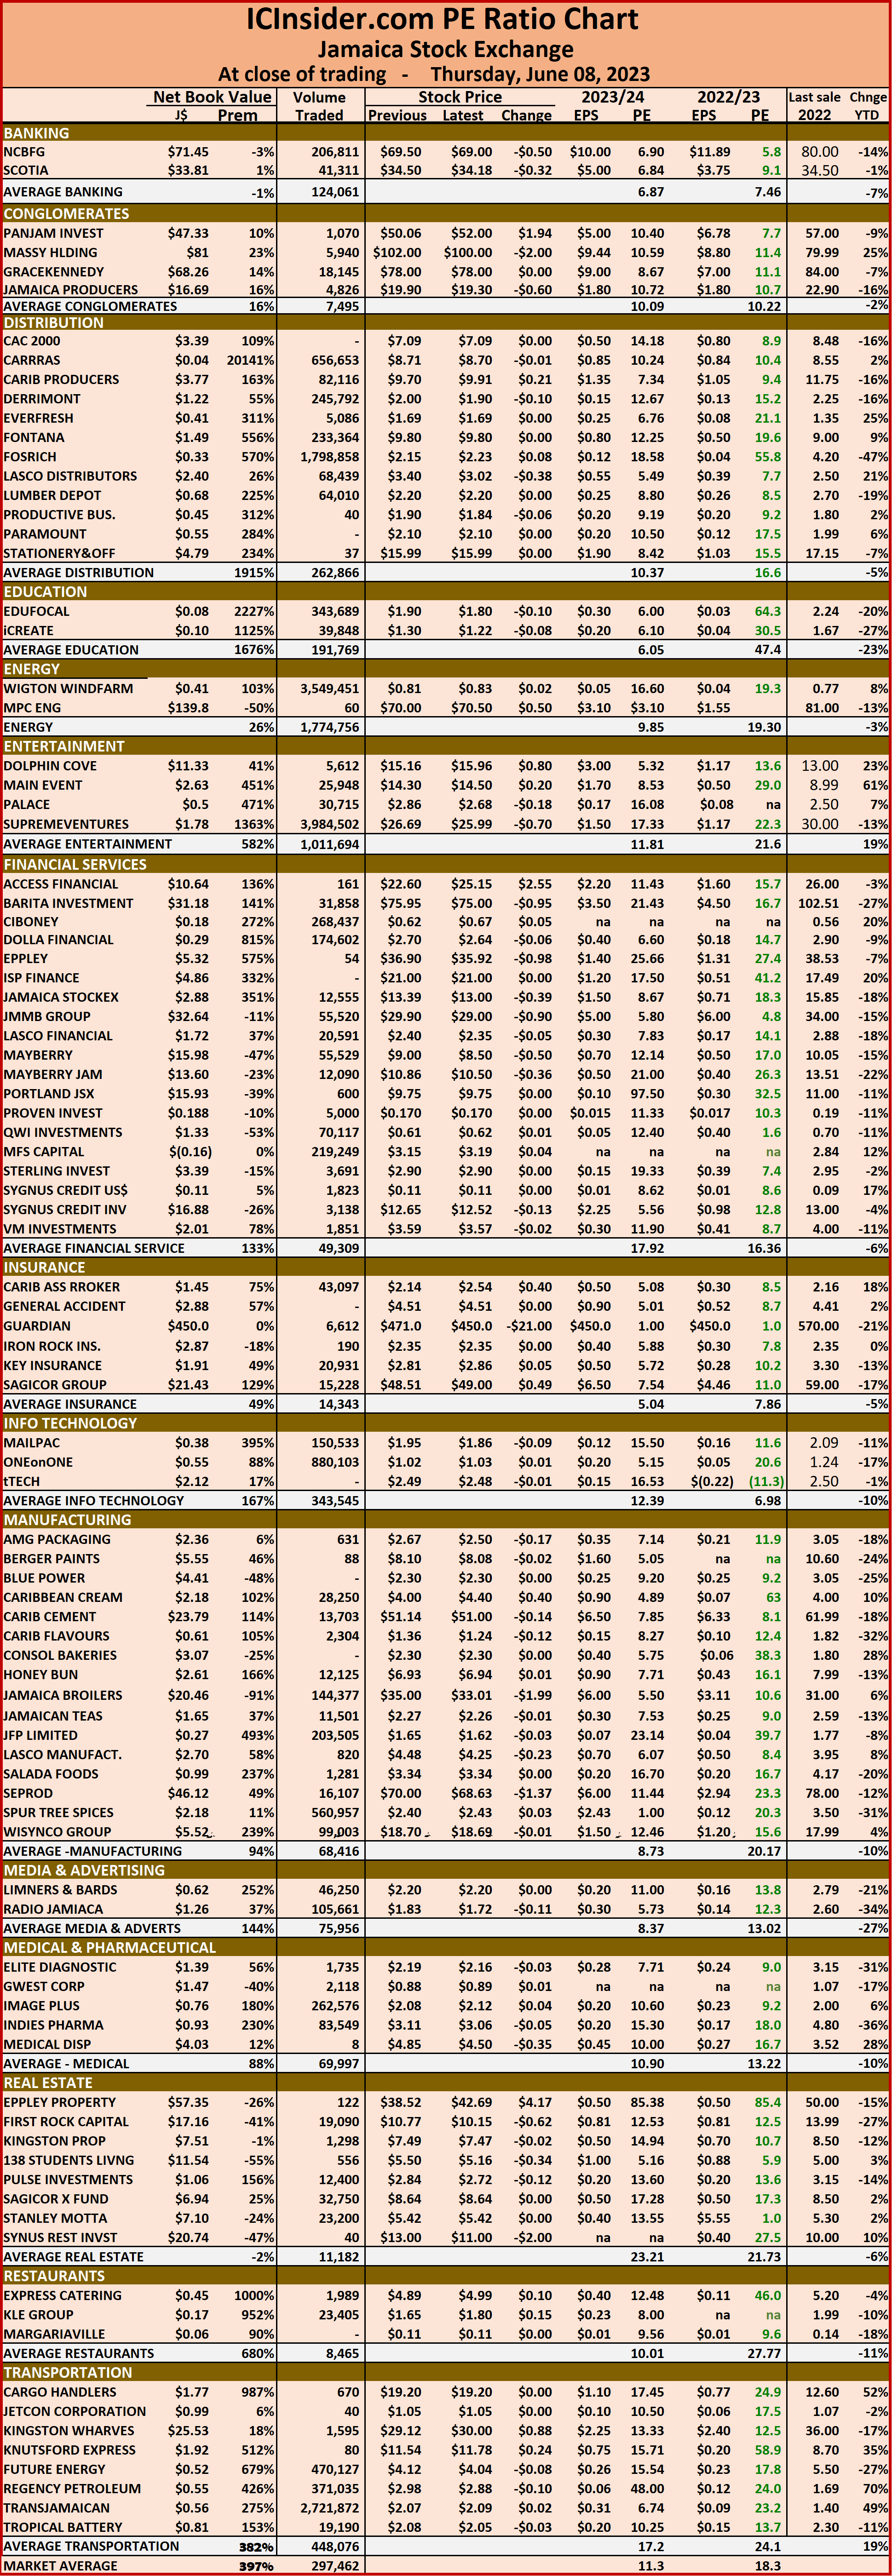
 The market’s PE ratio ended at 18.1 on 2022-23 earnings and 11.4 times those for 2023-24 at the close of trading.
Investors need pertinent information to successfully navigate numerous investment options in the local stock market. The ICInsider.com PE ratio chart and the more detailed daily report charts provide investors with regularly updated information to help decision-making.
Investors should use the chart to help make rational decisions when investing in stocks close to the average for the sector and not going too far from it unless there are compelling reasons to do so. This approach helps to remove emotions from investment decisions and put in on fundamentals while at the same time not being too far from the majority of investors. Investors who buy when the price of a stock is close to the average will find that they are not inclined to overpay for a stock.
The ICInsider.com PE ratio chart covers all ordinary shares on the Jamaica Stock Exchange and shows companies grouped on an industry basis, allowing easy comparisons between the same sector companies and the overall market.
The net asset value of each company is reported as a guide to assess the value of stocks based on this measure quickly. The chart also shows daily changes in stock prices and the percentage year to date price movement based on the last traded prices.
 Dividends paid or payable and yields for each company are shown in the Main and Junior Markets’ daily report charts along with the closing volume pertaining to the highest bid and the lowest offer for each company.
The EPS & PE ratios are based on 2021 and 2022 actual or projected earnings, excluding major one off items. The PE Ratio is the most popular measure used to determine the value of stocks.
Big fall for JSE Main Market USD Market up
The Junior Market of the Jamaica Stock Exchange stayed above the 3,800 mark that it reached on Wednesday but slipped marginally at the close after rising sharply in the morning session, the JSE USD Market bounced during the day, but the Main Market declined sharply for a second day, the fourth day of decline since last week Friday, following increased trading over Wednesday.
 At the close of trading, the JSE Combined Market Index dropped 3,572.73 points to 342,592.8, the All Jamaican Composite Index dived 4,628.88 points to 363,894.60, the JSE Main Index plunged 3,811.14 points to 329,820.27, the Junior Market Index dipped 1.81 points to settle at 3,806.88 and the JSE USD Market Index rose 9.27 points to close at 238,86.
Preference shares that are not in the Main Market TOP10 graphs are Eppley 5% preference share, that fell $3 to close at $17, Eppley 7.50% preference share with a fall of $1.28 to close at $6.20, while Jamaica Public Service 7% dipped $14.77 to $63.83 and 138 Student Living preference share dropped $13.99 and ended at $74.
At the close, investors exchanged 19,714,383 shares in all three markets, up from 9,796,640 units on Wednesday, with the value of stocks trading amounting to $161.15 million, down from $58.16 million on Wednesday. Trading on the JSE USD market resulted in investors exchanging 269,277 shares for US$11,912 compared to 757,348 units at US$ 10,500 on Wednesday.
 The market’s PE ratio ended at 18.3 on 2022-23 earnings and 11.3 times those for 2023-24 at the close of trading.
Investors need pertinent information to successfully navigate numerous investment options in the local stock market. The ICInsider.com PE ratio chart and the more detailed daily report charts provide investors with regularly updated information to help decision-making.
Investors should use the chart to help make rational decisions when investing in stocks close to the average for the sector and not going too far from it unless there are compelling reasons to do so. This approach helps to remove emotions from investment decisions and put in on fundamentals while at the same time not being too far from the majority of investors. Investors who buy when the price of a stock is close to the average will find that they are not inclined to overpay for a stock.
The ICInsider.com PE ratio chart covers all ordinary shares on the Jamaica Stock Exchange and shows companies grouped on an industry basis, allowing easy comparisons between the same sector companies and the overall market.
The net asset value of each company is reported as a guide to assess the value of stocks based on this measure quickly. The chart also shows daily changes in stock prices and the percentage year to date price movement based on the last traded prices.
 Dividends paid or payable and yields for each company are shown in the Main and Junior Markets’ daily report charts, along with the closing volume pertaining to the highest bid and the lowest offer for each company.
The EPS & PE ratios are based on 2021 and 2022 actual or projected earnings, excluding major one off items. The PE Ratio is the most popular measure used to determine the value of stocks.
Juniors rise as others fall
The Junior Market of the Jamaica Stock Exchange closed over the 3,800 mark for the first time since March 13, but the other markets declined at the close of trading on Wednesday, with the volume of stocks trading declining as the value rose moderately above Tuesday’s level.
 At the close of trading, the JSE Combined Market Index fell 2,224.20 points to 346,165.48, the All Jamaican Composite Index declined 2,652.86 points to close at 368,523.48, the JSE Main Index shed 2,552.97 points to close at 333,631.41, the Junior Market Index rose 17.25 points to end at 3,808.69 and the JSE USD Market Index dipped 11.81 points to close at 229.59.
The preference share that is not in the Main Market TOP10 graphs is Jamaica Public Service 7% which rallied $11.88 in closing at $78.60.
At the close, investors exchanged 9,796,640 shares in all three markets, down from 12,241,458 units on Tuesday, with the value of stocks trading amounting to $58.16 million, down from $56 million on Tuesday. Trading on the JSE USD market resulted in investors exchanging 757,348 shares for US$10,500 compared to 26,137 units at US$3,700 on Tuesday.
 The market’s PE ratio ended at 18.4 on 2022-23 earnings and 11.3 times those for 2023-24 at the close of trading.
Investors need pertinent information to successfully navigate numerous investment options in the local stock market. The ICInsider.com PE ratio chart and the more detailed daily report charts provide investors with regularly updated information to help decision-making.
Investors should use the chart to help make rational decisions when investing in stocks close to the average for the sector and not going too far from it unless there are compelling reasons to do so. This approach helps to remove emotions from investment decisions and put in on fundamentals while at the same time not being too far from the majority of investors. Investors who buy when the price of a stock is close to the average will find that they are not inclined to overpay for a stock.
The ICInsider.com PE ratio chart covers all ordinary shares on the Jamaica Stock Exchange and shows companies grouped on an industry basis, allowing easy comparisons between the same sector companies and the overall market.
The net asset value of each company is reported as a guide to assess the value of stocks based on this measure quickly. The chart also shows daily changes in stock prices and the percentage year to date price movement based on the last traded prices.
 Dividends paid or payable and yields for each company are shown in the Main and Junior Markets’ daily report charts along with the closing volume pertaining to the highest bid and the lowest offer for each company.
The EPS & PE ratios are based on 2021 and 2022 actual or projected earnings, excluding major one off items. The PE Ratio is the most popular measure used to determine the value of stocks.
All JSE Markets rose on Tuesday
All the markets of the Jamaica Stock Exchange put in a good showing on Tuesday with all three market indices rising at the close with volume and value of stocks trading falling below Monday’s levels.
 At the close of the market, the JSE Combined Market Index rallied 1,237.03 points to 348,389.68, the All Jamaican Composite Index rallied 1,720.36 points to end at 371,176.34, the JSE Main Index added 866.00 points to settle at 336,184.38, the Junior Market Index that fell 40.76 points on Monday rose 46.87 points to end at 3,791.44 on Tuesday and the JSE USD Market Index rose 7.07 points to 241.40.
There were no shares in the preference segment of the Main Market not included in the TOP10 graphs that ended with a notable price change.
At the close, investors exchanged 12,241,458 shares in all three markets, down from 20,210,036 units on Monday, with the value of stocks trading amounting to $56 million down from $83.8 million on Monday. Trading on the JSE USD market resulted in investors exchanging 26,137 shares for US$3,700 compared to 144,256 units at US$3,922 on Monday.
 The market’s PE ratio ended at 18.5 on 2022-23 earnings and 11.4 times those for 2023-24 at the close of trading.
Investors need pertinent information to successfully navigate numerous investment options in the local stock market. The ICInsider.com PE ratio chart and the more detailed daily report charts provide investors with regularly updated information to help decision-making.
Investors should use the chart to help make rational decisions when investing in stocks close to the average for the sector and not going too far from it unless there are compelling reasons to do so. This approach helps to remove emotions from investment decisions and put in on fundamentals while at the same time not being too far from the majority of investors. Investors who buy when the price of a stock is close to the average will find that they are not inclined to overpay for a stock.
The ICInsider.com PE ratio chart covers all ordinary shares on the Jamaica Stock Exchange and shows companies grouped on an industry basis, allowing easy comparisons between the same sector companies and the overall market.
The net asset value of each company is reported as a guide to assess the value of stocks based on this measure quickly. The chart also shows daily changes in stock prices and the percentage year to date price movement based on the last traded prices.  Dividends paid or payable and yields for each company are shown in the Main and Junior Markets’ daily report charts along with the closing volume pertaining to the highest bid and the lowest offer for each company.
The EPS & PE ratios are based on 2021 and 2022 actual or projected earnings, excluding major one off items. The PE Ratio is the most popular measure used to determine the value of stocks.
All JSE Market drop on Monday
The markets closed lower on the Jamaica Stock Exchange on Monday with trading volume and value falling bellows Friday’s levels and providing limited support to the market’s prices.
 The JSE Combined Market Index fell 633.59 points to 347,152.65, the All Jamaican Composite Index declined by 1,262.06 points to 369,455.98, the JSE Main Index fell 279.16 points to 335,318.38, the Junior Market Index fell 40.76 points to 3,744.57 and the JSE USD Market Index slipped 3.96 points to 234.26.
Shares in the preference segment of the Main Market not included in the TOP10 graphs ended with Jamaica Public Service 7% falling $11.78 to close at $66.72.
At the close, investors exchanged 20,210,036 shares in all three markets, down from 29,251,124 18 units on Friday, with the value of stocks trading amounting to $83.8 million down from $94.5 million on Friday. Trading on the JSE USD market resulted in investors exchanging 144,256 shares for US$3,922 compared to 112,013 units at US$25,887 on Friday.
 The market’s PE ratio ended at 18.6 on 2022-23 earnings and 11.4 times those for 2023-24 at the close of trading.
Investors need pertinent information to successfully navigate numerous investment options in the local stock market. The ICInsider.com PE ratio chart and the more detailed daily report charts provide investors with regularly updated information to help decision-making.
Investors should use the chart to help make rational decisions when investing in stocks close to the average for the sector and not going too far from it unless there are compelling reasons to do so. This approach helps to remove emotions from investment decisions and put in on fundamentals while at the same time not being too far from the majority of investors. Investors who buy when the price of a stock is close to the average will find that they are not inclined to overpay for a stock.
The ICInsider.com PE ratio chart covers all ordinary shares on the Jamaica Stock Exchange and shows companies grouped on an industry basis, allowing easy comparisons between the same sector companies and the overall market.
The net asset value of each company is reported as a guide to assess the value of stocks based on this measure quickly. The chart also shows daily changes in stock prices and the percentage year to date price movement based on the last traded prices.
 Dividends paid or payable and yields for each company are shown in the Main and Junior Markets’ daily report charts along with the closing volume pertaining to the highest bid and the lowest offer for each company.
The EPS & PE ratios are based on 2021 and 2022 actual or projected earnings, excluding major one off items. The PE Ratio is the most popular measure used to determine the value of stocks.
Main Market drops Junior Market rises
Trading closed mixed for a second day with the Main Market of the Jamaica Stock Exchange declining and the JSE USD market slipping moderately while the Junior Market recovered all of Thursday’s loss, following an increase in volume and value of stocks traded on the entire market compared with trading on Thursday.
 Trading ended after the JSE Combined Market Index dropped 2,380.52 points to 347,786.24, the All Jamaican Composite Index fell 2,090.32 points to end at 370,718.04, the JSE Main Index shed 2,685.82 points to close at 335,597.54, the Junior Market Index rose 13.71 points to end at 3,785.33 and the JSE USD Market Index dipped 0.35 points to end at 238.22.
Shares in the preference segment of the Main Market not included in the TOP10 graphs ended with Productive Business 10.50% preference share rising $25 in closing at $1250 and 138 Student Living preference share shedding $1.25 to close at $88.
At the close, investors exchanged 29,251,124 shares in all three markets, up from 21,422,118 units on Thursday, with the value of stocks trading amounting to $94.5 million down from $86.8 million on Thursday. Trading on the JSE USD market resulted in investors exchanging 112,013 shares for US$25,887 compared to 147,149 units at US$2,647 on Thursday.
 The market’s PE ratio ended at 18.5 on 2022-23 earnings and 11.4 times those for 2023-24 at the close of trading.
Investors need pertinent information to successfully navigate numerous investment options in the local stock market. The ICInsider.com PE ratio chart and the more detailed daily report charts provide investors with regularly updated information to help decision-making.
Investors should use the chart to help make rational decisions when investing in stocks close to the average for the sector and not going too far from it unless there are compelling reasons to do so. This approach helps to remove emotions from investment decisions and put in on fundamentals while at the same time not being too far from the majority of investors. Investors who buy when the price of a stock is close to the average will find that they are not inclined to overpay for a stock.
The ICInsider.com PE ratio chart covers all ordinary shares on the Jamaica Stock Exchange and shows companies grouped on an industry basis, allowing easy comparisons between the same sector companies and the overall market.
The net asset value of each company is reported as a guide to assess the value of stocks based on this measure quickly. The chart also shows daily changes in stock prices and the percentage year to date price movement based on the last traded prices.
 Dividends paid or payable and yields for each company are shown in the Main and Junior Markets’ daily report charts along with the closing volume pertaining to the highest bid and the lowest offer for each company.
The EPS & PE ratios are based on 2021 and 2022 actual or projected earnings, excluding major one off items. The PE Ratio is the most popular measure used to determine the value of stocks.
Main Market rises into a new month
Trading started off in June with mixed results, with the Main market of the Jamaica Stock Exchange rising on Thursday, but the Junior Market and the JSE USD market declined to start off June negatively as volume and value declined sharply lower compared with trading on Wednesday.
 The JSE Combined Market Index climbed 1,509.57 points to close at 350,166.76, while the All Jamaican Composite Index jumped 2,332.39 points to end at 372,808.36, the JSE Main Index rallied 1,749.45 points to 338,283.36, with the Junior Market Index shedding 13.41 points to end at 3,771.62 and the JSE USD Market Index dipped 4.12 points to end at 238.57.
Shares in the preference segment of the Main Market not included in the TOP10 graphs ended with Jamaica Public Service 7% rose $9.20 to close at $78.50 and 138 Student Living preference share shed $15.75 to close at $89.25.
At the close, investors exchanged 21,422,118 shares in all three markets, down from 41,266,577 units on Wednesday, with the value of stocks trading amounting to $86.8 million down from $199.8 million on Wednesday. Trading on the JSE USD market resulted in investors exchanging 147149 shares for US$2,647 compared to 842,727 units at US$97,351 on Wednesday.
 The market’s PE ratio ended at 18.5 on 2022-23 earnings and 11.4 times those for 2023-24 at the close of trading.
Investors need pertinent information to successfully navigate numerous investment options in the local stock market. The ICInsider.com PE ratio chart and the more detailed daily report charts provide investors with regularly updated information to help decision-making.
Investors should use the chart to help make rational decisions when investing in stocks close to the average for the sector and not going too far from it unless there are compelling reasons to do so. This approach helps to remove emotions from investment decisions and put in on fundamentals while at the same time not being too far from the majority of investors. Investors who buy when the price of a stock is close to the average will find that they are not inclined to overpay for a stock.
The ICInsider.com PE ratio chart covers all ordinary shares on the Jamaica Stock Exchange and shows companies grouped on an industry basis, allowing easy comparisons between the same sector companies and the overall market.
The net asset value of each company is reported as a guide to assess the value of stocks based on this measure quickly. The chart also shows daily changes in stock prices and the percentage year to date price movement based on the last traded prices.
 Dividends paid or payable and yields for each company are shown in the Main and Junior Markets’ daily report charts along with the closing volume pertaining to the highest bid and the lowest offer for each company.
The EPS & PE ratios are based on 2021 and 2022 actual or projected earnings, excluding major one off items. The PE Ratio is the most popular measure used to determine the value of stocks.
Month-end gains for JSE stocks
Stocks closed higher on the Jamaica Stock Exchange in trading on Wednesday, with the Junior Market squeezing out a third consecutive day of gains while the JSE USD market jumped sharply at the end of trading also closed higher, and the JSE Main market closed just higher in the final minutes before the close, following a sharp pick up in trading on Tuesday’s levels.
 The JSE Combined Market Index rallied 854.92 points to 348,657.19, the All Jamaican Composite Index popped 112.20 points to 370,475.97, the JSE Main Index rose 696.33 points to 336,533.91, the Junior Market Index managed to hold on a gain of 22.41 points to end at 3,785.03 and the JSE USD Market Index dropped 30.40 points to end at 242.69.
Shares in the preference segment of the Main Market not included in the TOP10 graphs ended with Productive Business 10.50% preference share popping $124 to $1225 as Jamaica Public Service 7% rose $9.30 to close at $69.30.
At the close, investors exchanged 41,266,573 shares in all three markets, up from 17,543,277 units on Monday, with the value of stocks trading amounting to $199.8 million from $73.68 million on Monday.  Trading on the JSE USD market resulted in investors exchanging 842,727 shares for US$97,351 compared to 15,452 units at US$986 on Monday.
The market’s PE ratio ended at 17.8 on 2022-23 earnings and 11.6 times those for 2023-24 at the close of trading.
Investors need pertinent information to successfully navigate numerous investment options in the local stock market. The ICInsider.com PE ratio chart and the more detailed daily report charts provide investors with regularly updated information to help decision-making.
Investors should use the chart to help make rational decisions when investing in stocks close to the average for the sector and not going too far from it unless there are compelling reasons to do so. This approach helps to remove emotions from investment decisions and put in on fundamentals while at the same time not being too far from the majority of investors. Investors who buy when the price of a stock is close to the average will find that they are not inclined to overpay for a stock.
The ICInsider.com PE ratio chart covers all ordinary shares on the Jamaica Stock Exchange and shows companies grouped on an industry basis, allowing easy comparisons between the same sector companies and the overall market.
The net asset value of each company is reported as a guide to assess the value of stocks based on this measure quickly. The chart also shows daily changes in stock prices and the percentage year to date price movement based on the last traded prices.
 Dividends paid or payable and yields for each company are shown in the Main and Junior Markets’ daily report charts along with the closing volume pertaining to the highest bid and the lowest offer for each company.
The EPS & PE ratios are based on 2021 and 2022 actual or projected earnings, excluding major one off items. The PE Ratio is the most popular measure used to determine the value of stocks.


