Stocks closed mixed on the Jamaica Stock Exchange on Monday leaving the Combined Index with a rise of 340.71 points to end at 404,760.98, the All Jamaican Composite Index declined 1,542.16 points to end at 446,189.43, the Junior Market opened trading at 3,975 points up from Friday’s close of 3,874.34 and gained 51.94 points to close at 3,927 after paring back early morning gains to trade down to 3,904.27 points by 11 am and the JSE Main Index lost 124.48 points to end at 395,089.30.
The market’s PE ratio ended at 17.6 based on 2021-22 earnings and 11.8 times those for 2022-23 at the close of market activity on the Jamaica Stock Exchange.
Investors need a series of measures and pertinent information to successfully navigate the many investment choices in the local stock market, the ICInsider.com PE ratio chart along with the more detailed daily report charts, provide investors with regularly updated information to help with decision making.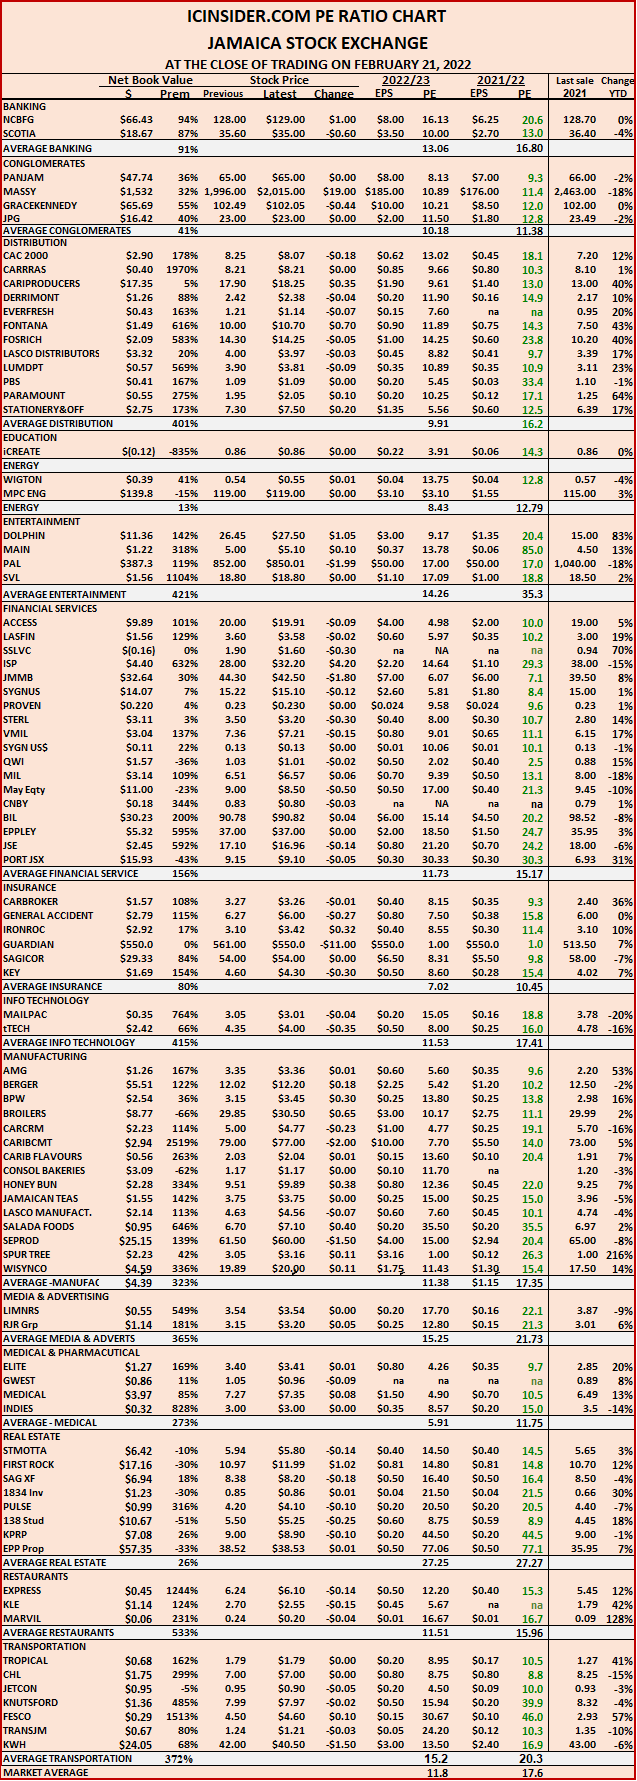
Investors should make use of the chart to help make rational investment decisions, by investing in stocks that are close to the average for the sector and not going too far from it unless there are compelling reasons to do so. Investors who buy when the price of a stock is close to the average will find that they are not inclined to overpay for a stock. This approach helps to take emotions out of the investment decision and at the same time not be too far from the majority of investors.
The ICInsider.com PE Ratio chart covers all ordinary shares listed on the Jamaica Stock Exchange and shows companies grouped on an industry basis, allowing for easy comparisons between same sector companies as well as the overall market. The net asset value of each company is reported as a guide to easily assess the value of stocks based on this measure.
The chart also shows daily changes in stock prices and the percentage year to date changes based on the last traded prices. Dividends payable and yields for each company are shown in the Main and Junior Markets daily report charts that also show closing volume for the bids and offers.
The EPS & PE ratios are based on 2021 and 2022 actual or projected earnings, excluding major one off items. The PE Ratio is the most popular measure used to determine the value of stocks.
Jamaican stocks closed mixed on Monday
Jamaican stocks bounce on Friday
Stocks rallied on the Jamaica Stock Exchange on Friday leaving the Combined Index with a gain of 1,646.44 points to end at 404,420.26, the All Jamaican Composite Index rose 1,052.94 points to 447,731.60, the Junior Market recovered 66.77 points of the 226 points lost over the previous three days in closing at 3,874.34 and the JSE Main Index picked up 1,370.17 points to end at 395,213.78.
The market’s PE ratio ended at 17.6 based on 2021-22 earnings and 12.3 times those for 2022-23 at the close of market activity on the Jamaica Stock Exchange.
Investors need a series of measures and pertinent information to successfully navigate the many investment choices in the local stock market, the ICInsider.com PE ratio chart along with the more detailed daily report charts, provide investors with regularly updated information to help with decision making.
Investors should make use of the chart to help make rational investment decisions, buy investing in stocks that are close to the average for the sector and not go too far from it unless there are compelling reasons to do so. Investments with prices of a stock are close to the average, will find that they are not inclined to overpay for a stock. This approach helps to take emotions out of the investment decision and put in of fundamentals at the same time not being too far from the majority of investors.
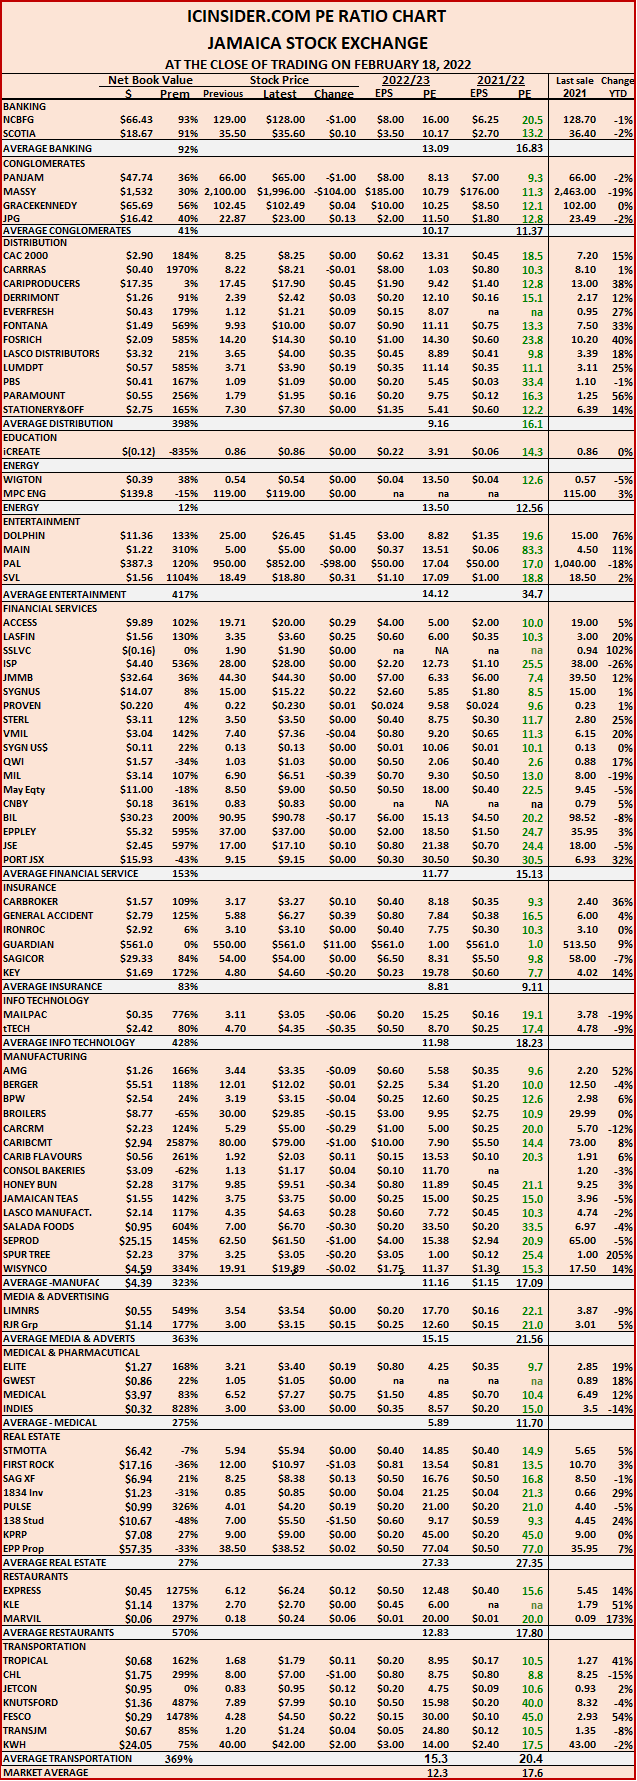 The ICInsider.com PE Ratio chart covers all ordinary shares listed on the Jamaica Stock Exchange and shows companies grouped on an industry basis, allowing for easy comparisons between same sector companies as well as the overall market. The net asset value of each company is reported as a guide to easily assess the value of stocks based on this measure.
The chart also shows daily changes in stock prices and the percentage year to date changes based on the last traded prices. Dividends payable and yields for each company are shown in the Main and Junior Markets daily report charts that also show closing volume for the bids and offers.
The EPS & PE ratios are based on 2021 and 2022 actual or projected earnings, excluding major one time income or expense. The PE Ratio is the most popular measure used to determine the value of stocks.
Big drop for JSE stocks again on Thursday
Stocks prices fell across the market, resulting in big declines at the close of trading on Thursday, in both the Main Market and the Junior Market as investors gather funds for the latest initial public offering to come to the market and opens on Monday coming.
The Jamaica Stock Exchange Combined Index skidded 6,194.03 points to end at 402,773.74 as the All Jamaican Composite Index fell 4,913.82 points to 446,678.54 and the Junior Market dropped 74.82 points following declines of 58.44 points on Wednesday and 92.56 points on Tuesday in closing at 3,833.15 and the JSE Main Index lost 5,907.44 points to 393,843.52.
The market’s PE ratio ended at 17.3 based on 2021-22 earnings and 12.3 times those for 2022-23 at the close of market activity on the Jamaica Stock Exchange.
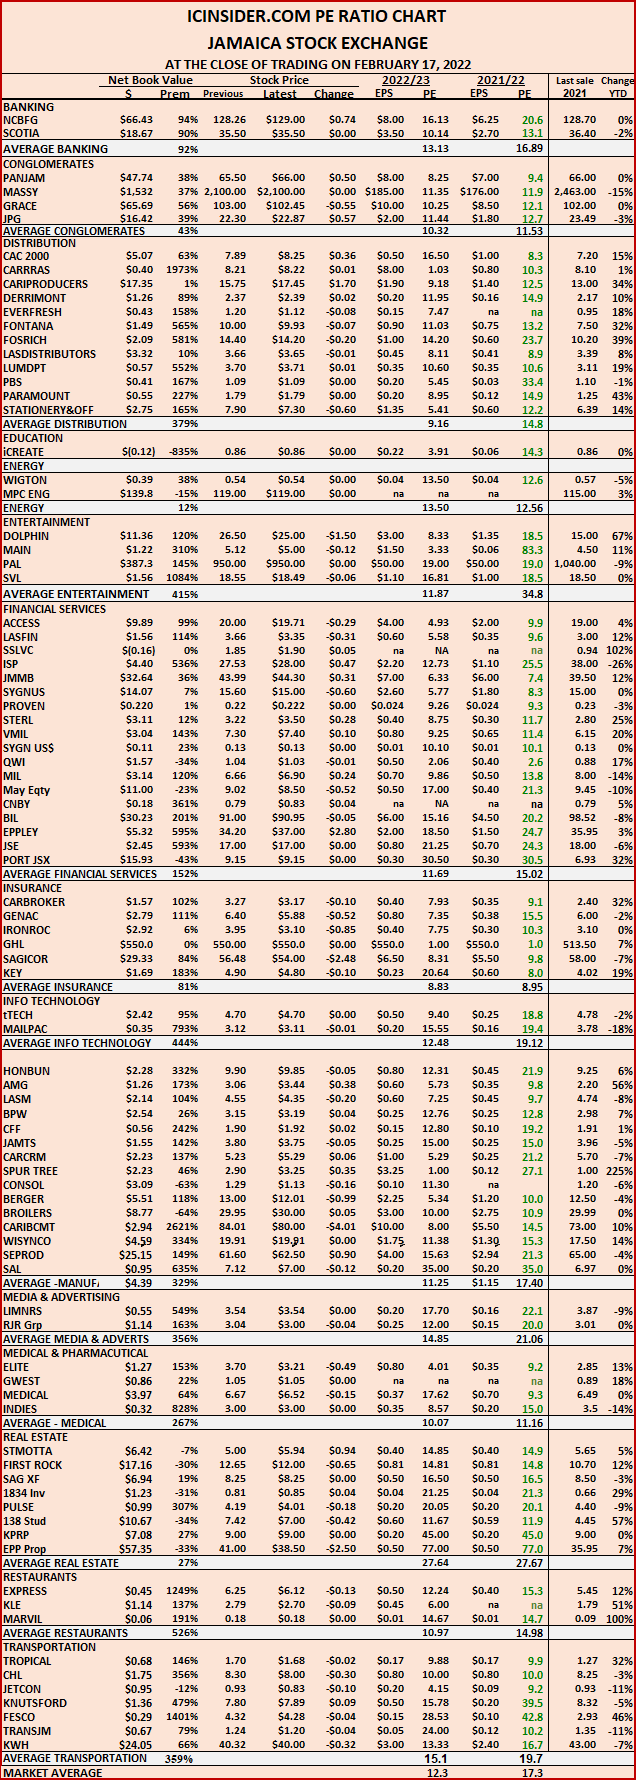 Investors need a series of measures and pertinent information to successfully navigate the many investment choices in the local stock market, the ICInsider.com PE ratio chart along with the more detailed daily report charts provide investors with daily updated information to help with decision making.
The ICInsider.com PE Ratio chart covers all ordinary shares listed on the Jamaica Stock Exchange and shows companies grouped on an industry basis, allowing for easy comparisons between same sector companies as well as the overall market. The net asset value of each company is reported as a guide to easily assess the value of stocks based on this measure.
The chart also shows daily changes in stock prices and the percentage year to date changes based on the last traded prices. Dividends payable and yields for each company are shown in the Main and Junior Markets daily report charts that also show closing volume for the bids and offers.
The EPS & PE ratios are based on 2021 and 2022 actual or projected earnings, excluding major one off items. The PE Ratio is the most popular measure used to determine the value of stocks.
The next big Junior Market run is nigh
The last time this signal was flashed, the market rose 600 points and before that 500 points. The Jamaica Stock Exchange Junior Market is sending out a strong signal that a big rally is ahead once more.
 When technical readings for the Junior Market were going through a golden cross back in July 2019, the market rallied by more than 600 points and in 2018, the market put on 450 points after the signal was sent. How much gain will result in this round is unclear, but it could well take the market up another 600 points in a rally that could put it around 3,100 points, initially. Because the Junior Market index is a weighted one, not all stocks are going to provide the same levels of returns as such, the market move as measured by the index could vary a bit from the suggested gains.
What the golden cross? This is when the short term moving average crosses over the medium moving average and both cross over the long term moving average. The medium-term moving average has crossed over the long-term one and the short term is making its way to cross the medium one with it already cross over the long term.