Trading levels rose on the Jamaica Stock Exchange on Wednesday, with the volume of stocks changing hands exceeding the near 10 million shares on Tuesday fueled by a rise in value and resulting in the Main Market and Junior Market declining and the USD market closing marginally higher as Main Market stocks dominated.
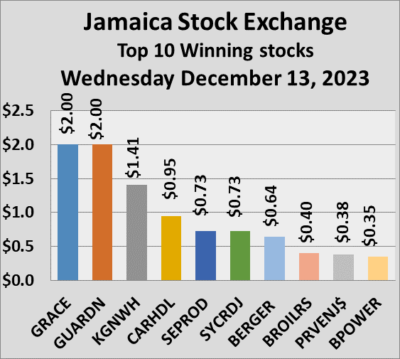 Both GraceKennedy and Guardian Holdings led rising stocks with a gain of $2, followed by Kingston Wharves up $1.141 but declining stocks held the upper hand with Eppley dropping $2.49, Sagicor Group with a loss of $1.98, followed by NCB Financial down $1.85 and Massy Holdings off $1.44.
The JSE Combined Market Index popped 524.68 points to close trading at 323,875.43, while the All Jamaican Composite Index rallied 384.80 points to end at 346,482.52, the JSE Main Index dipped 173.48 points to wrap up trading at 310,953.91. The Junior Market Index gave most of the 54.04 points gained on Tuesday with a drop of 41.33 points to settle at 3,682.38to settle at 3,723.71 and the JSE USD Market Index gained 1.76 points to close at
Investors traded 11,954,522 shares, in all three markets, down from 9,863,787 units on Tuesday. The value of stocks traded on the Junior and Main markets amounts to a mere $48.78 million up from $36 million on Tuesday. The JSE USD market closed after 730,855 shares were traded, for US$13,102 compared to 102,487 units at US$9,725 on Tuesday.
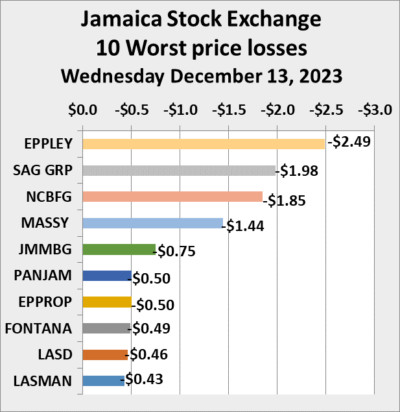 In the preference segment, Eppley 7.50% preference share increased $1.26 and ended at $6.76 Jamaica Public Service 7% fell $1.50 to $44.5 and Productive Business Solutions 9.75% preference share skidded $11.15 to $105.
The market’s PE ratio, the most popular measure used to determine the value of stocks, ended at 21.2 on 2022-23 earnings and 13.8 times those for 2023-24 at the close of trading. ICInsider.com PE ratio chart and the more detailed daily charts provide investors with regularly updated information to help decision-making.
The PE ratio chart covers all ordinary shares on the Jamaica Stock Exchange, grouped by industry, allowing for easy comparisons between the same sector companies and the overall market. The EPS & PE ratios are based on 2023 and 2024 actual or projected earnings, excluding major one off items.
Investors need pertinent information to navigate numerous investment options in the local stock market successfully. The ICInsider.com PE ratio chart and the more detailed daily report charts provide investors with regularly updated information to help decision-making.
Investors should use the chart to help make rational decisions when investing in stocks close to the average for the sector and not going too far from it unless there are compelling reasons to do so. This approach helps to remove emotions from investment decisions and place them on fundamentals while at the same time not being too far from the majority of investors. Investors who buy when the price of a stock is close to the average will find that they are not inclined to overpay for a stock.
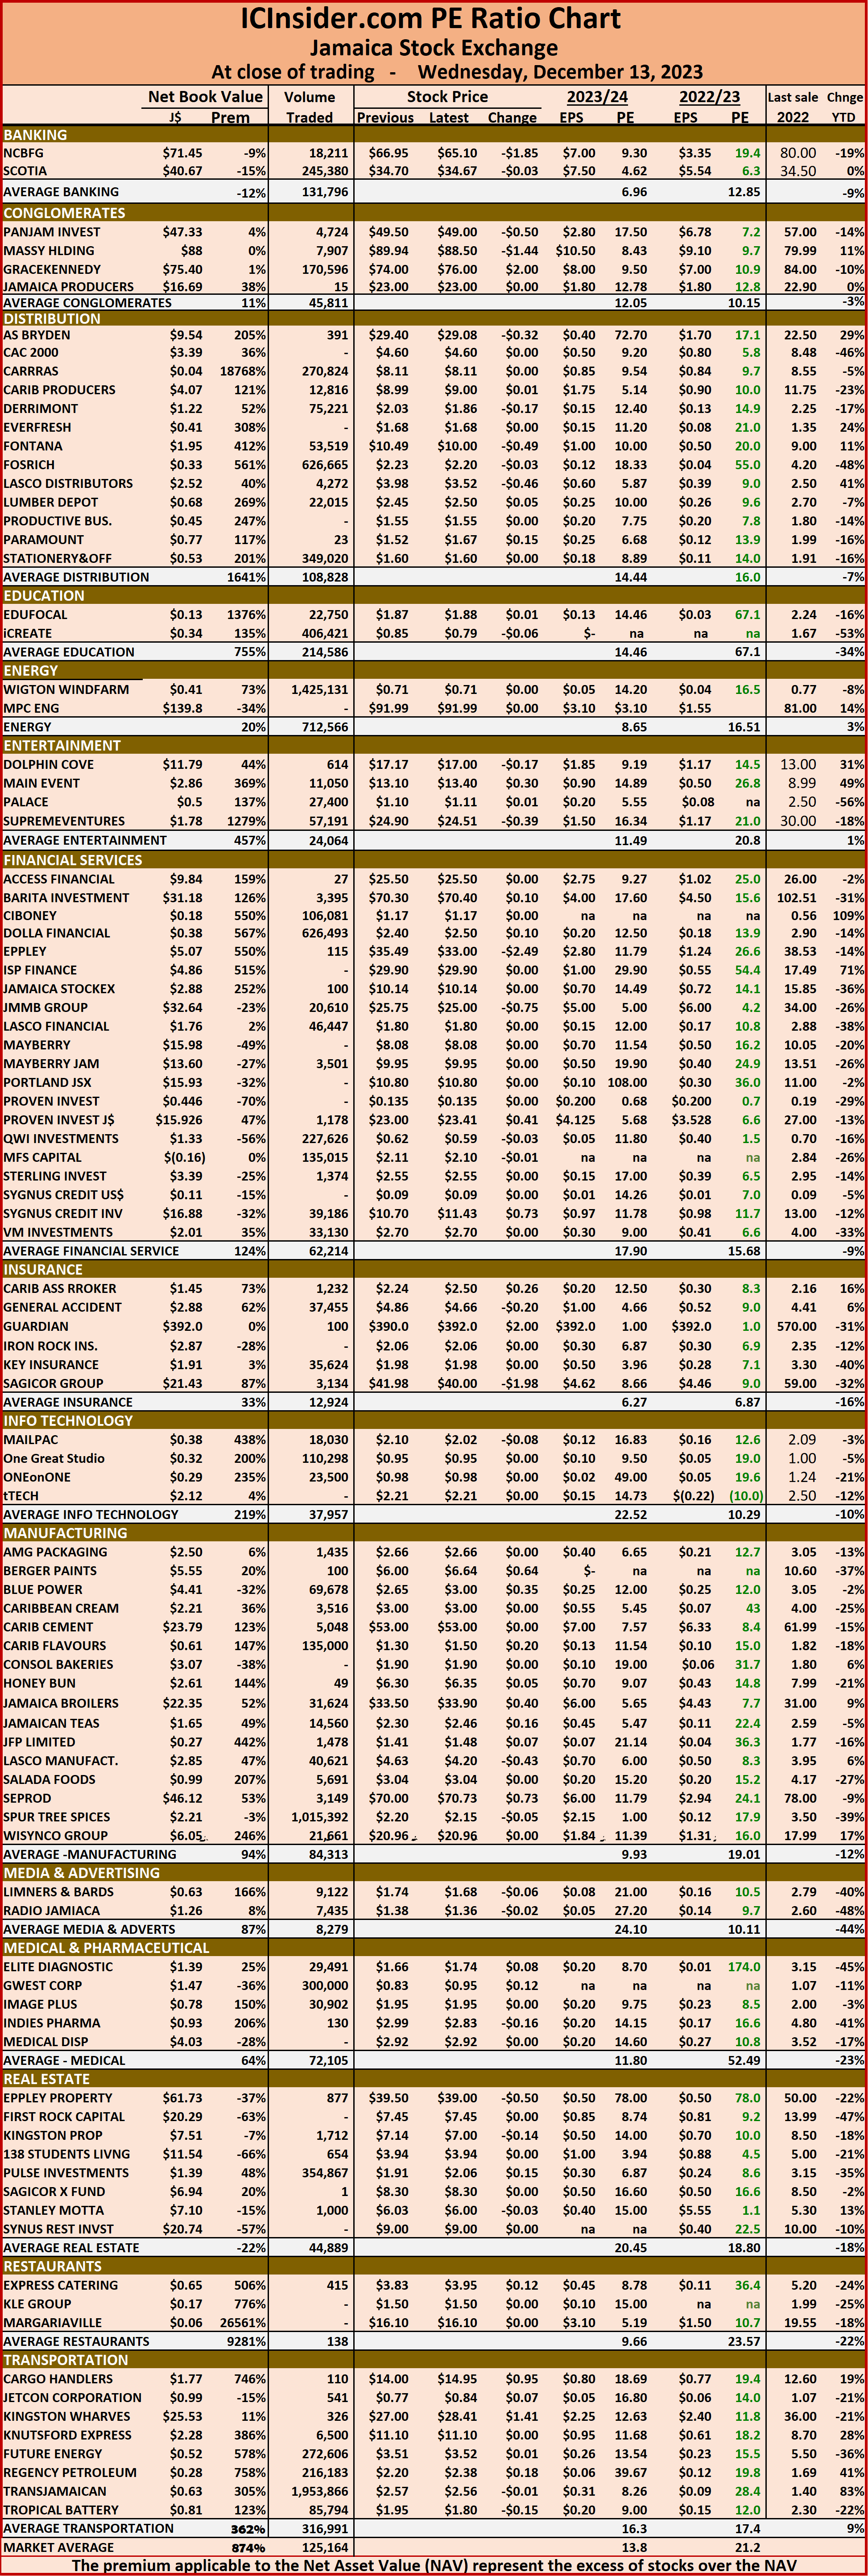 The net asset value of each company is reported as a guide to assess the value of stocks based on this measure quickly. The chart also shows daily changes in stock prices and the percentage year to date price movement based on the last traded prices.
Dividends paid or payable and yields for each company are shown in the Main and Junior Markets’ daily report charts, along with the closing volume pertaining to the highest bid and the lowest offer for each company.
Big gains for Main Market stocks as Junior Market surges
Trading dropped sharply on the Jamaica Stock Exchange on Tuesday, with trading in less than 10 million shares compared to just over 14 million on Monday at a value that was a fraction of that on Monday’s and leading to a modest rise in the Main Market while the junior Market surged sharply from Monday’s close and the USD market closed marginally lower, but Main Market stocks  dominated gainers with Eppley Caribbean Properties Fund jumping $3.50, Sagicor Group up $1.98, followed by NCB Financial $1.95, Jamaica Producers added $1, followed by Wisynco Group up $0.96 and Jamaica Stock Exchange $0.94. Stocks ending with notable declines are Guardian Holdings down $12.95, GraceKennedy down $3, followed by Seprod with a fall of $2.90.
At the close of trading, the JSE Combined Market Index popped 921.00 points to close at 324,400.11, the All Jamaican Composite Index slipped 63.64 points to end at 346,097.72, the JSE Main Index gained 477.68 points to close at 311,127.39. The Junior Market Index surged 54.04 points to settle at 3,723.71 and the JSE USD Market Index fell 1.83 points to 222.00.
Investors traded 9,863,787 shares, in all three markets, down from 14,395,216 units on Monday. The value of stocks traded on the Junior and Main markets amounts to a mere $36 million up from $104.42 million on Monday.  The JSE USD market closed after 102,487 shares were traded for US$9,725 up sharply from 3,759 units at US$430 on Monday.
In the preference segment, Eppley 7.50% preference share dipped $1.40 and ended at $5.50 with investors transferring 920 stocks and Jamaica Public Service 7% climbed $6 to end at $46.
The market’s PE ratio, the most popular measure used to determine the value of stocks, ended at 21 on 2022-23 earnings and 13.8 times those for 2023-24 at the close of trading. ICInsider.com PE ratio chart and the more detailed daily charts provide investors with regularly updated information to help decision-making.
The PE ratio chart covers all ordinary shares on the Jamaica Stock Exchange, grouped by industry, allowing for easy comparisons between the same sector companies and the overall market. The EPS & PE ratios are based on 2023 and 2024 actual or projected earnings, excluding major one off items.
Investors need pertinent information to successfully navigate numerous investment options in the local stock market. The ICInsider.com PE ratio chart and the more detailed daily report charts provide investors with regularly updated information to help decision-making.
Investors should use the chart to help make rational decisions when investing in stocks close to the average for the sector and not going too far from it unless there are compelling reasons to do so. This approach helps to remove emotions from investment decisions and place them on fundamentals while at the same time not being too far from the majority of investors. Investors who buy when the price of a stock is close to the average will find that they are not inclined to overpay for a stock.
 The net asset value of each company is reported as a guide to quickly assess the value of stocks based on this measure. The chart also shows daily changes in stock prices and the percentage year to date price movement based on the last traded prices.
Dividends paid or payable and yields for each company are shown in the Main and Junior Markets’ daily report charts, along with the closing volume pertaining to the highest bid and the lowest offer for each company.
Main Markets gains in thin trading, juniors slip
Trading hit a distressing low point on the Jamaica Stock Exchange on Friday, with the Junior and JSE USD market slipping back as the Main Market climbed appreciably to close out the week positively but with the overall trading down sharply after just $32 million of shares changed hands as Carib Cement rose $2, NCB Financial gained $1.80, Kingston Wharves up $1.49 and AS Bryden up $1.14, while Seprod dropped $1.70 and Scotia Group fell $1.52 helped to negate some of the gains.
 At the close of trading, the JSE Combined Market Index climbed 2,826.48 points to close at 325,204.82, the All Jamaican Composite Index popped 2,477.78 points to finish at 346,872.54, the JSE Main Index rose 3,128.14 points to close at 312,199.59. The Junior Market Index dipped 12.27 points to finish at 3,700.76 and the JSE USD Market Index shed 0.42 points to finish at 230.61.
Investors traded 10,953,060 shares, in all three markets, down from 14,894,359 units on Thursday. The value of stocks traded on the Junior and Main markets amounts to a mere $31.8 million versus $144.79 million on Thursday. The JSE USD market closed after 57,458 shares were traded, for US$3,210 compared to 134,274 units at US$39,564 on Thursday.
In the preference segment, Jamaica Public Service 7% dropped $6.50 in closing at $39.50.
The market’s PE ratio, the most popular measure used to determine the value of stocks, ended at 21.6 on 2022-23 earnings and 13.8 times those for 2023-24 at the close of trading. ICInsider.com PE ratio chart and the more detailed daily charts provide investors with regularly updated information to help decision-making.
 The PE ratio chart covers all ordinary shares on the Jamaica Stock Exchange, grouped by industry, allowing for easy comparisons between the same sector companies and the overall market. The EPS & PE ratios are based on 2023 and 2024 actual or projected earnings, excluding major one off items.
Pertinent information is essential for the successful navigation of the numerous investment options in stock markets. The ICInsider.com PE ratio chart and the more detailed daily report charts provide investors with regularly updated information to help decision-making.
Investors should use the chart to help make rational decisions when investing in stocks close to the average for the sector and not going too far from it unless there are compelling reasons to do so. This approach helps to remove emotions from investment decisions and place them on fundamentals while at the same time not being too far from the majority of investors. Investors who buy when the price of a stock is close to the average will find that they are not inclined to overpay for a stock.
The net asset value of each company is reported as a guide to quickly assess the value of stocks based on this measure. The chart also shows daily changes in stock prices and the percentage year to date price movement based on the last traded prices.
 Dividends paid or payable and yields for each company are shown in the Main and Junior Markets’ daily report charts, along with the closing volume pertaining to the highest bid and the lowest offer for each company.
Big declines in Main & Junior Markets on Tuesday
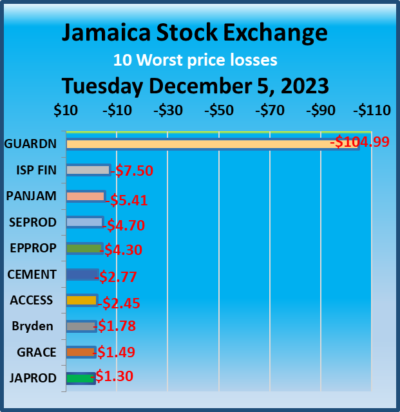
Trading picked up on the Jamaica Stock Exchange on Monday with a greater volume of stocks trading at a much higher value than on Monday, with both the Main and the junior Market indices dropping from Monday’s close while the JSE USD Market rose after sharp declines in a series of stocks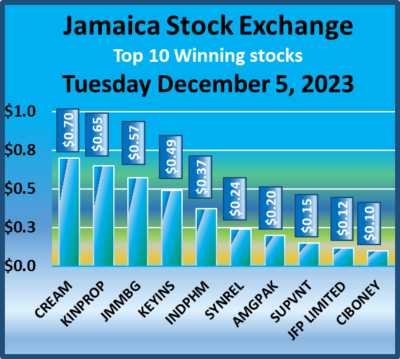 led by Guardian Holdings, down $104.99, ISP finance with a fall of $7.50, Pan Jamaica down $5.41, Seprod falling $4.70, Eppley Property $4.30, Carib Cement off $2.77 and Access down $2,45.
Trading closed with a plunge in JSE Combined Market Index by 4,203.69 points to end trading at 323,867.88, the All Jamaican Composite Index dropped 3,347.62 points to finish at 347,377.50, the JSE Main Index dived 4,153.74 points to 310,988.80. The Junior Market Index dropped 35.17 points to wrap-up trading at 3,677.75 on Tuesday and the JSE USD Market Index rose 3.47 points to end trading at 227.60.
Investors traded 20,284,498 shares, in all three markets, up from 12,196,470 units on Monday. The value of stocks traded on the Junior and Main markets amounts to $174.37 million up from just $40.13 million on Monday, as Wisynco Group dominated trading with 5.18 million shares for $104 million. The JSE USD market closed after 198,410 shares were traded, for US$3,547 compared to 89,619 units at US$7,899 on Monday.
 In the preference segment, Jamaica Public Service 7% popped $1 to end at $46.
The market’s PE ratio, the most popular measure used to determine the value of stocks, ended at 20.8 on 2022-23 earnings and 13.5 times those for 2023-24 at the close of trading. ICInsider.com PE ratio chart and the more detailed daily charts provide investors with regularly updated information to help decision-making.
The PE ratio chart covers all ordinary shares on the Jamaica Stock Exchange, grouped by industry, allowing for easy comparisons between the same sector companies and the overall market. The EPS & PE ratios are based on 2023 and 2024 actual or projected earnings, excluding major one off items.
Investors need pertinent information to successfully navigate numerous investment options in the local stock market. The ICInsider.com PE ratio chart and the more detailed daily report charts provide investors with regularly updated information to help decision-making.
Investors should use the chart to help make rational decisions when investing in stocks close to the average for the sector and not going too far from it unless there are compelling reasons to do so. This approach helps to remove emotions from investment decisions and place them on fundamentals while at the same time not being too far from the majority of investors. Investors who buy when the price of a stock is close to the average will find that they are not inclined to overpay for a stock.
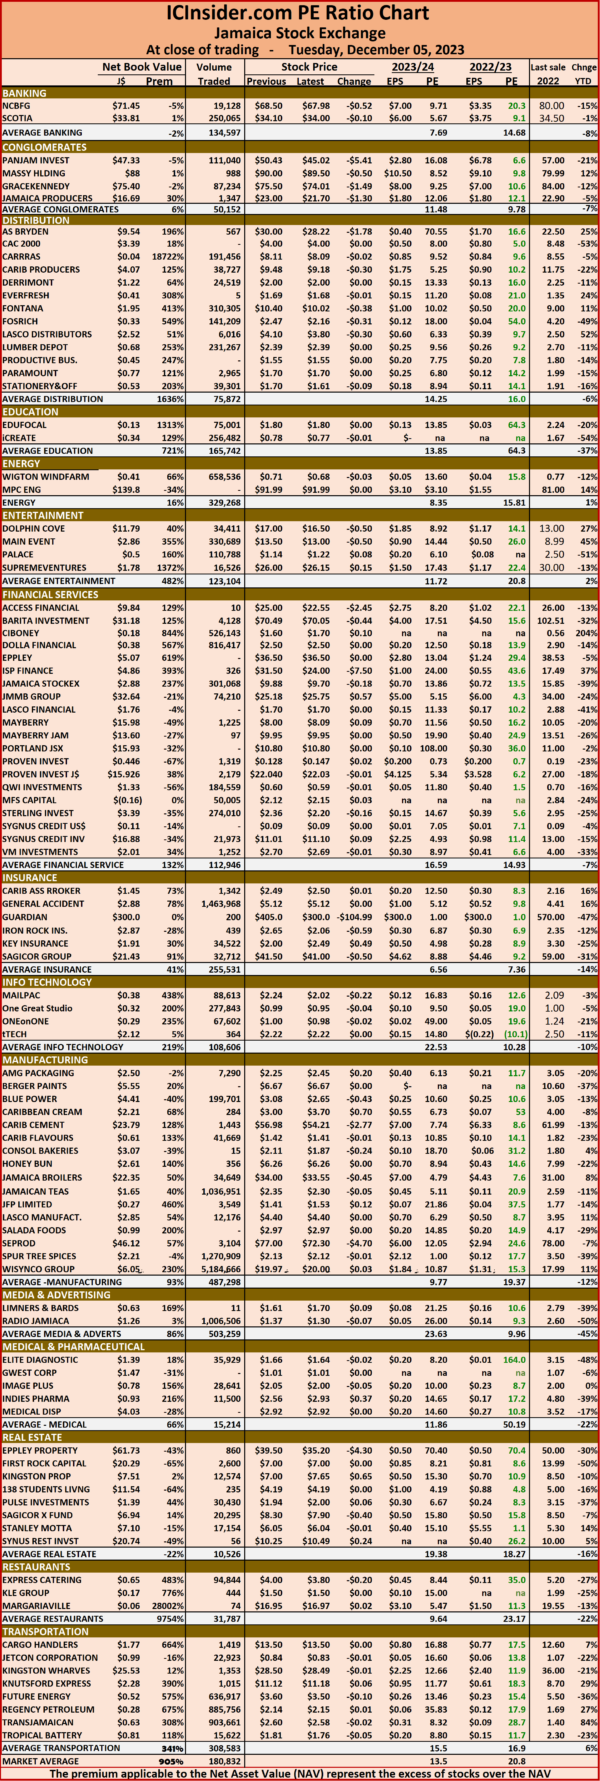 The net asset value of each company is reported as a guide to quickly assess the value of stocks based on this measure. The chart also shows daily changes in stock prices and the percentage year to date price movement based on the last traded prices.
Dividends paid or payable and yields for each company are shown in the Main and Junior Markets’ daily report charts, along with the closing volume pertaining to the highest bid and the lowest offer for each company.
Soft start to December for the JSE markets
Trading fell back from Thursday’s surge to start December on a soft note, with the Main index rising but the Junior and JSE USD Markets slipped with lower volumes and value than Thursday to start the final month of the year trading on the Jamaica Stock Exchange.
 At the close of trading, the JSE Combined Market Index popped 366.08 points to close at 328,951.43, the All Jamaican Composite Index climbed 1,439.55 points to end the final month of the year at 351,375.40, the JSE Main Index rose 521.37 points to close at 315,669.00. The Junior Market Index after it surged 76.62 points on Thursday, dipped 14.05 points to close at 3,757.04 on Friday as trading fell sharply in the market to start the final month of the year of trading negatively and the JSE USD Market Index dipped 1.01 points to wrap-up trading for the week at 226.85.
Investors traded 11,233,174 shares, in all three markets, down from 38,220,893 units on Thursday. The value of stocks traded on the Junior and Main markets was $43.75 million down from $102.4 million on Thursday. The JSE USD market closed after 37,877 shares were traded, for US$2,504 compared to 826,627 units at US$14,407 on Thursday.
In the preference segment, Jamaica Public Service 7% shed $1 to close at $45.
 The market’s PE ratio, the most popular measure used to determine the value of stocks, ended at 21.8 on 2022-23 earnings and 14 times those for 2023-24 at the close of trading. ICInsider.com PE ratio chart and the more detailed daily charts provide investors with regularly updated information to help decision-making.
The PE ratio chart covers all ordinary shares on the Jamaica Stock Exchange, grouped by industry, allowing for easy comparisons between the same sector companies and the overall market. The EPS & PE ratios are based on 2023 and 2024 actual or projected earnings, excluding major one off items.
Investors need pertinent information to successfully navigate numerous investment options in the local stock market. The ICInsider.com PE ratio chart and the more detailed daily report charts provide investors with regularly updated information to help decision-making.
Investors should use the chart to help make rational decisions when investing in stocks close to the average for the sector and not going too far from it unless there are compelling reasons to do so. This approach helps to remove emotions from investment decisions and place them on fundamentals while at the same time not being too far from the majority of investors. Investors who buy when the price of a stock is close to the average will find that they are not inclined to overpay for a stock.
 The net asset value of each company is reported as a guide to quickly assess the value of stocks based on this measure. The chart also shows daily changes in stock prices and the percentage year to date price movement based on the last traded prices.
Dividends paid or payable and yields for each company are shown in the Main and Junior Markets’ daily report charts, along with the closing volume pertaining to the highest bid and the lowest offer for each company.
Big surge in trading for Jamaica Stock Exchange
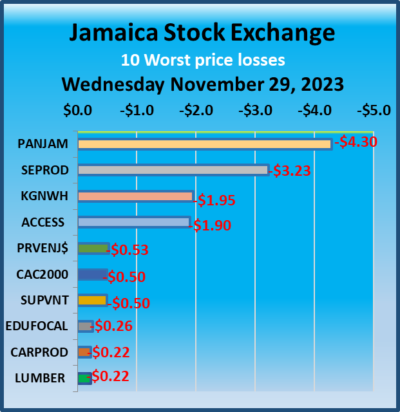
Trading surged sharply on the Jamaica Stock Exchange on Wednesday, with the volume jumping 650 percent over that on Tuesday and resulting in the Main Market and the JSE USD Market rising while the Junior Market slipped modestly to close out the day that delivered a big increase in the value of stocks traded including higher volume in the JSE USD Market compared to Tuesday.
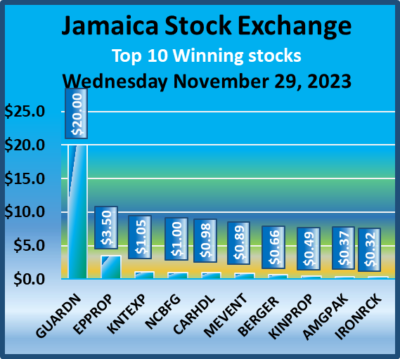 At the close of trading, the JSE Combined Market Index rose 793.44 points to close at 326,055.23, the All Jamaican Composite Index declined by 193.70 points to 346,967.04, the JSE Main Index gained 939.00 points to finish at 313,164.96. The Junior Market Index shed 9.97 points to end trading at 3,694.47 and the JSE USD Market Index climbed 4.49 points to end at 228.26.
Investors traded 86,557,262 shares, in all three markets up from 11,376,869 units on Tuesday, with Indies Pharma trading with 48 million shares and First Rock Real Estate USD share in an exchange of 19,350,000 units. The value of stocks traded on the Junior and Main markets ended at $405.12 million up from $58.95 million on Tuesday. The JSE USD market closed after 22,289,394 shares were traded, for US$1,286,713 compared to 132,328 units at US$8,195 on Tuesday.
 In the preference segment, 138 Student Living preference share rallied $17.21 to close at $106.49.
The market’s PE ratio, the most popular measure used to determine the value of stocks, ended at 21.5 on 2022-23 earnings and 13.9 times those for 2023-24 at the close of trading. ICInsider.com PE ratio chart and the more detailed daily charts provide investors with regularly updated information to help decision-making.
The PE ratio chart covers all ordinary shares on the Jamaica Stock Exchange, grouped by industry, allowing for easy comparisons between the same sector companies and the overall market. The EPS & PE ratios are based on 2023 and 2024 actual or projected earnings, excluding major one off items.
Investors need pertinent information to successfully navigate numerous investment options in the local stock market. The ICInsider.com PE ratio chart and the more detailed daily report charts provide investors with regularly updated information to help decision-making.
Investors should use the chart to help make rational decisions when investing in stocks close to the average for the sector and not going too far from it unless there are compelling reasons to do so. This approach helps to remove emotions from investment decisions and place them on fundamentals while at the same time not being too far from the majority of investors. Investors who buy when the price of a stock is close to the average will find that they are not inclined to overpay for a stock.
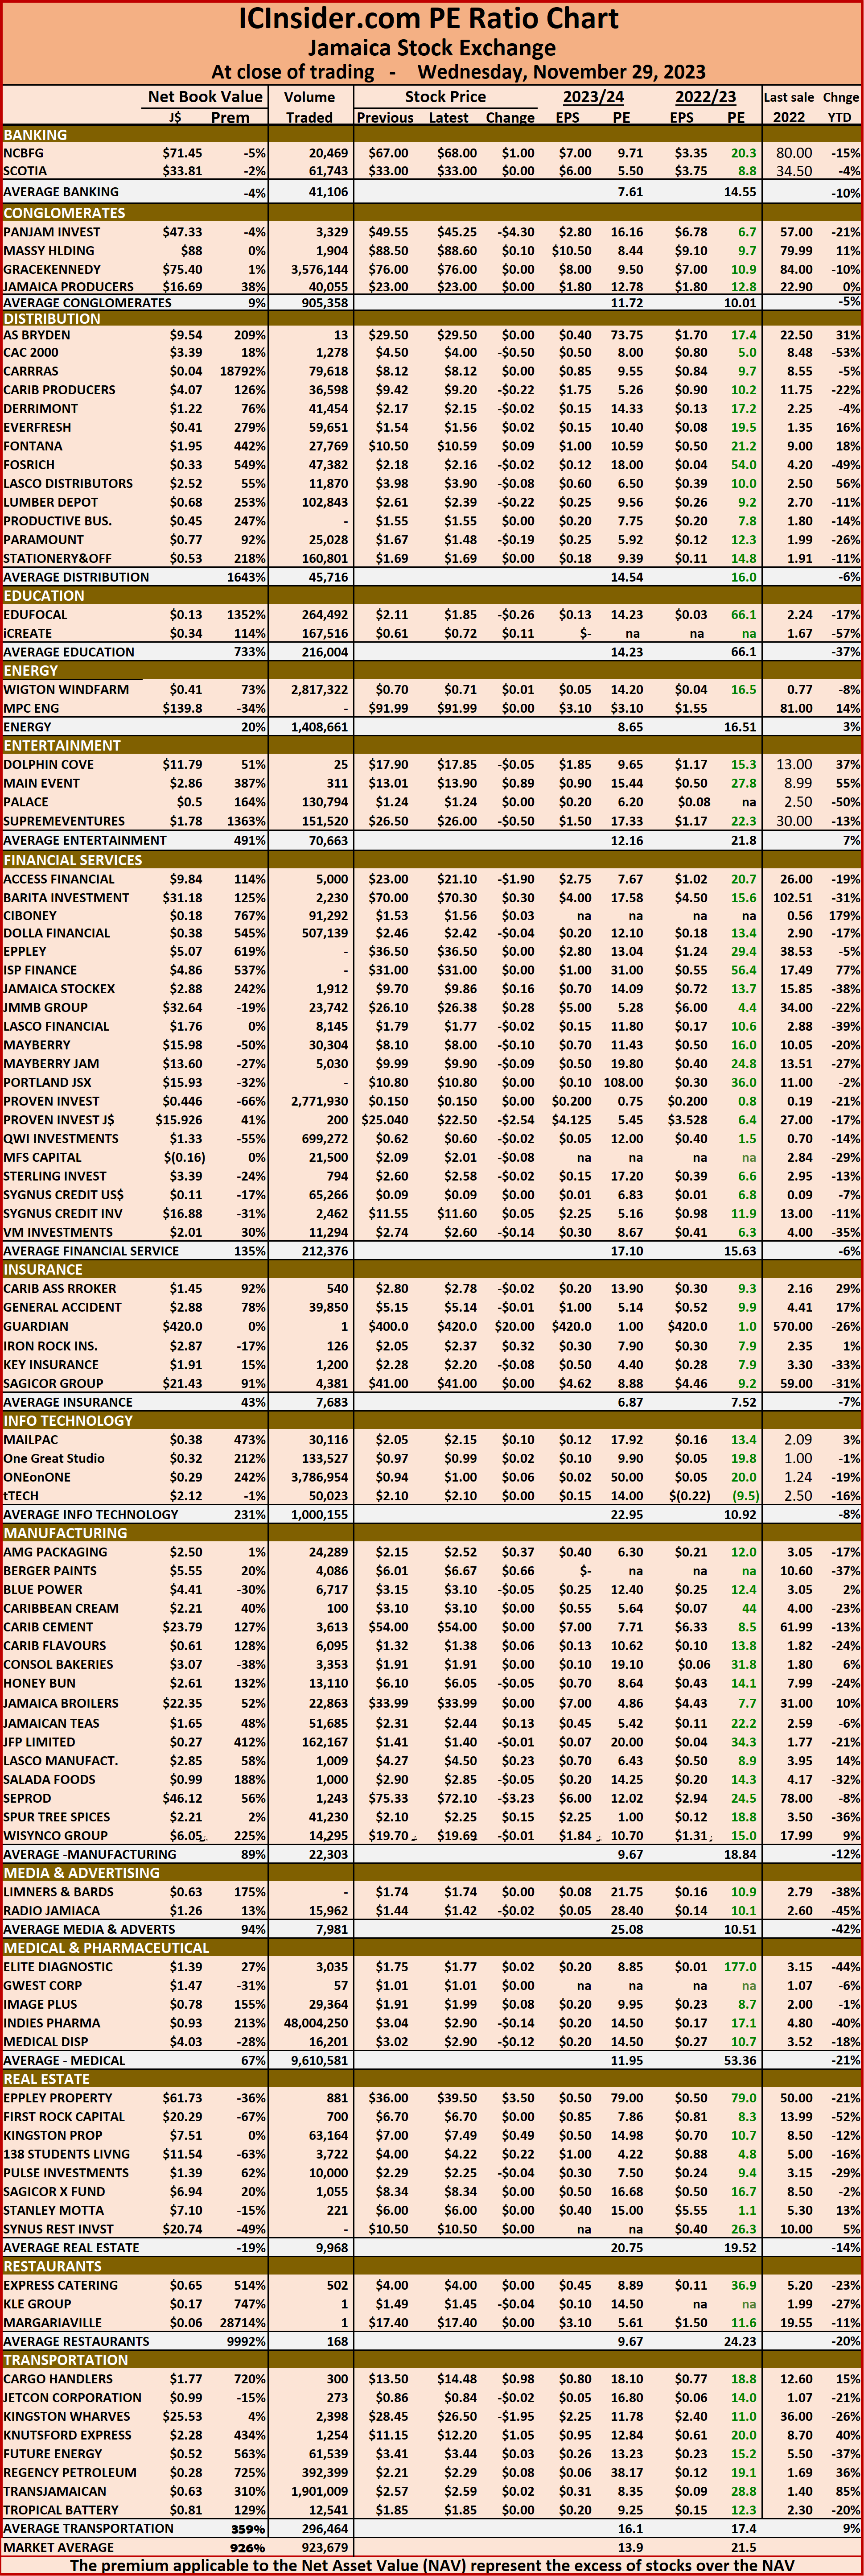 The net asset value of each company is reported as a guide to quickly assess the value of stocks based on this measure. The chart also shows daily changes in stock prices and the percentage year to date price movement based on the last traded prices.
Dividends paid or payable and yields for each company are shown in the Main and Junior Markets’ daily report charts, along with the closing volume pertaining to the highest bid and the lowest offer for each company.
Decline for all JSE Markets as trading climbs
The Main Market of the Jamaica Stock Exchange closed down on Tuesday, while the Junior Market slipped a few points and the JSE USD Market fell at the close of the market, with an increase in the value and volume of stocks traded compared to Monday.
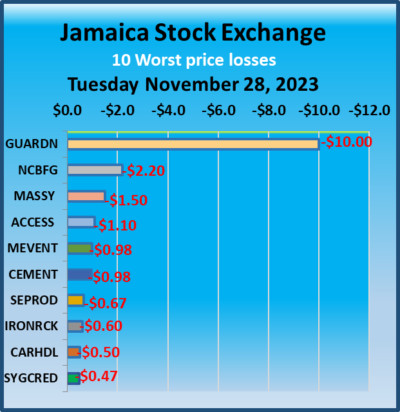
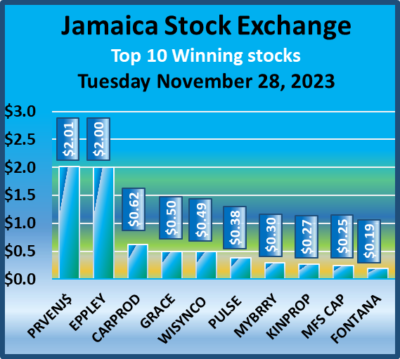 At the close of trading, the JSE Combined Market Index dropped 3,283.21 points to 325,261.79, the All Jamaican Composite Index dived 3,930.88 points to cease trading at 347,160.74, the JSE Main Index shed 3,454.22 points to 312,225.96. The Junior Market Index shed 4.96 points to cease trading at 3,704.44 and the JSE USD Market Index shed 3.22 points to conclude trading at 223.77.
Investors traded 11,376,869 shares, in all three markets up from 9,923,864 units on Monday. The value of stocks traded on the Junior and Main markets ended at $58.95 million up from $43.02 million on Monday. The JSE USD market closed after 132,328 shares were exchanged, for US$8,195 compared to 837,700 units at US$41,015 on Monday.
In the preference segment, Productive Business Solutions 9.75% preference share dropped $12 to end at $100.
 The market’s PE ratio, the most popular measure used to determine the value of stocks, ended at 21.5 on 2022-23 earnings and 14 times those for 2023-24 at the close of trading. ICInsider.com PE ratio chart and the more detailed daily charts provide investors with regularly updated information to help decision-making.
The PE ratio chart covers all ordinary shares on the Jamaica Stock Exchange, grouped by industry, allowing for easy comparisons between the same sector companies and the overall market. The EPS & PE ratios are based on 2023 and 2024 actual or projected earnings, excluding major one off items.
Investors need pertinent information to successfully navigate numerous investment options in the local stock market. The ICInsider.com PE ratio chart and the more detailed daily report charts provide investors with regularly updated information to help decision-making.
Investors should use the chart to help make rational decisions when investing in stocks close to the average for the sector and not going too far from it unless there are compelling reasons to do so. This approach helps to remove emotions from investment decisions and place them on fundamentals while at the same time not being too far from the majority of investors.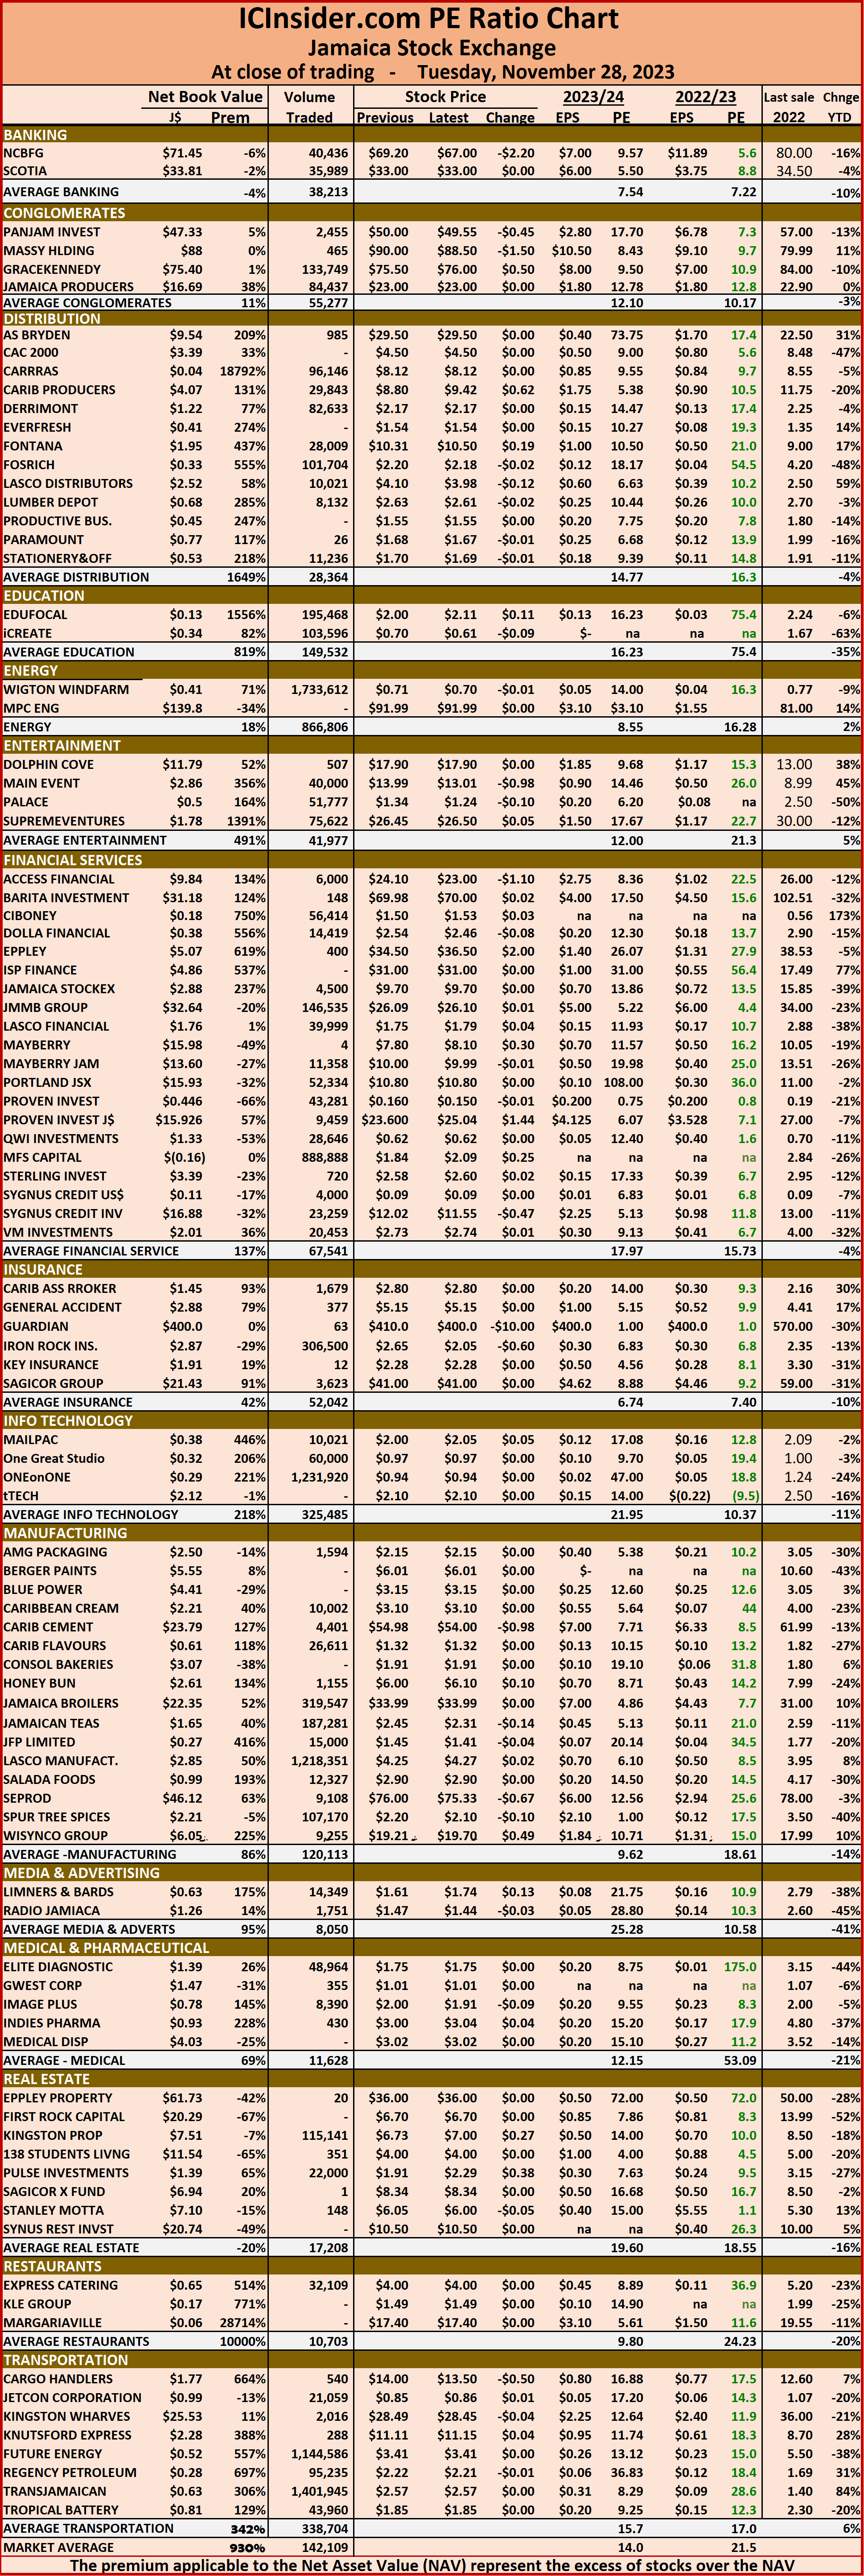 Investors who buy when the price of a stock is close to the average will find that they are not inclined to overpay for a stock.
The net asset value of each company is reported as a guide to quickly assess the value of stocks based on this measure. The chart also shows daily changes in stock prices and the percentage year to date price movement based on the last traded prices.
Dividends paid or payable and yields for each company are shown in the Main and Junior Markets’ daily report charts, along with the closing volume pertaining to the highest bid and the lowest offer for each company.
JSE USD & Main Markets, Juniors fall
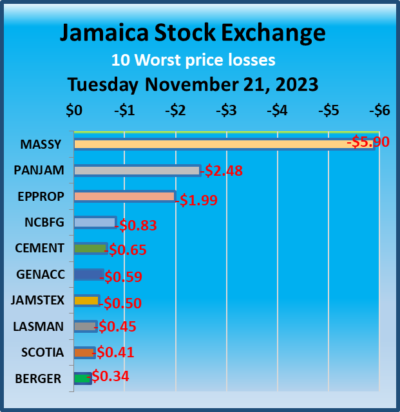
The Main Market of the Jamaica Stock Exchange bounced to close of trading on Tuesday and the USD Market inched higher but the Junior Market declined for a second straight day as Junior Market value and volume of stocks traded jumped over that on Monday but the Main Market suffered a sharp fall in trading levels.
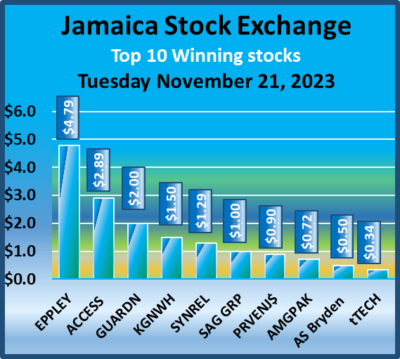 At the close of trading on tuesday, the JSE Combined Market Index rallied 320.57 points to close at 326,210.63, the All Jamaican Composite Index advanced 1,587.93 points to end the day at 347,844.97, while the JSE Main Index climbed 482.71 points to 312,931.89. At close of the market, the Junior Market Index slipped 15.04 points to 3,736.98 and the JSE USD Market Index rose 0.38 points to lock up trading at 227.85.
Investors traded 13,491,927 shares, in all markets compared to 9,432,720 units on Monday. The value of stocks changing hands on the Junior and Main markets amount to $44.78 million up from $48.06 million on Monday. The JSE USD market closed with 830,053 shares being traded, for US$28,943 compared to 509,457 units at US$14,389 on Monday.
In the preference segment, Jamaica Public Service 7% climbed $4.99 in closing at $46 and Productive Business Solutions 10.5 % preference share rose $50 to $1,200.
 The market’s PE ratio, the most popular measure used to determine the value of stocks, ended at 21.3 on 2022-23 earnings and 13.8 times those for 2023-24 at the close of trading. ICInsider.com PE ratio chart and the more detailed daily charts provide investors with regularly updated information to help decision-making.
The PE ratio chart covers all ordinary shares on the Jamaica Stock Exchange, grouped by industry, allowing for easy comparisons between the same sector companies and the overall market. The EPS & PE ratios are based on 2023 and 2024 actual or projected earnings, excluding major one off items.
Investors need pertinent information to successfully navigate numerous investment options in the local stock market. The ICInsider.com PE ratio chart and the more detailed daily report charts provide investors with regularly updated information to help decision-making.
Investors should use the chart to help make rational decisions when investing in stocks close to the average for the sector and not going too far from it unless there are compelling reasons to do so. This approach helps to remove emotions from investment decisions and place them on fundamentals while at the same time not being too far from the majority of investors. Investors who buy when the price of a stock is close to the average will find that they are not inclined to overpay for a stock.
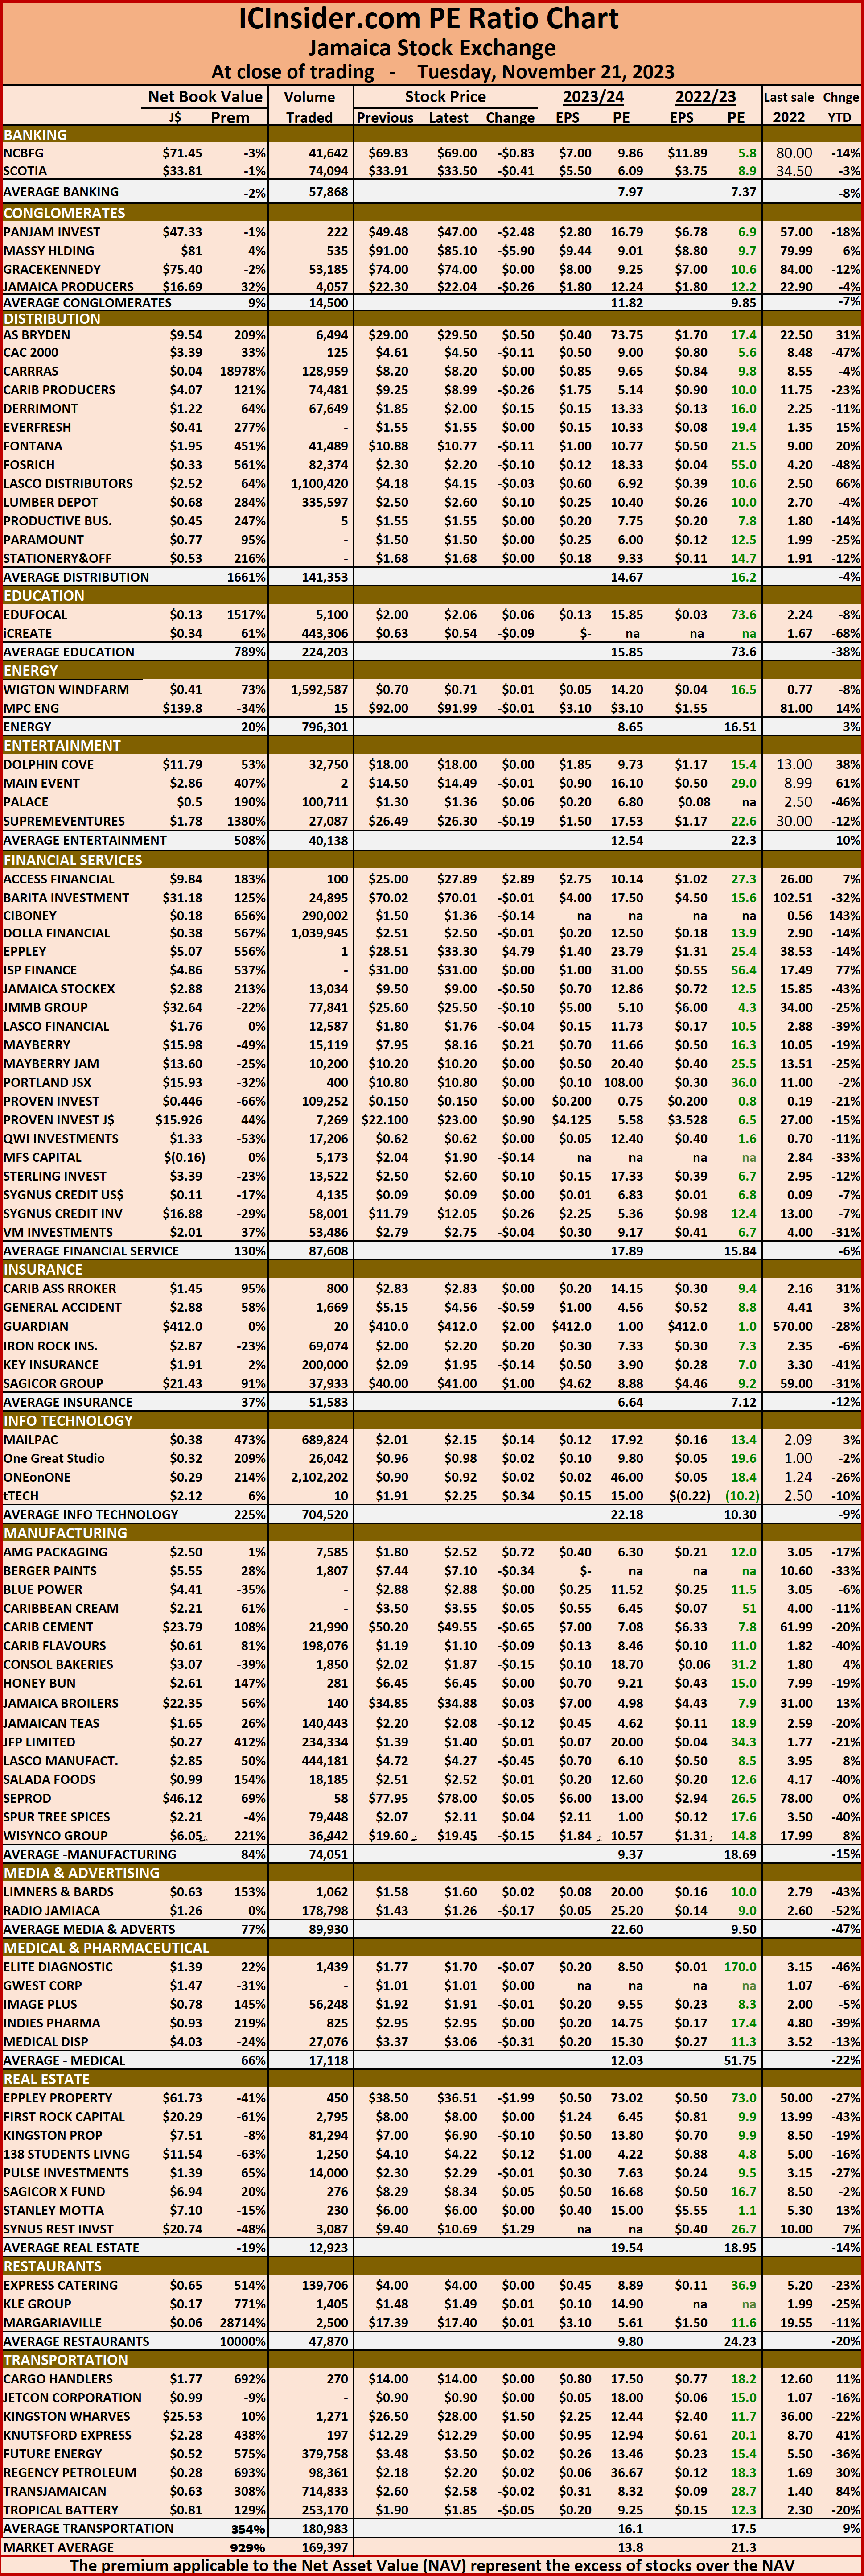 The net asset value of each company is reported as a guide to quickly assess the value of stocks based on this measure. The chart also shows daily changes in stock prices and the percentage year to date price movement based on the last traded prices.
Dividends paid or payable and yields for each company are shown in the Main and Junior Markets’ daily report charts, along with the closing volume pertaining to the highest bid and the lowest offer for each company.
Junior & USD markets rally, Main Market steady
The Jamaica Stock Exchange USD Market and the Junior Market closed higher at the end of trading on Wednesday but the Main Market ended marginally higher at the close as the volume of stocked traded remained at a heightened level but below that on Tuesday.
 At the close of trading on Wednesday, the JSE Combined Market Index popped 467.04 points to 328,599.13, the All Jamaican Composite Index dipped 419.77 points to 349,209.36, the JSE Main Index rose 57.72 points to end trading at 314,938.63. The Junior Market Index jumped 47.04 points to 3,794.73 and the JSE USD Market Index rose 2.54 points to finish at 228.22.
Investors traded 59,330,218 shares, in all three markets, compared to 114,901,415 units on Tuesday. The value of stocks traded on the Junior and Main markets ended at $180.35 million from $276.5 million on Tuesday. The JSE USD market closed after 14,818 shares were traded for US$1,462 compared to 647,665 units at US$35,342 on Tuesday.
In the preference segment, Jamaica Public Service 7% shed 99 cents in closing at $41.01 and Productive Business Solutions 10.5% preference share advanced $50 to close at $1150.
 The market’s PE ratio, the most popular measure used to determine the value of stocks, ended at 21.3 on 2022-23 earnings and 11.9 times those for 2023-24 at the close of trading. ICInsider.com PE ratio chart and the more detailed daily charts provide investors with regularly updated information to help decision-making.
The PE ratio chart covers all ordinary shares on the Jamaica Stock Exchange, grouped by industry, allowing for easy comparisons between the same sector companies and the overall market. The EPS & PE ratios are based on 2023 and 2024 actual or projected earnings, excluding major one off items.
Investors need pertinent information to successfully navigate numerous investment options in the local stock market. The ICInsider.com PE ratio chart and the more detailed daily report charts provide investors with regularly updated information to help decision-making.
Investors should use the chart to help make rational decisions when investing in stocks close to the average for the sector and not going too far from it unless there are compelling reasons to do so. This approach helps to remove emotions from investment decisions and place them on fundamentals while at the same time not being too far from the majority of investors. Investors who buy when the price of a stock is close to the average will find that they are not inclined to overpay for a stock.
 The net asset value of each company is reported as a guide to quickly assess the value of stocks based on this measure. The chart also shows daily changes in stock prices and the percentage year to date price movement based on the last traded prices.
Dividends paid or payable and yields for each company are shown in the Main and Junior Markets’ daily report charts, along with the closing volume pertaining to the highest bid and the lowest offer for each company.
JSE Main Market rallies as Juniors dropped
The Jamaica Stock Exchange Main Market closed higher at the close of trading on Monday as the JSE USD Market inched marginally lower but the Junior Market plunged 63 points, following a moderate rise in the volume of stocks traded with the value jumping above that on Friday.
 At the close of trading on Monday, the JSE Combined Market Index popped 136.50 points to 329,091.28, the All Jamaican Composite Index jumped 2,334.48 points to 350,357.91, after shares of NCB Financial jumped $6.51 to $73.50, the JSE Main Index advanced 733.38 points to 315,732.62. The Junior Market Index rose 62.76 points to close trading at 3,765.99 and the JSE USD Market Index lost 0.10 points to 223.37.
Investors traded 31,517,364 shares in all three markets, versus 13,255,970 units on Friday. The value of stocks traded climbed on the Junior and Main markets to $149. 07 million from $118.38 million on Friday. The JSE USD market closed after 647,665 shares were traded, for US$35,342 up sharply from 126,524 units at US$3,325 on Friday.
In the preference segment, Jamaica Public Service 7% declined $8 and ended at $42.
The market’s PE ratio, the most popular measure used to determine the value of stocks, ended at 21.4 on 2022-23 earnings and 11.9 times those for 2023-24 at the close of trading. ICInsider.com PE ratio chart and the more detailed daily charts provide investors with regularly updated information to help decision-making.
 The PE ratio chart covers all ordinary shares on the Jamaica Stock Exchange, grouped by industry, allowing for easy comparisons between the same sector companies and the overall market. The EPS & PE ratios are based on 2023 and 2024 actual or projected earnings, excluding major one off items.
Investors need pertinent information to successfully navigate numerous investment options in the local stock market. The ICInsider.com PE ratio chart and the more detailed daily report charts provide investors with regularly updated information to help decision-making.
Investors should use the chart to help make rational decisions when investing in stocks close to the average for the sector and not going too far from it unless there are compelling reasons to do so. This approach helps to remove emotions from investment decisions and place them on fundamentals while at the same time not being too far from the majority of investors. Investors who buy when the price of a stock is close to the average will find that they are not inclined to overpay for a stock.
 The net asset value of each company is reported as a guide to quickly assess the value of stocks based on this measure. The chart also shows daily changes in stock prices and the percentage year to date price movement based on the last traded prices.
Dividends paid or payable and yields for each company are shown in the Main and Junior Markets’ daily report charts, along with the closing volume pertaining to the highest bid and the lowest offer for each company.