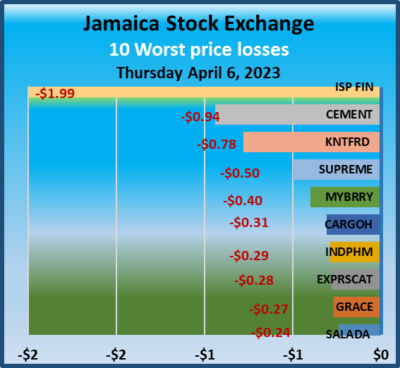
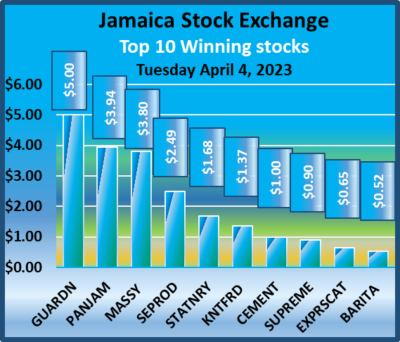
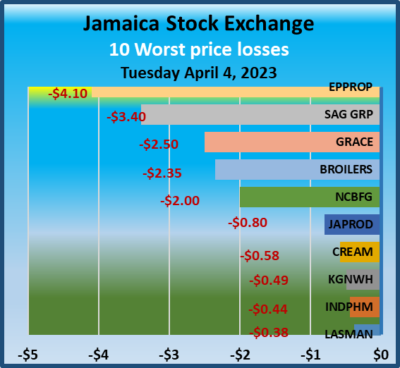
Markets recorded gains ahead of the long Easter weekend break, on the Jamaica Stock Exchange Thursday, with the Main Market leading the way, with the market index climbing over 1,000 points while the Junior Market and the JSE USD market closed slightly higher.
 Trading ended with the JSE Combined Market Index popping 1,147.93 points to 343,075.79, the All Jamaican Composite Index rising 1,349.36 points to close at 370,515.63, the JSE Main Index gaining 1,175.40 points to settle at 331,393.01, while the Junior Market rose 5.72 points to close at 3,698.91 and the JSE USD Market Index rose 9.57 points to end at 219.91.
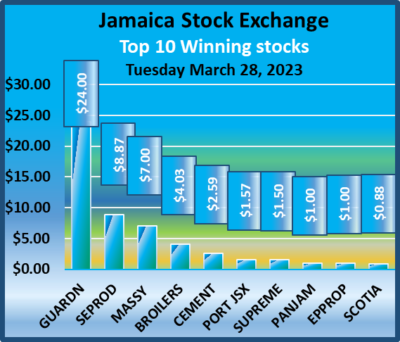
In the preference section of the Main Market that is not reflected in the TOP10 graphs, JPS 7 percent dropped $14.30 to $69.70.
At the close, investors exchanged 18,066,552 shares in all three markets, compared with 85,549,341 units on Wednesday, with the value of trading on Thursday amounting to just $55.7, million down sharply from $1.73 billion on the previous trading day. Trading on the JSE USD market resulted in investors exchanging 694,591 shares for US$29,863, down from 303,705 units at US$35,767 on Wednesday.
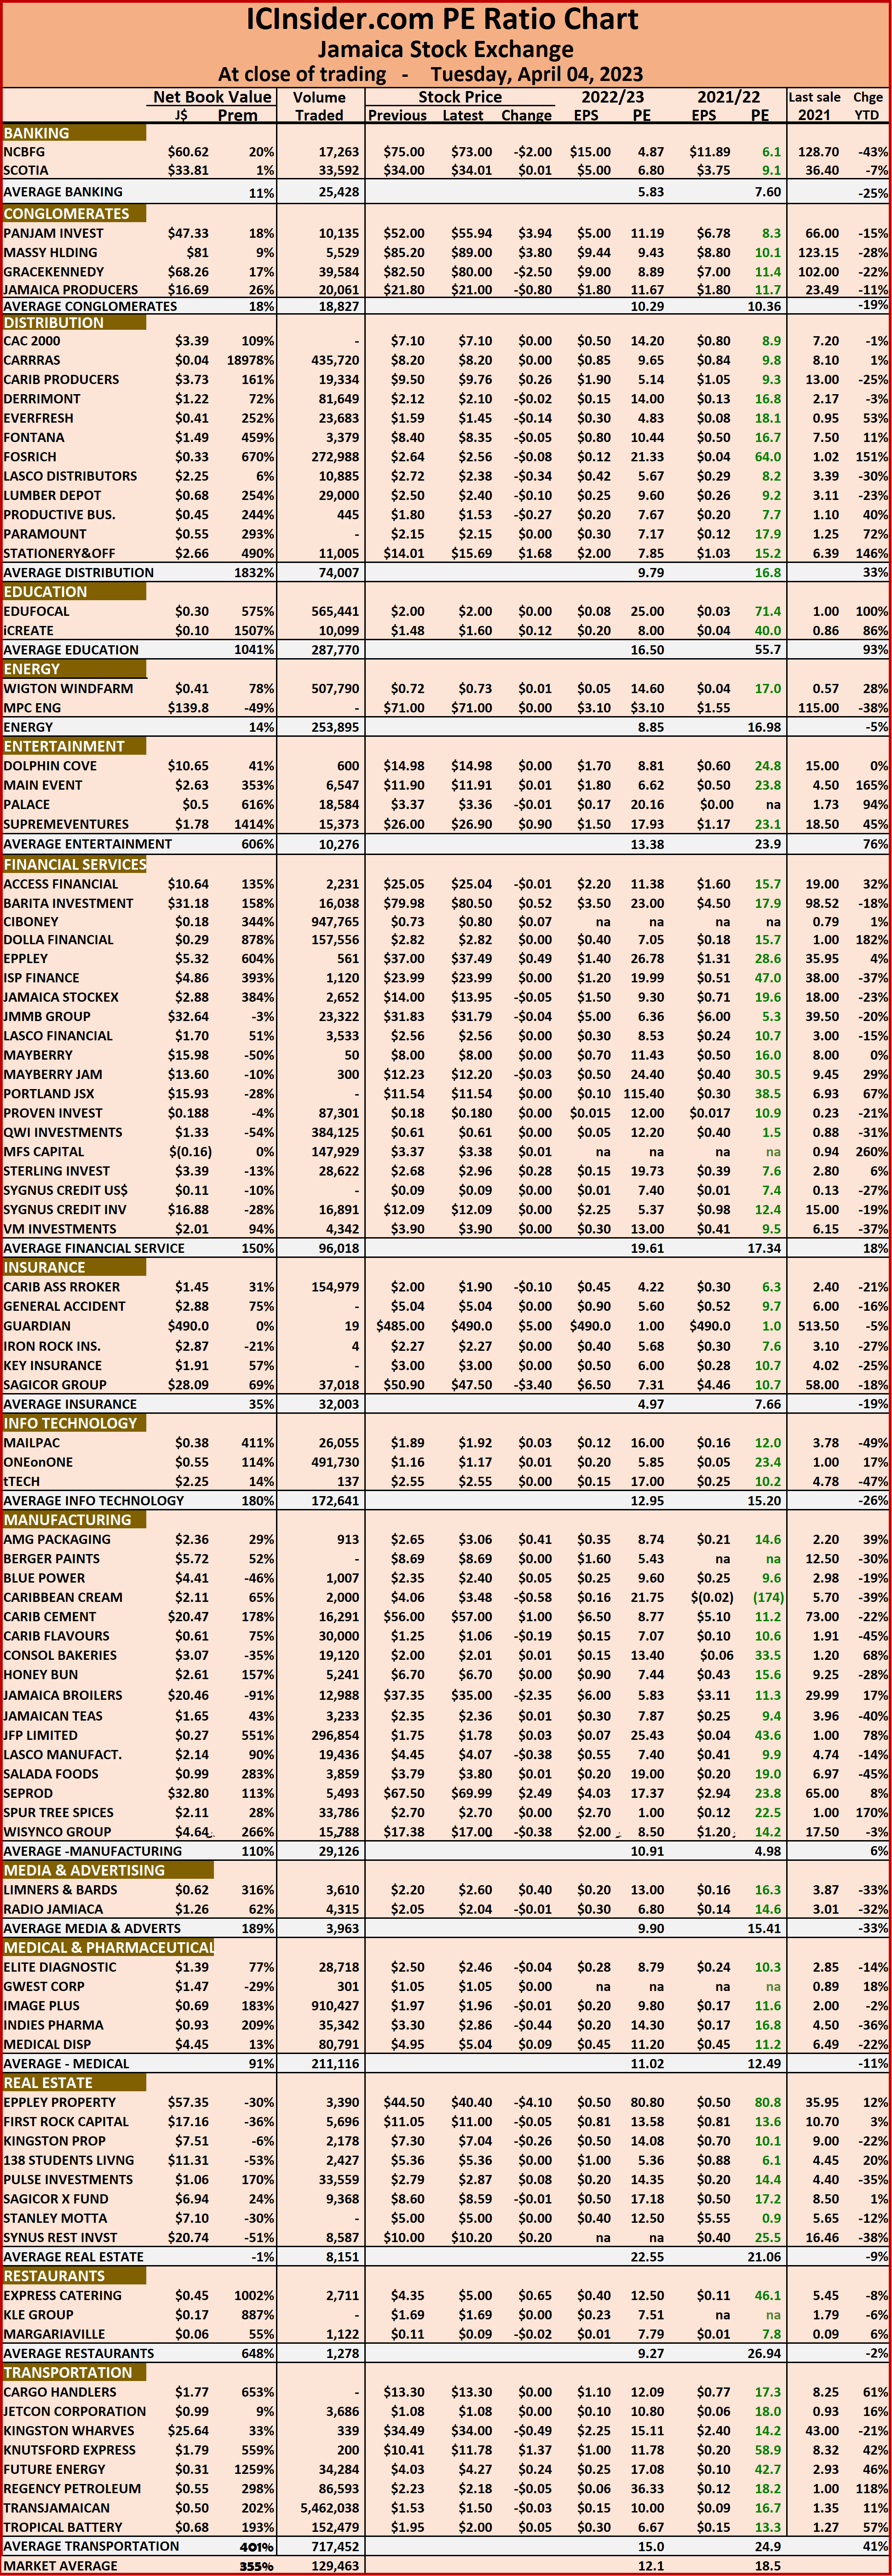
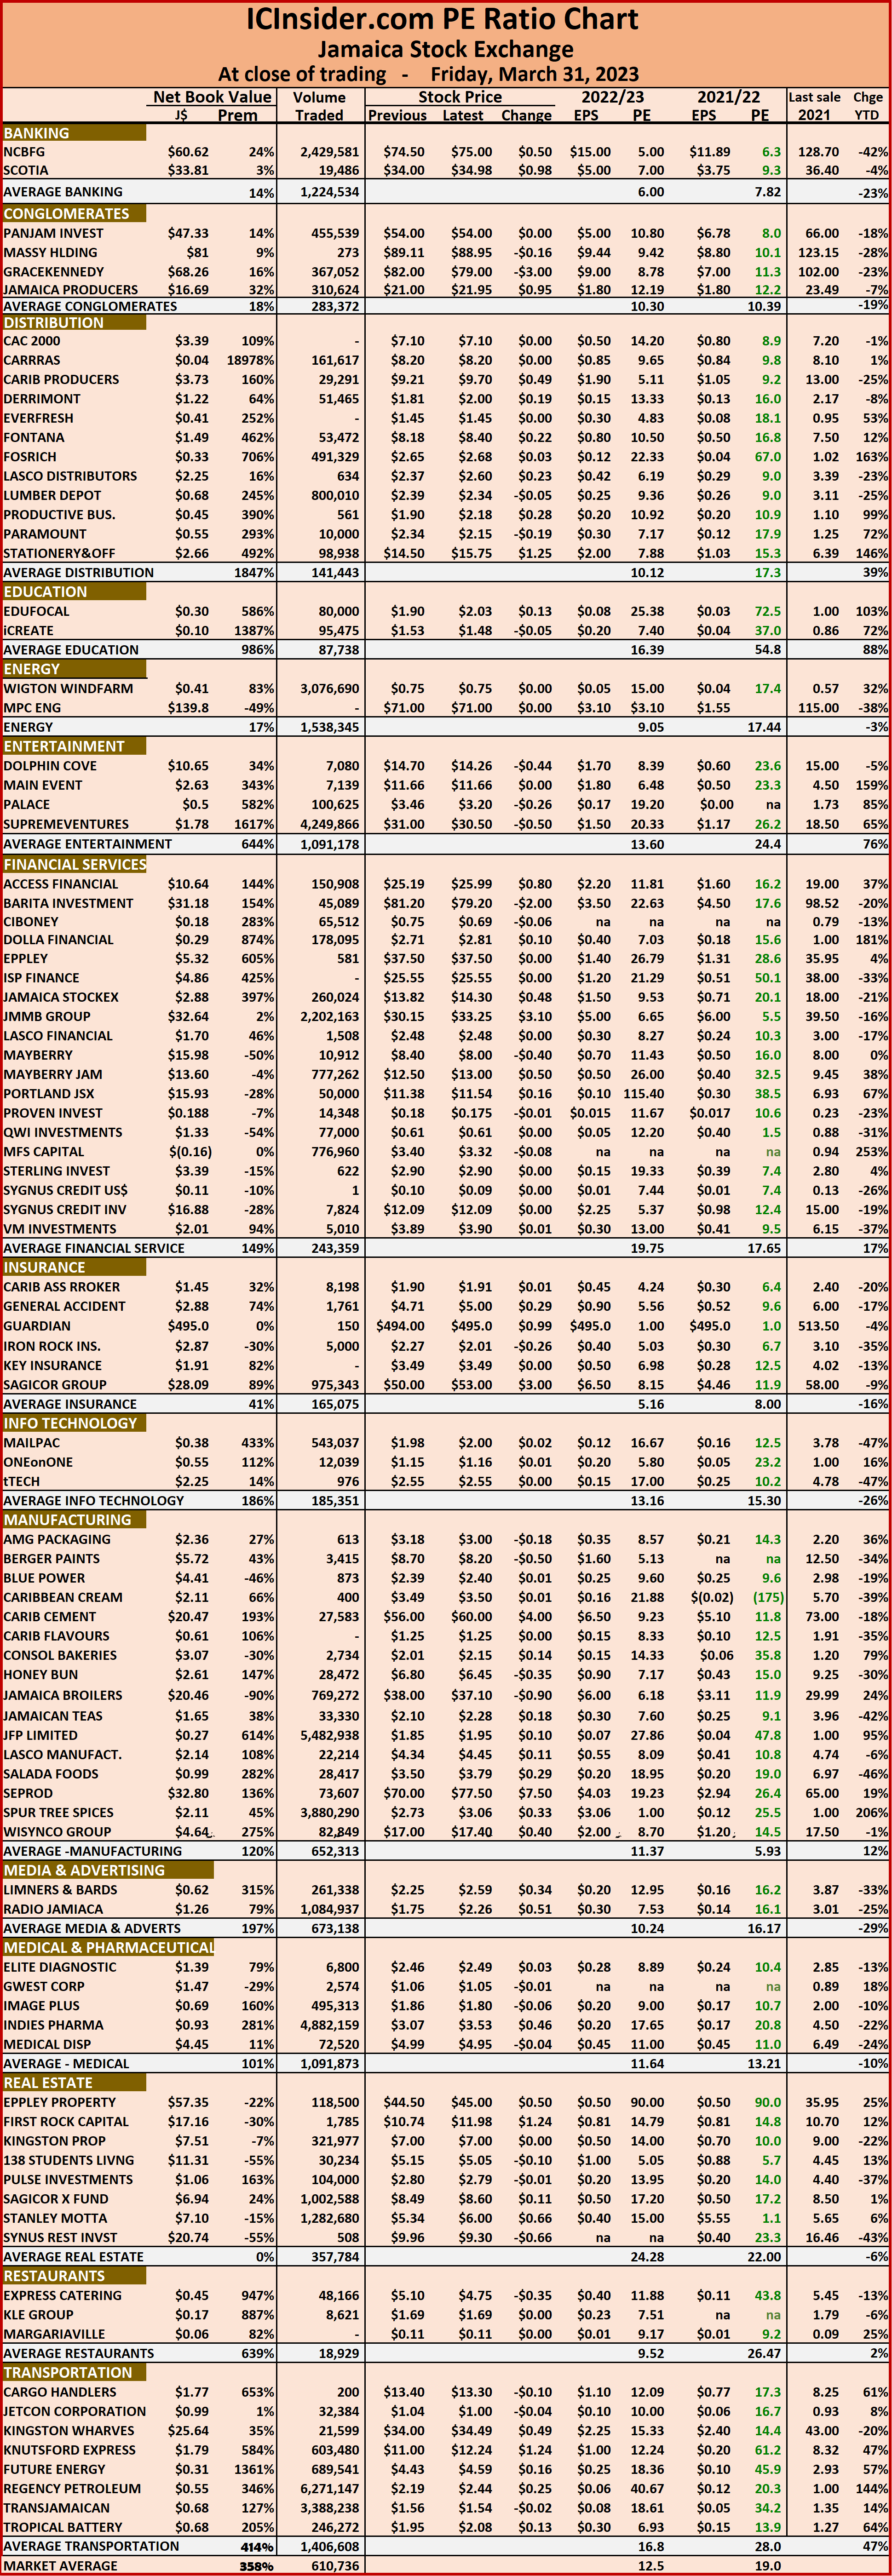
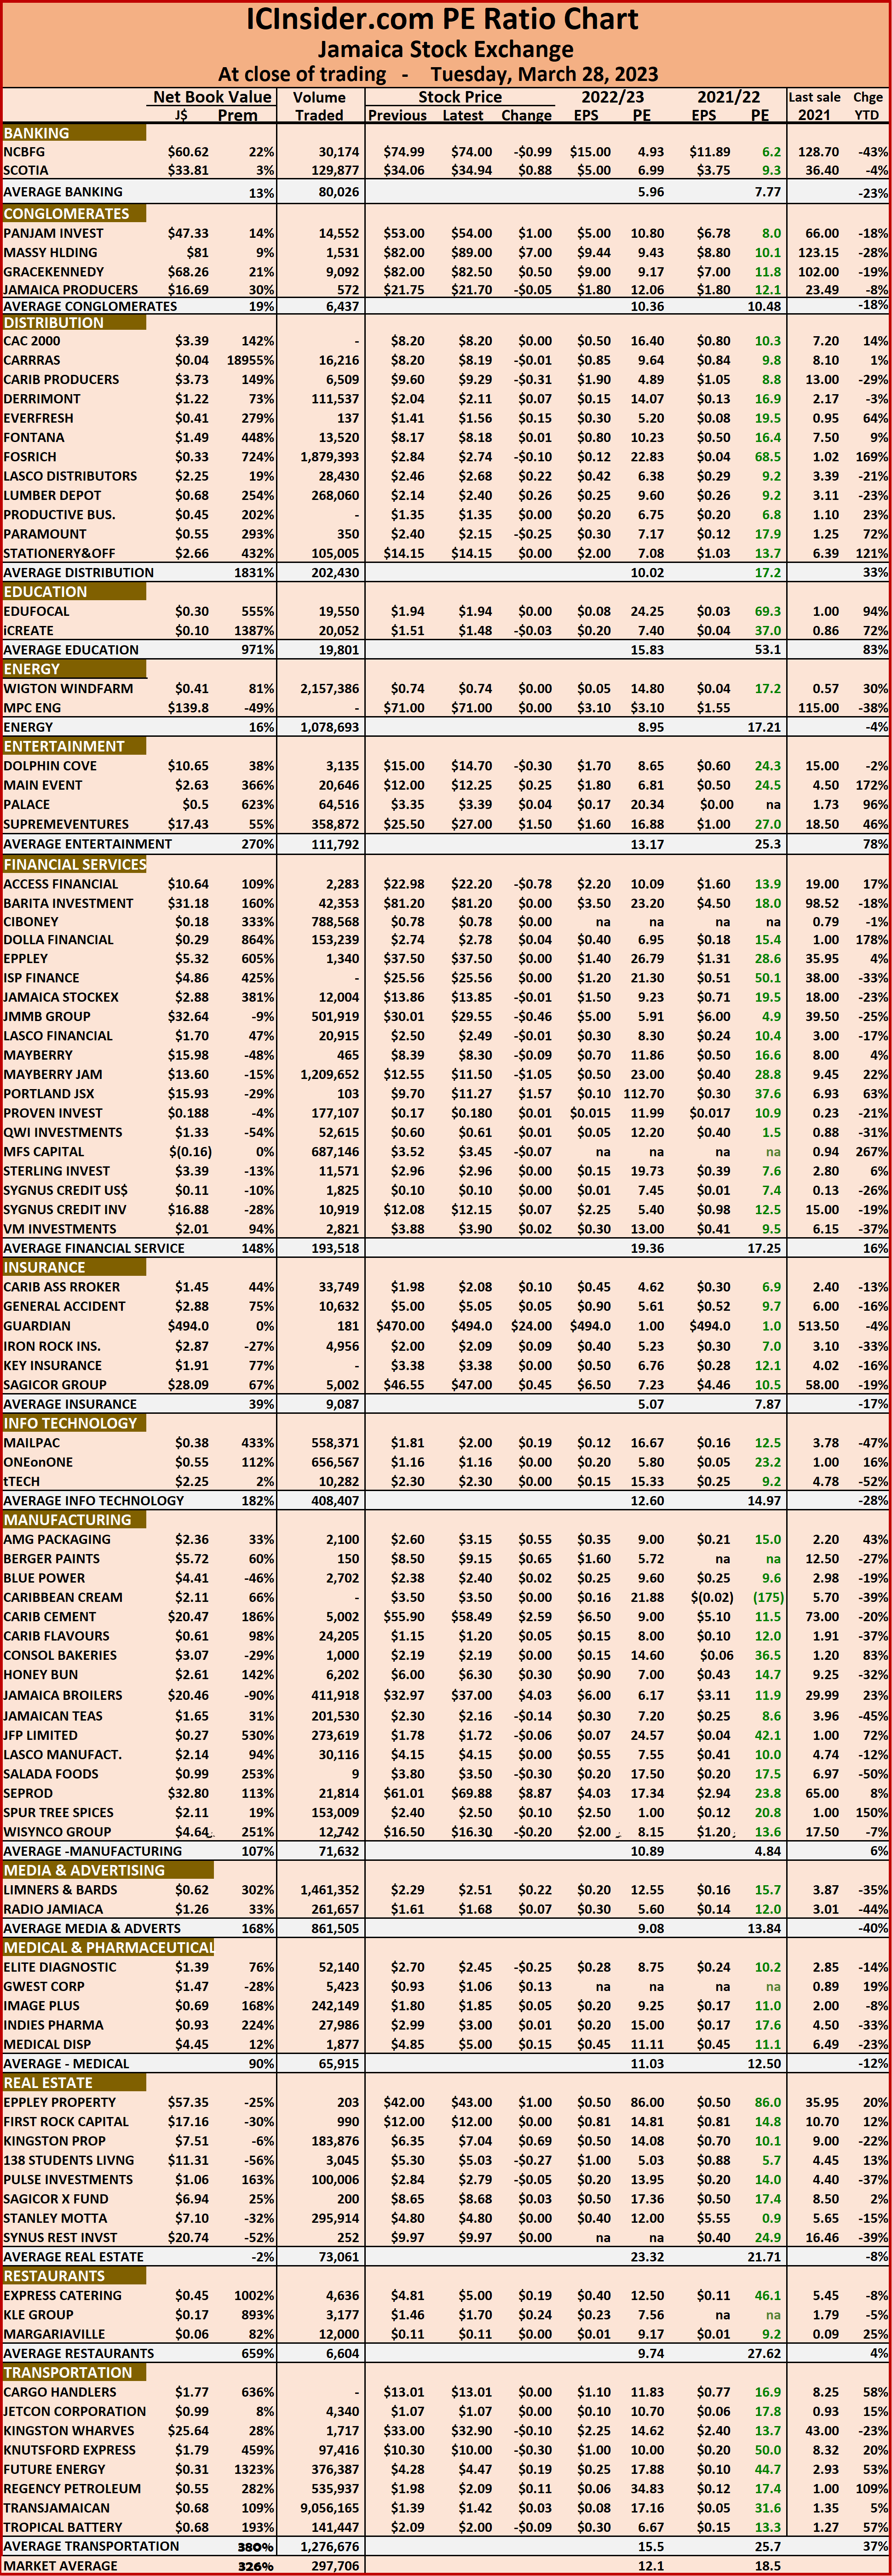
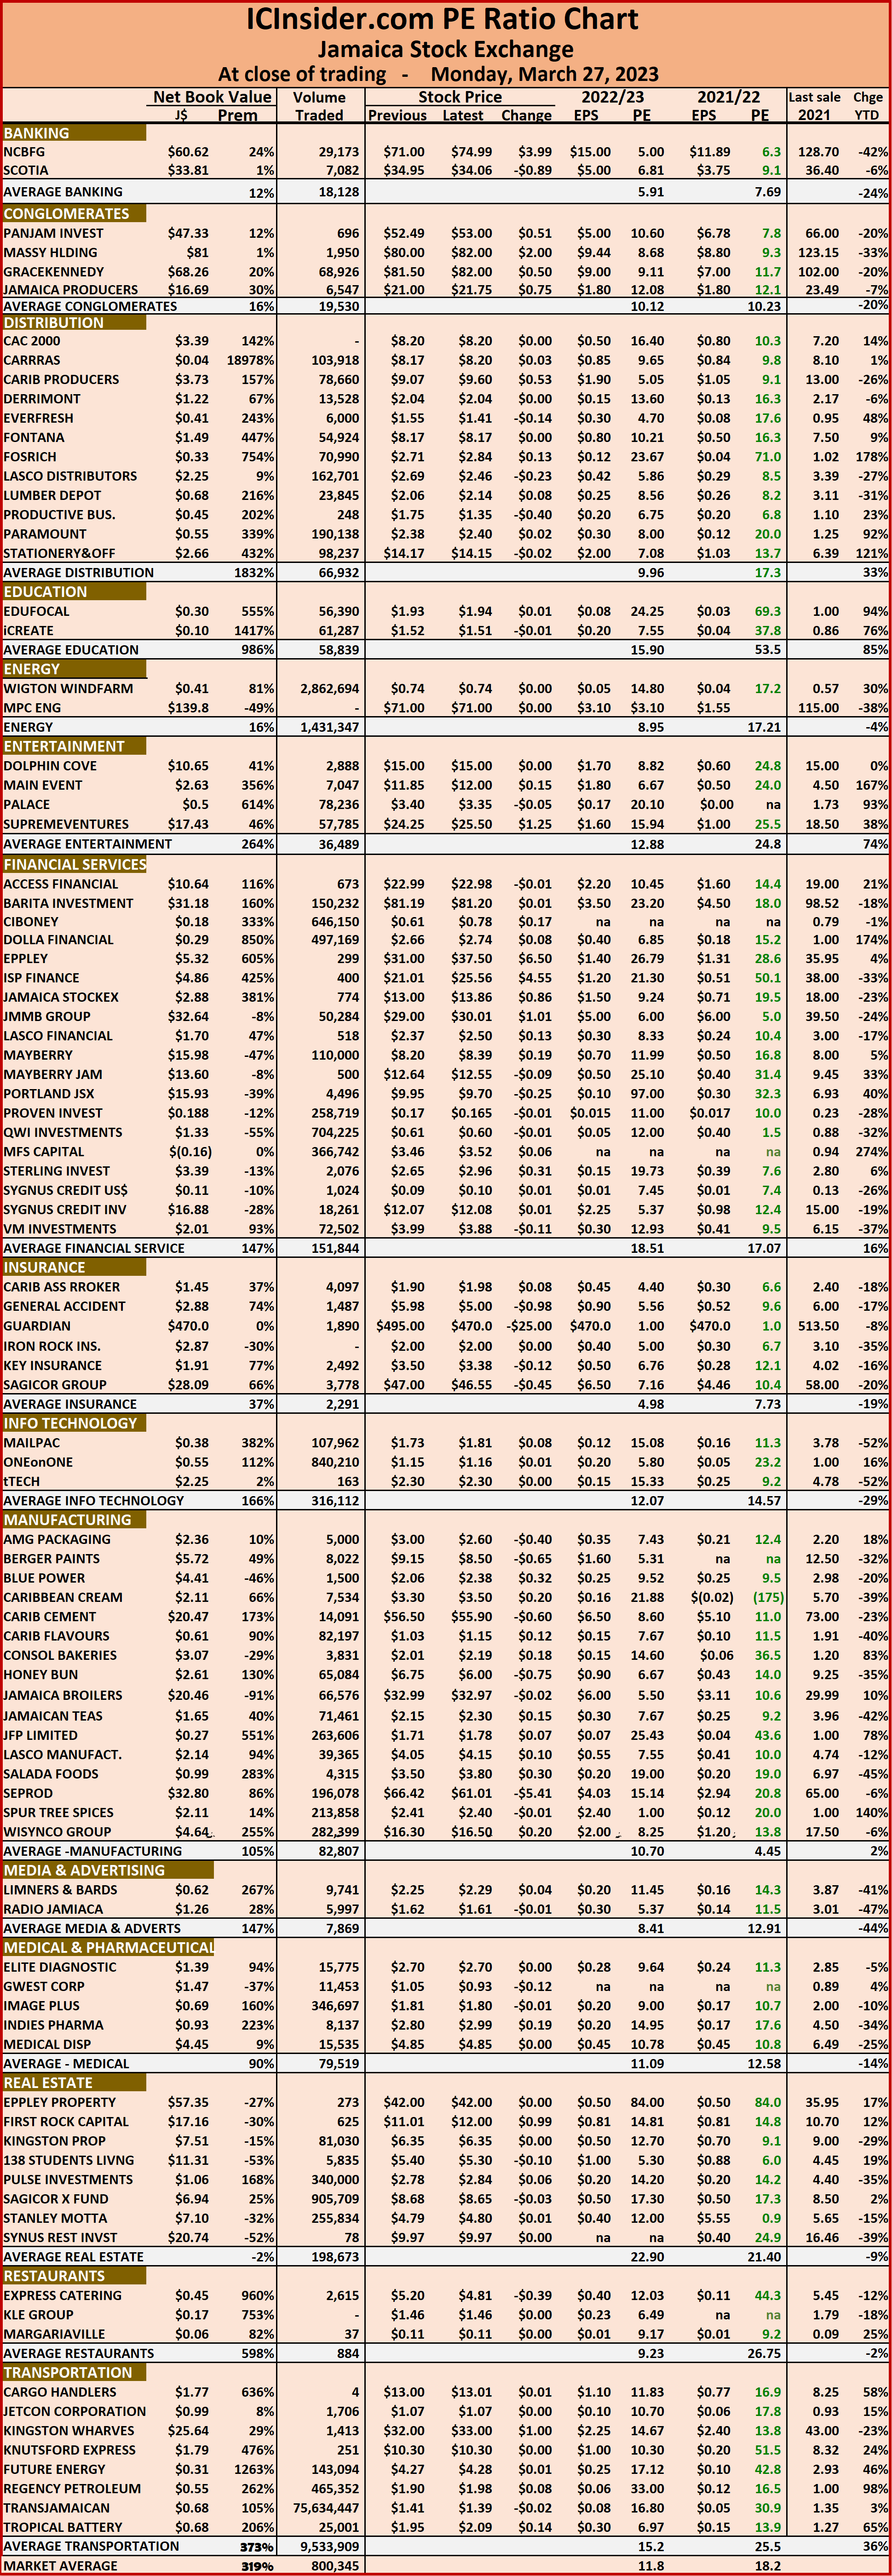
 The market’s PE ratio ended at 18.7 on 2021-22 earnings and 12.1 times those for 2022-23 at the close of trading.
Investors need pertinent information to successfully navigate numerous investment options in the local stock market. The ICInsider.com PE ratio chart and the more detailed daily report charts provide investors with regularly updated information to help decision-making.
Investors should use the chart to help make rational decisions when investing in stocks close to the average for the sector and not going too far from it unless there are compelling reasons to do so. This approach helps to remove emotions from investment decisions and put in on fundamentals while at the same time not being too far from the majority of investors. Investors who buy when the price of a stock is close to the average will find that they are not inclined to overpay for a stock.
The ICInsider.com PE Ratio chart covers all ordinary shares on the Jamaica Stock Exchange and shows companies grouped on an industry basis, allowing easy comparisons between the same sector companies and the overall market.
The net asset value of each company is reported as a guide to assess the value of stocks based on this measure quickly. The chart also shows daily changes in stock prices and the percentage year to date price movement based on the last traded prices.
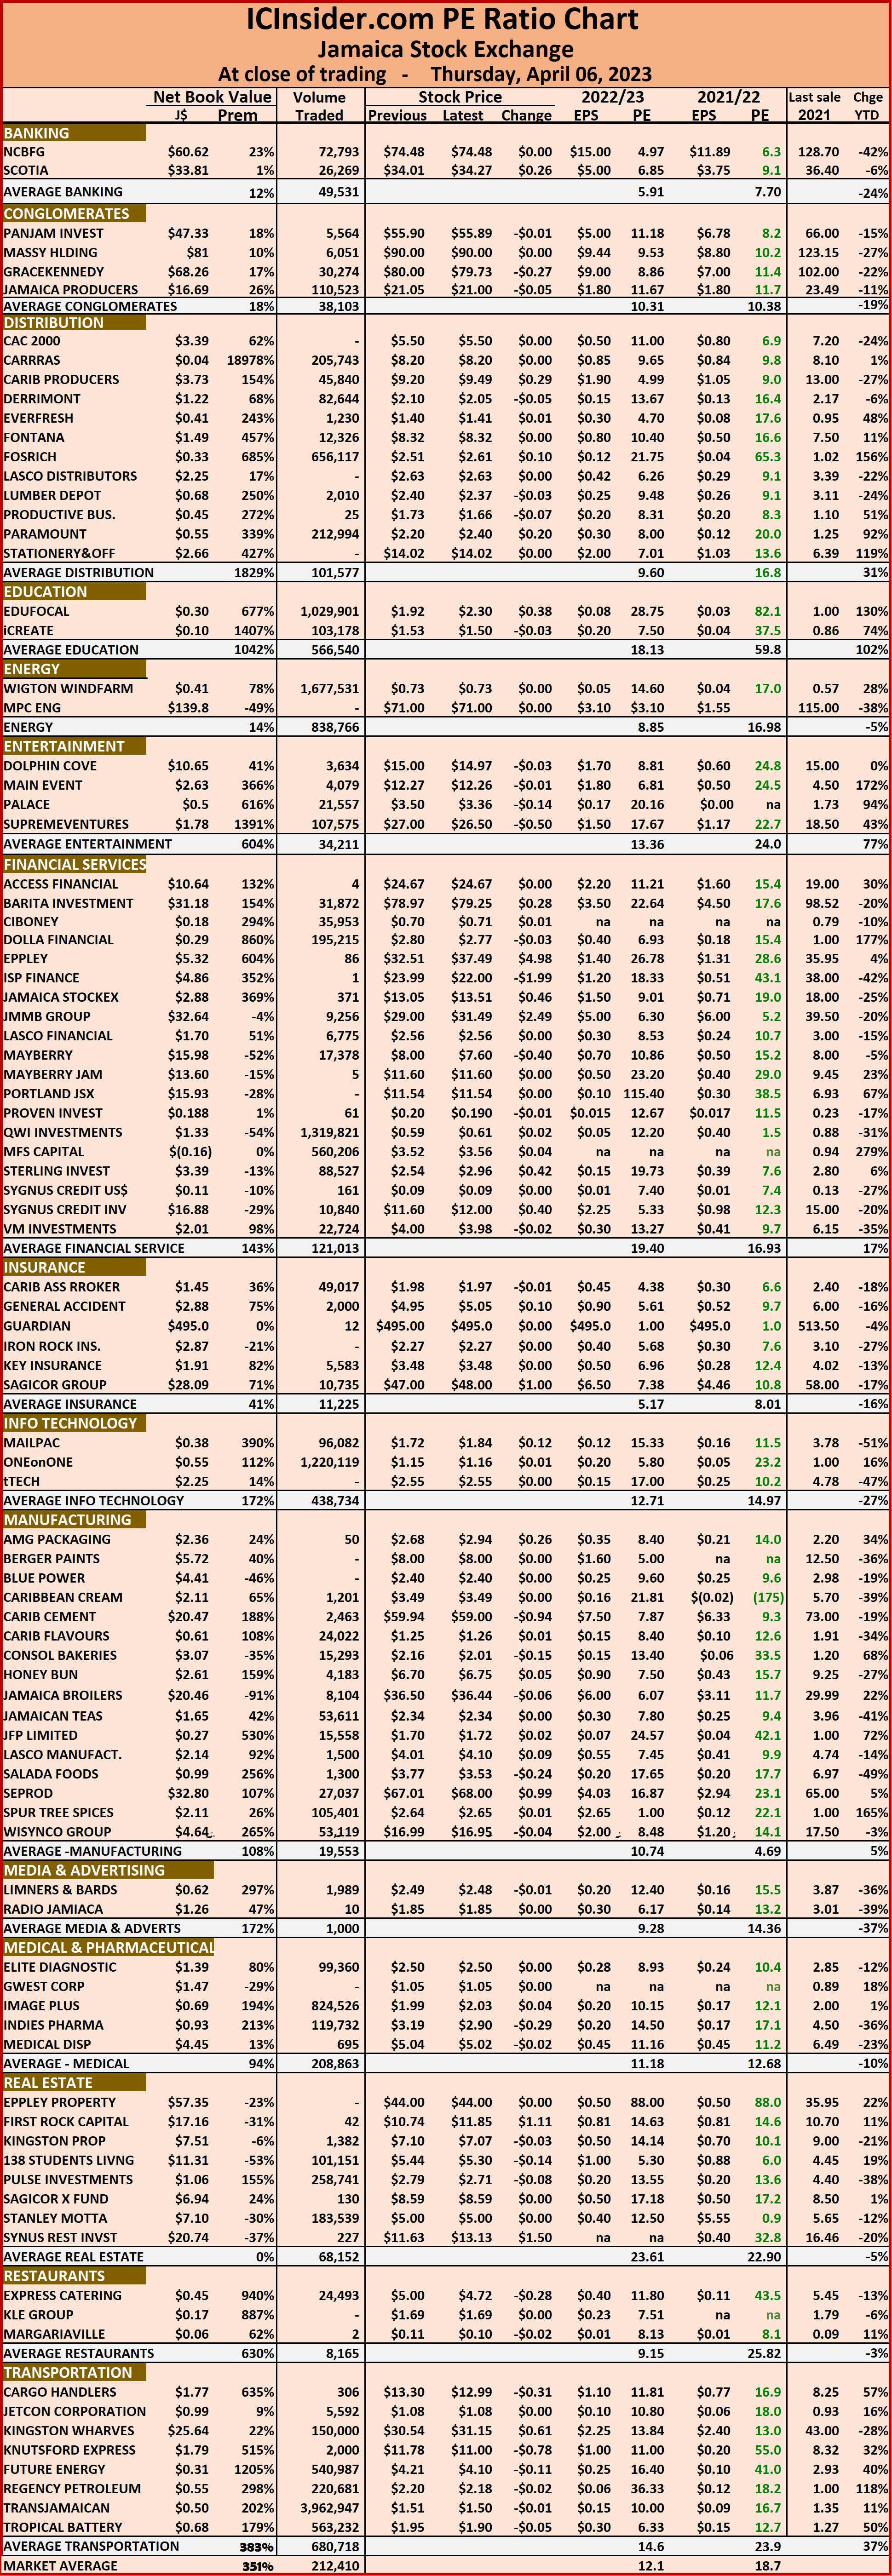 Dividends payable and yields for each company are shown in the Main and Junior Markets’ daily report charts that also show the closing volume pertaining to the bids and offers for each company.
The EPS & PE ratios are based on 2021 and 2022 actual or projected earnings, excluding major one off items. The PE Ratio is the most popular measure used to determine the value of stocks.
Access Financial dominates JSE USD trading
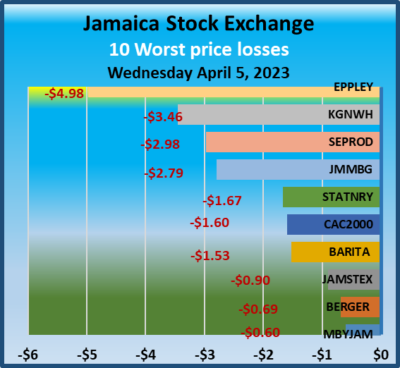
Access Financial accounted for 67,861,430 shares at $1,676,177,320 at the close of the trading on the Junior Market as Proven Investments shift ownership within the group for nearly 68 million it owns as the trade dominated market activity on Wednesday but the market index slipped marginally as was the case of the Main Market slipped modestly but the JSE USD market popped slightly higher at the close on Wednesday.
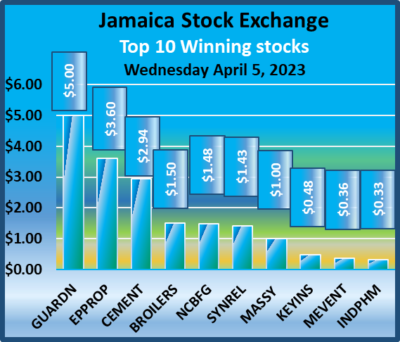 Trading ended with the JSE Combined Market Index dipping by 1,154.39 points to 341,927.86. The All Jamaican Composite Index dropped 2,088.91 points to 369,166.27, the JSE Main Index lost 1,159.46 points to end at 330,217.61, while the Junior Market slipped 8.01 points to close at 3,693.19 and the JSE USD Market Index rose 0.44 points to end at 210.34.
In the preference section of the Main Market that is not reflected in the TOP10 graphs, JPS 7 percent dropped $14 to $84.
At the close, investors exchanged 85,549,341 shares in all three markets, compared with 13,602,402 units on Monday, with the value of trading on Wednesday amounting to just $1.73 billion, down sharply from $36.96 million on the previous trading day. Trading on the JSE USD market resulted in investors exchanging shares for US$35,767 down from 303,705 units at US$18,904 on Tuesday.
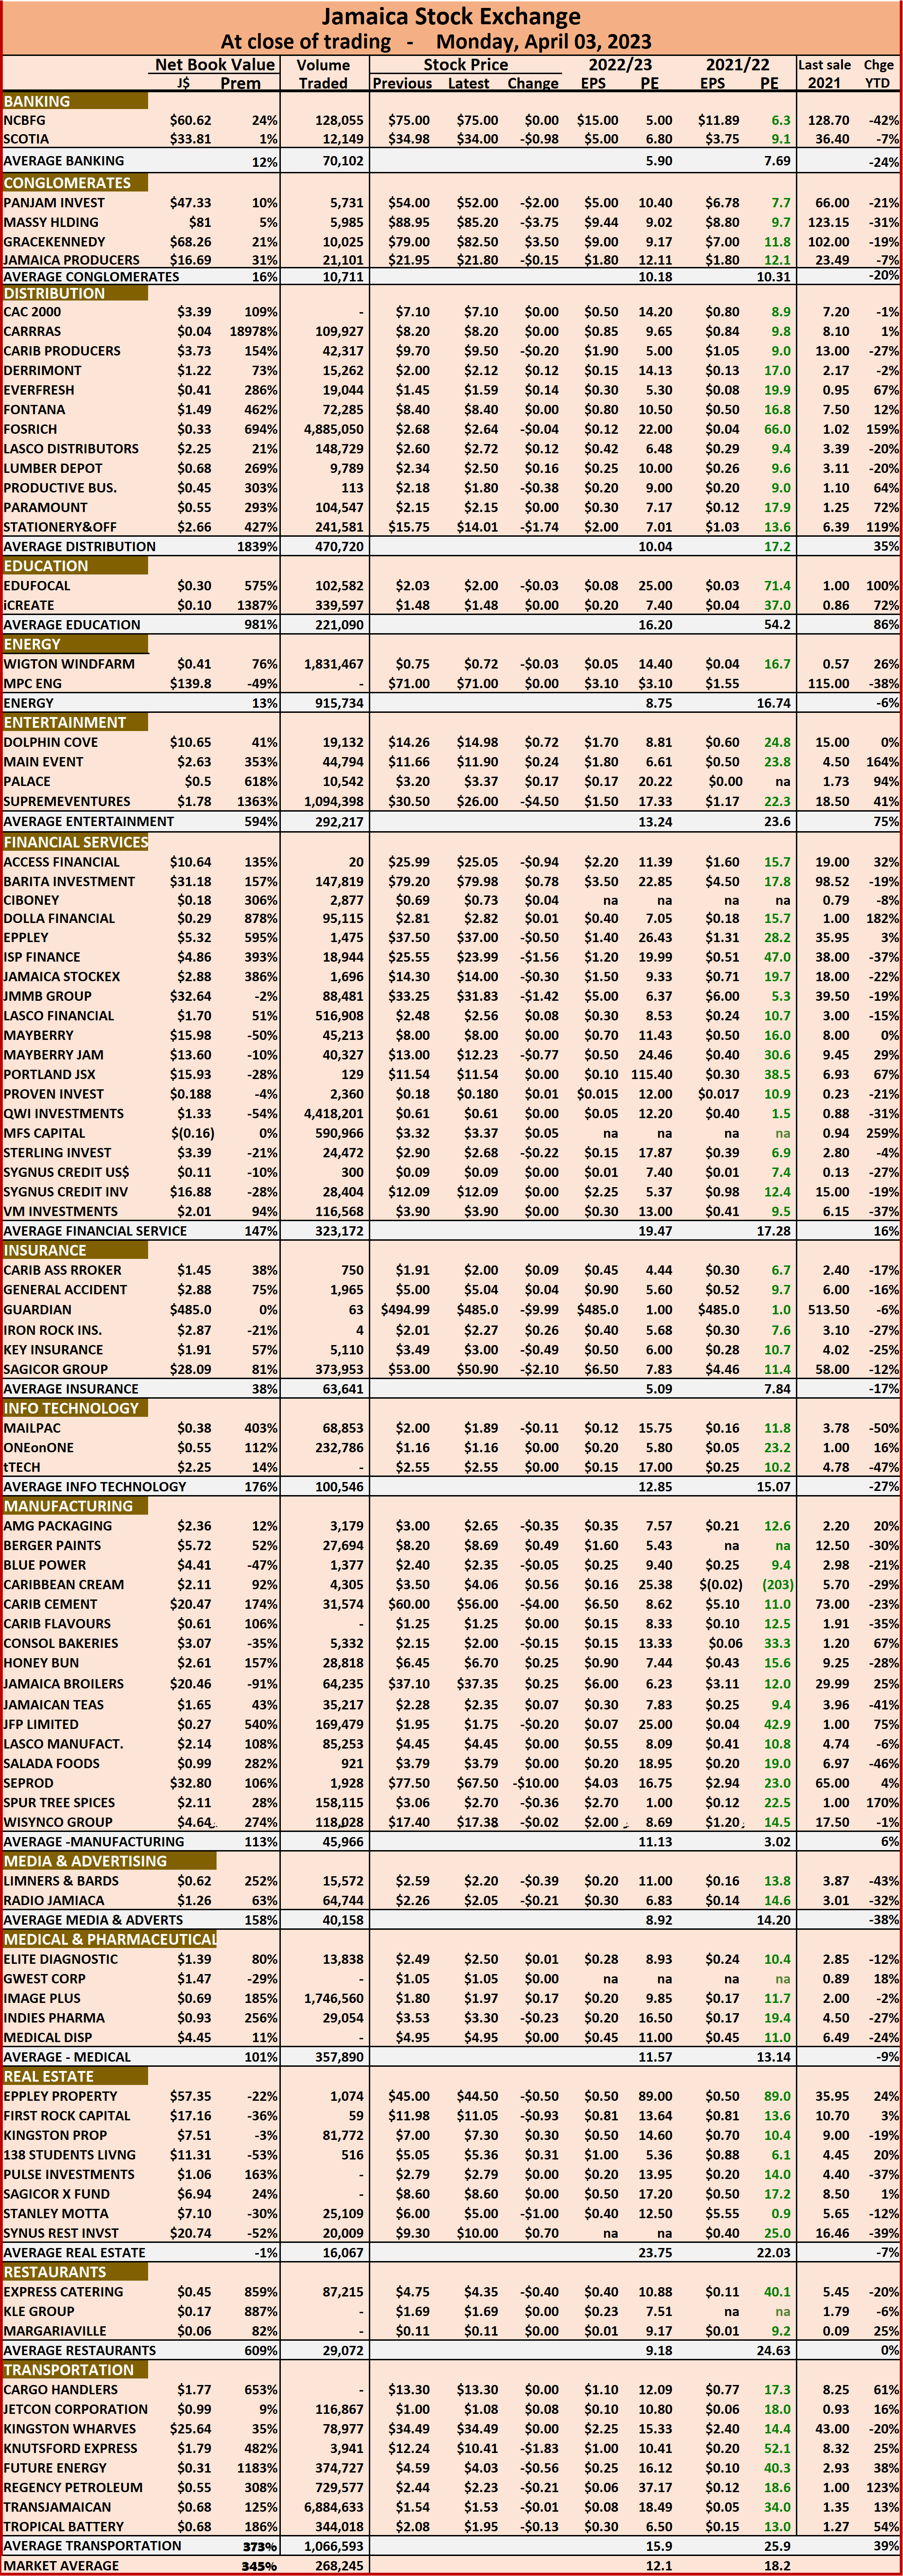
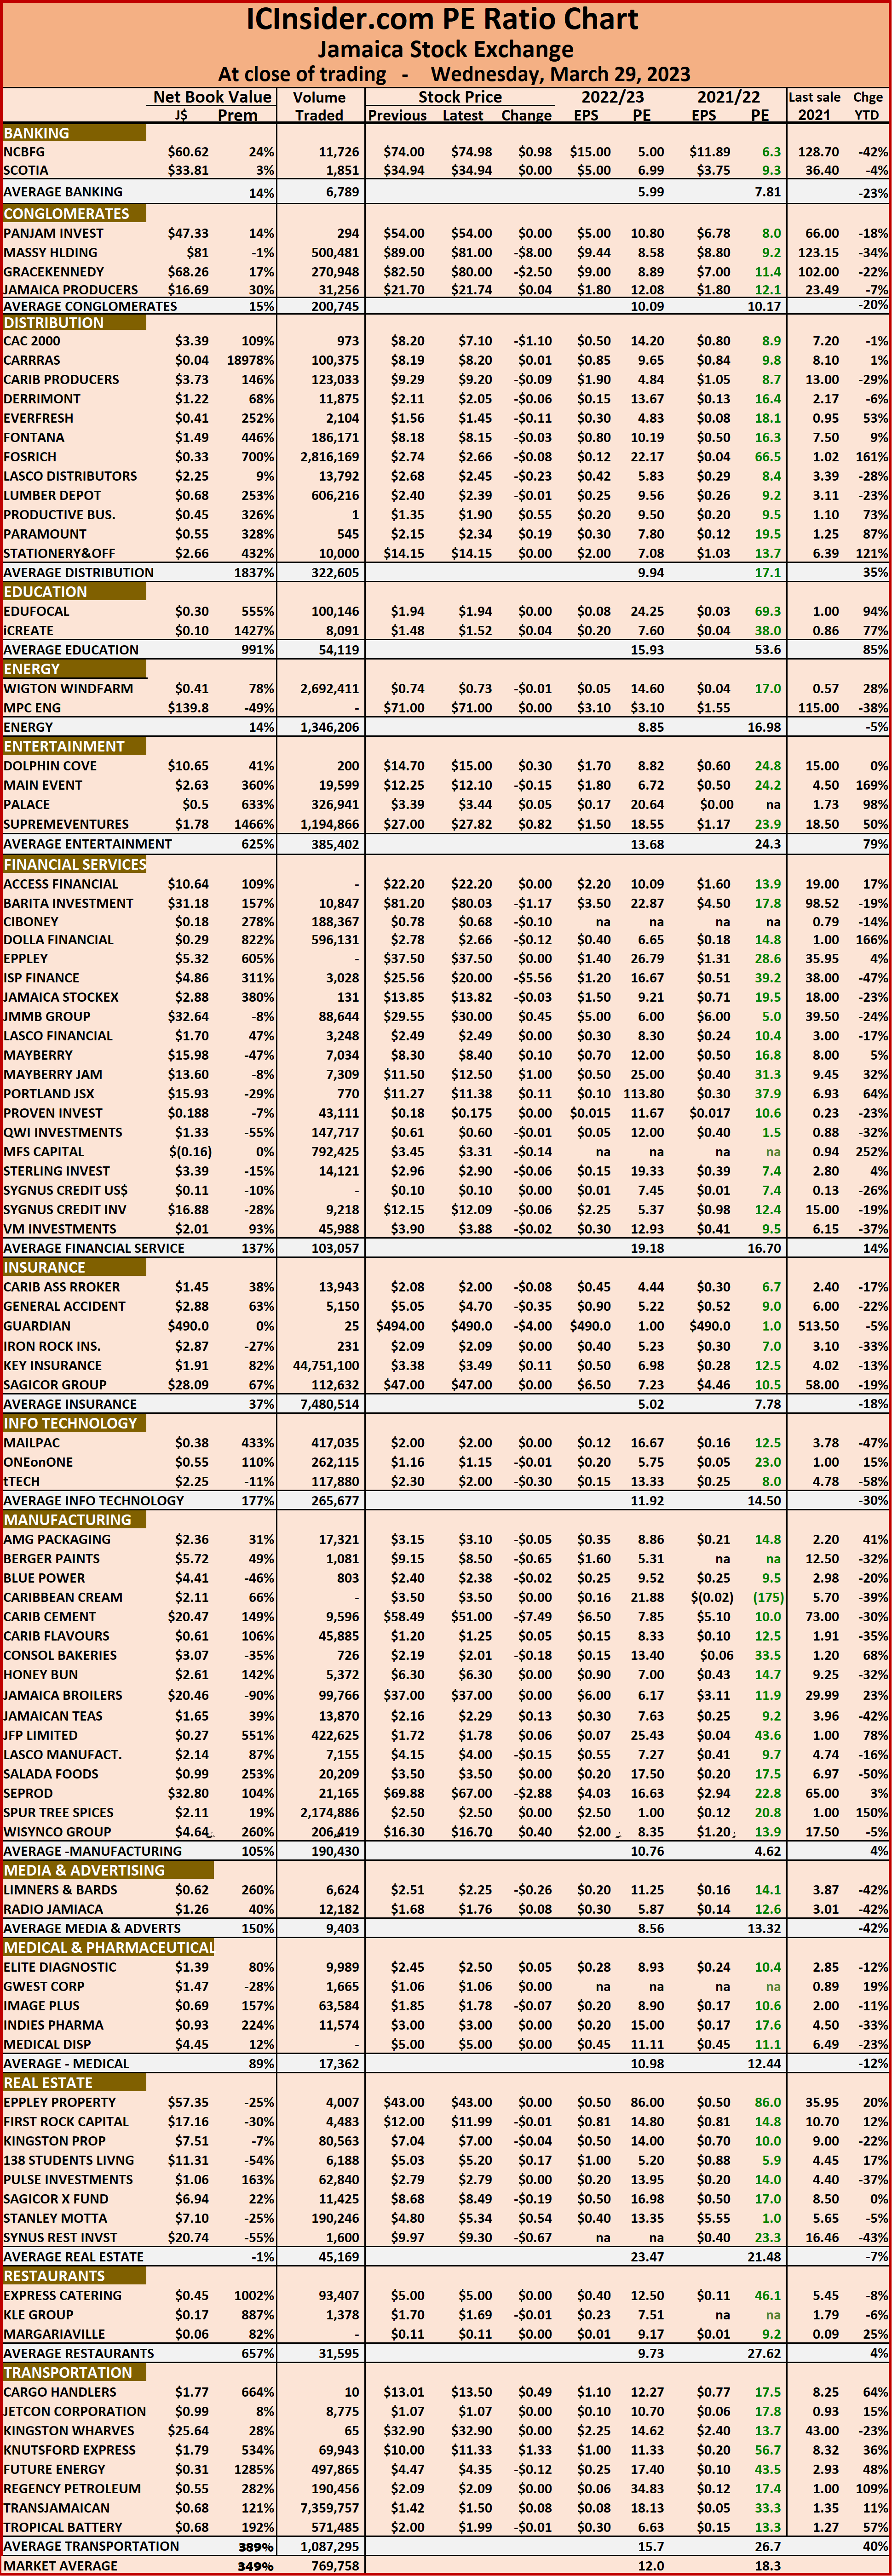
 The market’s PE ratio ended at 18.4 on 2021-22 earnings and 12 times those for 2022-23 at the close of trading.
Investors need pertinent information to successfully navigate numerous investment options in the local stock market. The ICInsider.com PE ratio chart and the more detailed daily report charts provide investors with regularly updated information to help decision-making.
Investors should use the chart to help make rational decisions when investing in stocks close to the average for the sector and not going too far from it unless there are compelling reasons to do so. This approach helps to remove emotions from investment decisions and put in on fundamentals while at the same time not being too far from the majority of investors. Investors who buy when the price of a stock is close to the average will find that they are not inclined to overpay for a stock.
The ICInsider.com PE Ratio chart covers all ordinary shares on the Jamaica Stock Exchange and shows companies grouped on an industry basis, allowing easy comparisons between the same sector companies and the overall market.
 The net asset value of each company is reported as a guide to assess the value of stocks based on this measure quickly. The chart also shows daily changes in stock prices and the percentage year to date price movement based on the last traded prices.
Dividends payable and yields for each company are shown in the Main and Junior Markets’ daily report charts that also show the closing volume pertaining to the bids and offers for each company.
The EPS & PE ratios are based on 2021 and 2022 actual or projected earnings, excluding major one off items. The PE Ratio is the most popular measure used to determine the value of stocks.
Junior Market rises JSE USD market plunged
The Junior Market recovered some of Monday’s loss and the Main Market slipped modestly but the JSE USD market dropped sharply at the close of Tuesday’s market activity after the volume and value of stocks trading on the market dropped sharply from that on Monday.
 Trading ended with the JSE Combined Market Index dropping a mere 40.64 points to 343,082.25, the All Jamaican Composite Index declining 494.93 points to end at 371,255.18, the JSE Main Index dipping 390.22 points to settle at 331,377.07, while the Junior Market gained 34.69, to close at 3,701.20 and the JSE USD Market Index slipped 19.77 points to end at 209.90.
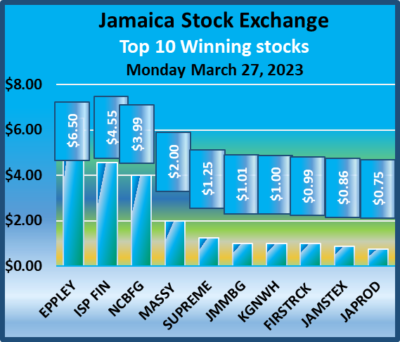
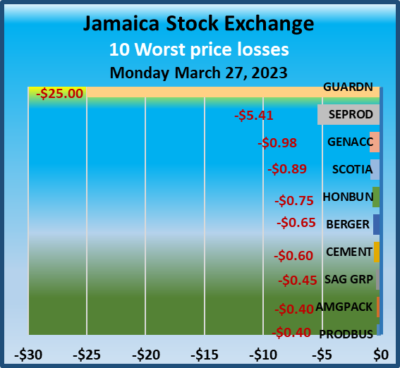
In the preference section of the Main Market that is not reflected in the TOP10 graphs, JPS 7 percent dropped $30.99 to $98 and PBS 9.75% jumped $16.05 to $107.
At the close, investors exchanged 13,602,402 shares in all three markets, compared with 30,620,034 units on Monday, with the value of trading on Monday amounting to just $36.96 million, down sharply from $137.2 million on the previous trading day. Trading on the JSE USD market resulted in investors exchanging 303,705 shares for US$18,904 down from 929,408 units at US$15,231 on Monday.
 The market’s PE ratio ended at 18.5 on 2021-22 earnings and 12.1 times those for 2022-23 at the close of trading.
Investors need pertinent information to successfully navigate numerous investment options in the local stock market. The ICInsider.com PE ratio chart and the more detailed daily report charts provide investors with regularly updated information to help decision-making.
Investors should use the chart to help make rational decisions when investing in stocks close to the average for the sector and not going too far from it unless there are compelling reasons to do so. This approach helps to remove emotions from investment decisions and put in on fundamentals while at the same time not being too far from the majority of investors. Investors who buy when the price of a stock is close to the average will find that they are not inclined to overpay for a stock.
The ICInsider.com PE Ratio chart covers all ordinary shares on the Jamaica Stock Exchange and shows companies grouped on an industry basis, allowing easy comparisons between the same sector companies and the overall market.
The net asset value of each company is reported as a guide to assess the value of stocks based on this measure quickly. The chart also shows daily changes in stock prices and the percentage year to date price movement based on the last traded prices.
 Dividends payable and yields for each company are shown in the Main and Junior Markets’ daily report charts that also show the closing volume pertaining to the bids and offers for each company.
The EPS & PE ratios are based on 2021 and 2022 actual or projected earnings, excluding major one off items. The PE Ratio is the most popular measure used to determine the value of stocks.
Huge dive in JSE Main & Junior Markets
Most of the gains on the last two trading days of last week were almost taken back in the Main and Junior Market after stocks fell across the exchange on Monday, leading to big declines in the indices, with the JSE Combined Market Index dropping sharply by 9,364.64 points to 343,122.89, the All Jamaican Composite Index nosediving 12,007.10 points to 371,750.11, the JSE Main Index plunging 8,768.59 points to end trading at 331,767.29, while the Junior Market dived more than Friday’s rise, with a drop of 128.70 points on Monday to 3,666.51 and the JSE USD Market Index slipped 2.23 points to end at 229.67.
In the preference section of the Main Market that is not reflected in the TOP10 graphs, JPS 7 percent dropped $35.11 to $128.99 and PBS 10.5% dropped $8 to $1,250.
At the close, investors exchanged 30,620,034 shares in all three markets, compared with 51,243,309 units on Friday, with the value of trading on Monday amounting to $137.2 million, down sharply from $650.5 million on the previous trading day. Trading on the JSE USD market resulted in investors exchanging 929,408 shares for US$15,231 down from 1,234,958 units at US$13,631 on Friday.
The market’s PE ratio ended at 1 .2 on 2021-22 earnings and 12.1 times those for 2022-23 at the close of trading.
 Investors need pertinent information to successfully navigate numerous investment options in the local stock market. The ICInsider.com PE ratio chart and the more detailed daily report charts provide investors with regularly updated information to help decision-making.
Investors should use the chart to help make rational decisions when investing in stocks close to the average for the sector and not going too far from it unless there are compelling reasons to do so. This approach helps to remove emotions from investment decisions and put in on fundamentals while at the same time not being too far from the majority of investors. Investors who buy when the price of a stock is close to the average will find that they are not inclined to overpay for a stock.
The ICInsider.com PE Ratio chart covers all ordinary shares on the Jamaica Stock Exchange and shows companies grouped on an industry basis, allowing easy comparisons between the same sector companies and the overall market.
The net asset value of each company is reported as a guide to assess the value of stocks based on this measure quickly. The chart also shows daily changes in stock prices and the percentage year to date price movement based on the last traded prices.
 Dividends payable and yields for each company are shown in the Main and Junior Markets’ daily report charts that also show the closing volume pertaining to the bids and offers for each company.
The EPS & PE ratios are based on 2021 and 2022 actual or projected earnings, excluding major one off items. The PE Ratio is the most popular measure used to determine the value of stocks.
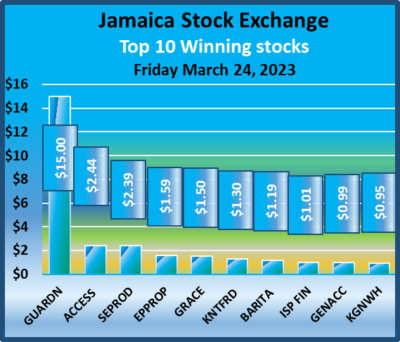
Big blast off for JSE Main & Junior Market
Investors pushed the Main and Junior Market into sharp gains to close out the first quarter of 2023 as the JSE USD market inched just higher at the close on Jamaica Stock Exchange on Friday, with big gains in the volume and value of stocks traded.
 In the preference section of the Main Market that is not reflected in the TOP10 graphs, JPS 7 percent dropped $55.90 to $263.39 and JPS 9.5 percent jumped $98 to $2,998 and PBS 10.5% jumping $58 to $1,258.
At the close, investors exchanged 51,243,309 shares in all three markets, compared with 45,525,550 units on Thursday, with the value of trading on Friday amounting to $650.5 million, up sharply from $183.2 million on the previous trading day. Trading on the JSE USD market resulted in investors exchanging 1,234,958 shares for US$13,631 down from 1,608,959 units at US$20,097 on Thursday.
The JSE Combined Market Index jumped sharply by 5,958.64 points to 352,487.53, the All Jamaican Composite Index surges 6,292.04 points to end at 383,757.21, the JSE Main Index jumped 5,465.11 points to end at 340,535.88, the Junior Market surged 93.32 points to 3,795.21 and the JSE USD Market Index rose 0.26 points to close at 231.90.
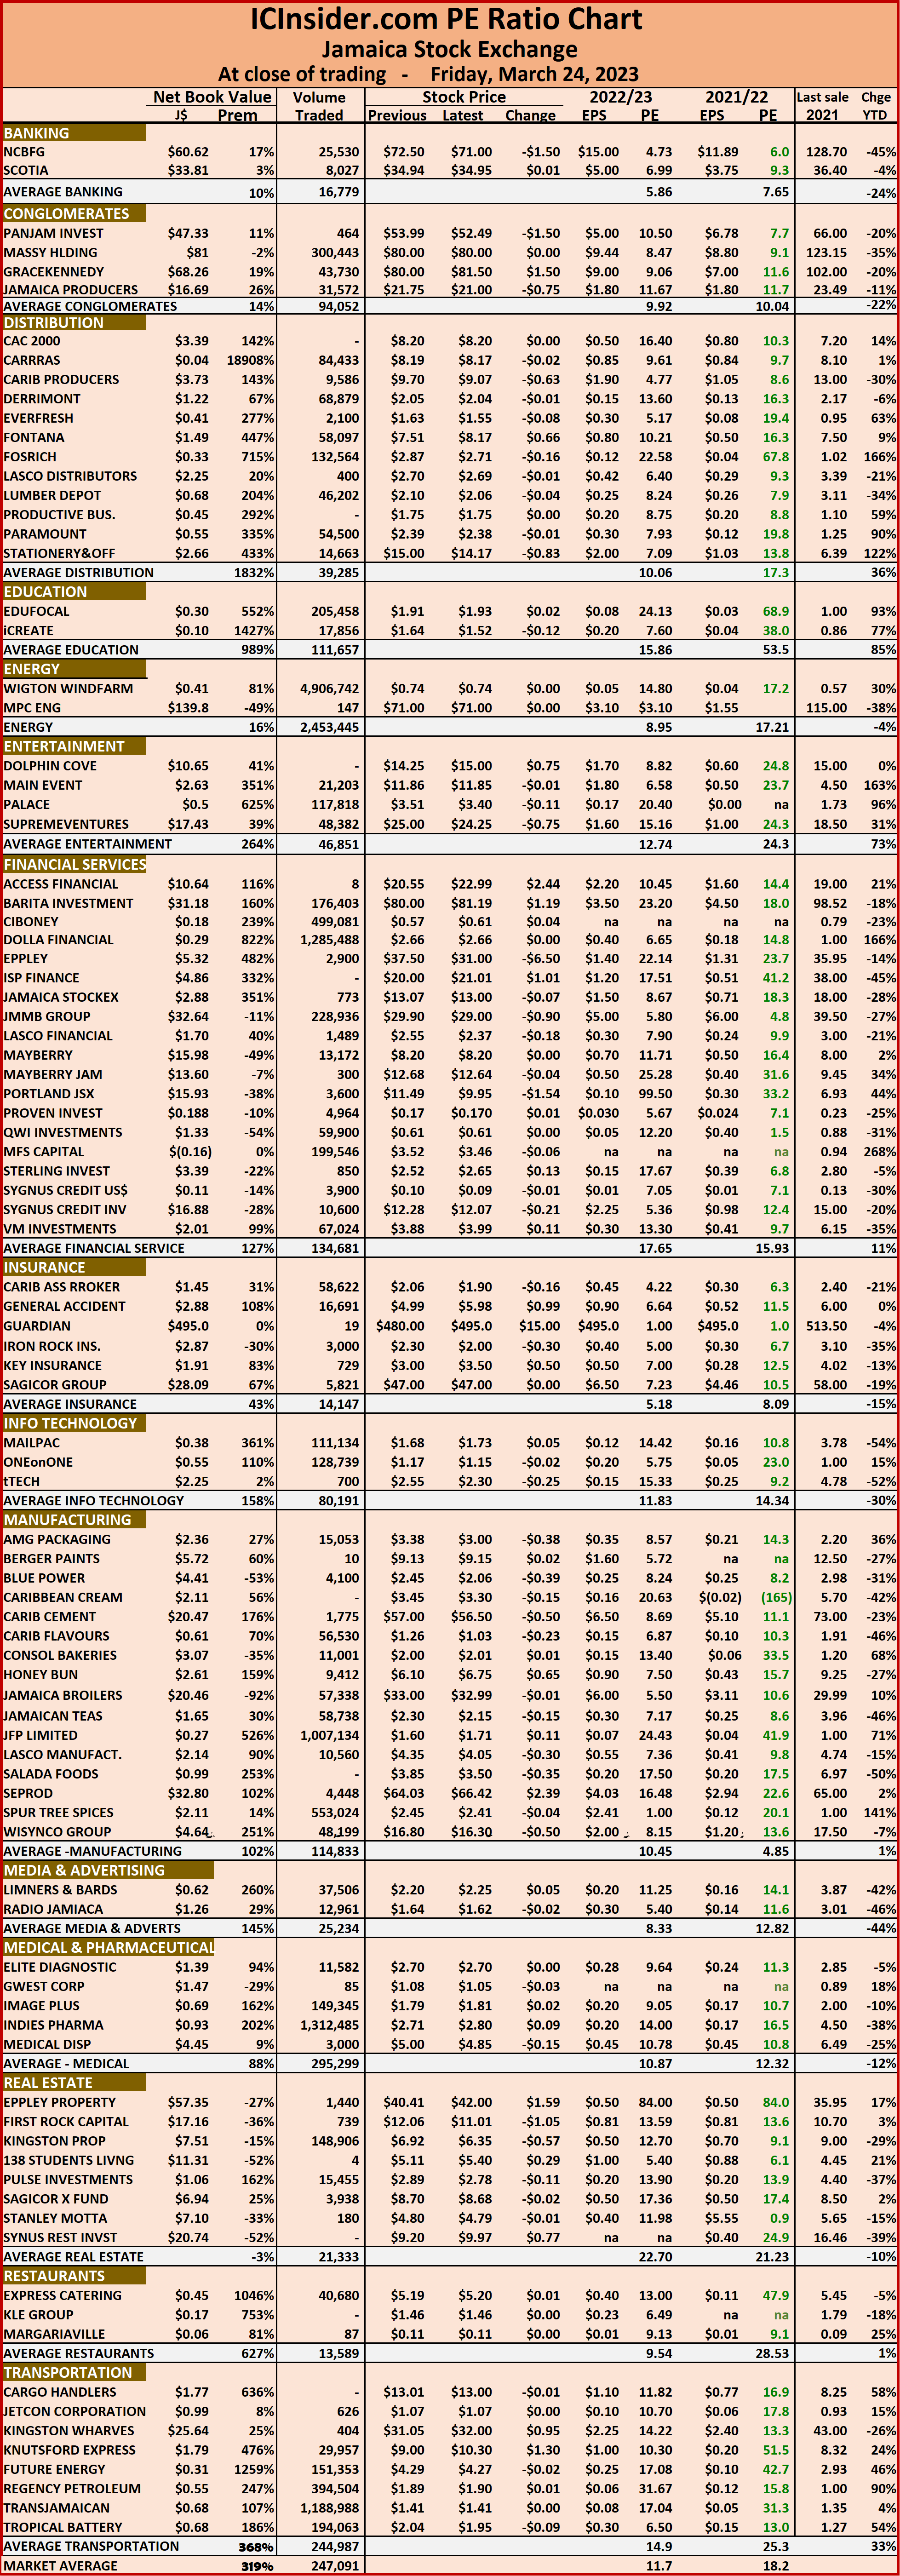
 The market’s PE ratio ended at 19 based on 2021-22 earnings and 12.5 times those for 2022-23 at the close of trading.
Investors need pertinent information to successfully navigate numerous investment options in the local stock market. The ICInsider.com PE ratio chart and the more detailed daily report charts provide investors with regularly updated information to help decision-making.
Investors should use the chart to help make rational decisions when investing in stocks close to the average for the sector and not going too far from it unless there are compelling reasons to do so. This approach helps to remove emotions from investment decisions and put in on fundamentals while at the same time not being too far from the majority of investors. Investors who buy when the price of a stock is close to the average will find that they are not inclined to overpay for a stock.
The ICInsider.com PE Ratio chart covers all ordinary shares on the Jamaica Stock Exchange and shows companies grouped on an industry basis, allowing easy comparisons between the same sector companies and the overall market.
The net asset value of each company is reported as a guide to assess the value of stocks based on this measure quickly. The chart also shows daily changes in stock prices and the percentage year to date price movement based on the last traded prices.
 Dividends payable and yields for each company are shown in the Main and Junior Markets’ daily report charts that also show the closing volume pertaining to the bids and offers for each company.
The EPS & PE ratios are based on 2021 and 2022 actual or projected earnings, excluding major one off items. The PE Ratio is the most popular measure used to determine the value of stocks.
JSE Main Market surges over 8,300 points
The Main Market surged more than 8,300 points on Jamaica Stock Exchange on Thursday, while the Junior and JSE USD inched higher at the close, with both volume and value lower than on Wednesday.
 In the preference section of the market that is not reflected in the TOP10 graphs, JPS 7 percent dropped $43.39 to $220 and JPS 9.5 percent dived $98 to $2,900 and PBS 19.75% fell $16.05 to $90.95.
At the close, investors exchanged 45,525,550 shares in all three markets, compared with 71,333,661 units on Wednesday, with the value of trading on Thursday amounting to $183.2 million, down from $318.78 million on the previous trading day. Trading on the JSE USD market resulted in investors trading 1,608,959 shares for US$20,097 compared to 1,034,991 units at US$21,566 on Wednesday.
The JSE Combined Market Index jumped sharply by 7,994.08 points to 346,528.89, the All Jamaican Composite Index surged 8,472.58 points to 377,465.17, the JSE Main Index gained 8,348.24 points to 335,070.77, the Junior Market climbed 23.51 points to close at 3,701.89 and the JSE USD Market Index rose 2.26 points to close at 231.64.
 The market’s PE ratio ended at 18.6 based on 2021-22 earnings and 12.2 times those for 2022-23 at the close of trading.
Investors need pertinent information to successfully navigate numerous investment options in the local stock market. The ICInsider.com PE ratio chart and the more detailed daily report charts provide investors with regularly updated information to help decision-making.
Investors should use the chart to help make rational decisions when investing in stocks close to the average for the sector and not going too far from it unless there are compelling reasons to do so. This approach helps to remove emotions from investment decisions and put in on fundamentals while at the same time not being too far from the majority of investors. Investors who buy when the price of a stock is close to the average will find that they are not inclined to overpay for a stock.
The ICInsider.com PE Ratio chart covers all ordinary shares on the Jamaica Stock Exchange and shows companies grouped on an industry basis, allowing easy comparisons between the same sector companies and the overall market.
The net asset value of each company is reported as a guide to assess the value of stocks based on this measure quickly. The chart also shows daily changes in stock prices and the percentage year to date price movement based on the last traded prices.
 Dividends payable and yields for each company are shown in the Main and Junior Markets’ daily report charts that also show the closing volume pertaining to the bids and offers for each company.
The EPS & PE ratios are based on 2021 and 2022 actual or projected earnings, excluding major one off items. The PE Ratio is the most popular measure used to determine the value of stocks.
Trading surges on Jamaica Stock Exchange
Trading surged on Jamaica Stock Exchange on Wednesday, with both volume and value jumping but sharply over that on Tuesday as the first quarter for the year, is only a few days away.
 Movements in the preference section of the market that is not reflected in the TOP10 graphs, JPS 7 percent dropped $41.61 to $263.39 and JPS 9.5 percent jumped $98 to $2,998.
At the close, investors exchanged 71,333,661 shares in all three markets, compared with 25,677,581 units on Tuesday, with the value of trading on Wednesday amounting to $318.78 million, up sharply from $109.6 million on the previous trading day. Trading on the JSE USD market resulted in investors exchanging 1,034,991 shares for US$21,566 compared to 339,743 units at US$36,245 on Tuesday.
The JSE Combined Market Index rose 760.40 points to 337,774.41, the All Jamaican Composite Index surged 3,756.40 points to 368,992.59, the JSE Main Index advanced 976.04 points to 326,722.53, the Junior Market shed 15.98 points to close at 3,678.38 and the JSE USD Market Index rose 1.13 points to close at 192.61.
The market’s PE ratio ended at 18.3 based on 2021-22 earnings and 12 times those for 2022-23 at the close of trading.
 Investors need pertinent information to successfully navigate numerous investment options in the local stock market. The ICInsider.com PE ratio chart and the more detailed daily report charts provide investors with regularly updated information to help decision-making.
Investors should use the chart to help make rational decisions when investing in stocks close to the average for the sector and not going too far from it unless there are compelling reasons to do so. This approach helps to remove emotions from investment decisions and put in on fundamentals while at the same time not being too far from the majority of investors. Investors who buy when the price of a stock is close to the average will find that they are not inclined to overpay for a stock.
The ICInsider.com PE Ratio chart covers all ordinary shares on the Jamaica Stock Exchange and shows companies grouped on an industry basis, allowing easy comparisons between the same sector companies and the overall market.
The net asset value of each company is reported as a guide to assess the value of stocks based on this measure quickly. The chart also shows daily changes in stock prices and the percentage year to date price movement based on the last traded prices.
 Dividends payable and yields for each company are shown in the Main and Junior Markets’ daily report charts that also show the closing volume pertaining to the bids and offers for each company.
The EPS & PE ratios are based on 2021 and 2022 actual or projected earnings, excluding major one off items. The PE Ratio is the most popular measure used to determine the value of stocks.
All Jamaican Stock Markets closed higher
Trading dropped back from Monday’s increased activity on Jamaica Stock Exchange on Tuesday but led to gains for all three markets following lower trading activity than on Monday.
 At the close, investors exchanged 25,677,581 shares in all three markets, compared with 87,702,748 units on Monday, with the value of trading on Tuesday amounting to $109.6 million, down from $173.1 million on the previous trading day. Trading on the JSE USD market resulted in investors exchanging 339,743 shares for US$36,245 compared to 620,736 units at US$61,293 on Monday.
The JSE Combined Market Index jumped 2,733.45 points to close at 337,774.41, the All Jamaican Composite Index popped 40.23 points to 365,236.19, the JSE Main Index rose 2,546.17 points to 325,746.49, the Junior Market gained 38.90 points to settle at 3,694.36 and the JSE USD Market Index rose 1.13 points to close at 192.61.
The market’s PE ratio ended at 18.5 based on 2021-22 earnings and 12.1 times those for 2022-23 at the close of trading.
Investors need pertinent information to successfully navigate numerous investment options in the local stock market.  The ICInsider.com PE ratio chart and the more detailed daily report charts provide investors with regularly updated information to help decision-making.
Investors should use the chart to help make rational decisions when investing in stocks close to the average for the sector and not going too far from it unless there are compelling reasons to do so. This approach helps to remove emotions from investment decisions and put in on fundamentals while at the same time not being too far from the majority of investors. Investors who buy when the price of a stock is close to the average will find that they are not inclined to overpay for a stock.
The ICInsider.com PE Ratio chart covers all ordinary shares on the Jamaica Stock Exchange and shows companies grouped on an industry basis, allowing easy comparisons between the same sector companies and the overall market.
The net asset value of each company is reported as a guide to assess the value of stocks based on this measure quickly. The chart also shows daily changes in stock prices and the percentage year to date price movement based on the last traded prices.
 Dividends payable and yields for each company are shown in the Main and Junior Markets’ daily report charts that also show the closing volume pertaining to the bids and offers for each company.
The EPS & PE ratios are based on 2021 and 2022 actual or projected earnings, excluding major one off items. The PE Ratio is the most popular measure used to determine the value of stocks.
Junior & Main Markets closed higher
Trading picked up on Jamaica Stock Exchange on Monday, with the Junior Market opening trading at just over 3,717 points for an 87 points early jump higher than Friday’s close but ended lower at the close, with a smaller gain while the Jamaica Stock Exchange Main Market rallied higher at the close, but the USD market dropped sharply lower by the close of trading.
 The market closed with the volume and value of stocks traded jumping sharply higher compared with trading on Friday.
TransJamaica Highway dominated trading with 75.6 million shares with an exchange of a total of 87,702,748 shares in all three markets, compared with 16,410,081 units on Friday, with trading on Monday amounting to $173.1 million, in contrast to $82.4 million on the previous trading day. Trading on the JSE USD market resulted in an exchange of 620,736 shares for US$61,293 compared with 273,362 units at US$7,044 on Friday.
The JSE Combined Market Index popped 968.55 points to 335,040.96, the All Jamaican Composite Index climbed 2,102.98 points to 365,195.96, the JSE Main Index climbed 780.03 points to 323,200.32, the Junior Market gained 26.01 points to settle at 3,655.46 and the JSE USD Market Index fell 1.66 points to close at 191.48.
The market’s PE ratio ended at 18.2 based on 2021-22 earnings and 11.8 times those for 2022-23 at the close of trading.
 Investors need pertinent information to successfully navigate numerous investment options in the local stock market. The ICInsider.com PE ratio chart and the more detailed daily report charts provide investors with regularly updated information to help decision-making.
Investors should use the chart to help make rational decisions when investing in stocks close to the average for the sector and not going too far from it unless there are compelling reasons to do so. This approach helps to remove emotions from investment decisions and put in on fundamentals while at the same time not being too far from the majority of investors. Investors who buy when the price of a stock is close to the average will find that they are not inclined to overpay for a stock.
The ICInsider.com PE Ratio chart covers all ordinary shares on the Jamaica Stock Exchange. It shows companies grouped on an industry basis, allowing easy comparisons between the same sector companies and the overall market.
The net asset value of each company is reported as a guide to assess the value of stocks based on this measure quickly. The chart also shows daily changes in stock prices and the percentage year to date price movement based on the last traded prices.
 Dividends payable and yields for each company are shown in the Main and Junior Markets’ daily report charts that also show the closing volume pertaining to the bids and offers for each company.
The EPS & PE ratios are based on 2021 and 2022 actual or projected earnings, excluding major one off items. The PE Ratio is the most popular measure used to determine the value of stocks.
More declines for Jamaican stock markets
The Jamaica Stock Exchange Main and Junior Markets rose at the close of trading on Friday, but the USD market slipped lower with the volume and value of stocks traded falling compared with trading on Thursday.
 At the close of trading, JPS 7% preference shares jumped $50 to an unrealistic record high of $$00 after investors exchanged 1,295 shares, with an exchange of 16,410,081 shares in all three markets, compared with 43,111,953 units, with a value of $82.4 million, in contrast to $101.4 million on the previous trading day. JSE USD market closed with investors trading 273,362 shares for US$7,044 compared to just 21,983,490 units at US$1.63 million on Thursday.
The JSE Combined Market Index climbed 1,499.50 points to close at 334,072.41, the All Jamaican Composite Index rose 861.71 points to 363,092.98, the JSE Main Index rallied 1,262.43 points to 322,420.29, the Junior Market gained 34.78 to end at 3,629.45 and the JSE USD Market Index fell 1.66 points to close at 215.70.
The market’s PE ratio ended at 18.2 based on 2021-22 earnings and 11.7 times those for 2022-23 at the close of trading.
Investors need pertinent information to successfully navigate many investment options in the local stock market. 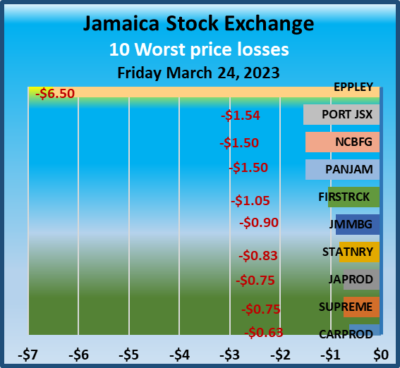 The ICInsider.com PE ratio chart and the more detailed daily report charts provide investors with regularly updated information to help decision-making.
Investors should use the chart to help make rational decisions when investing in stocks close to the average for the sector and not going too far from it unless there are compelling reasons to do so. This approach helps to remove emotions from investment decisions and put in on fundamentals while at the same time not being too far from the majority of investors. Investors who buy when the price of a stock is close to the average will find that they are not inclined to overpay for a stock.
The ICInsider.com PE Ratio chart covers all ordinary shares on the Jamaica Stock Exchange. It shows companies grouped on an industry basis, allowing easy comparisons between the same sector companies and the overall market.
 The net asset value of each company is reported as a guide to assess the value of stocks based on this measure quickly. The chart also shows daily changes in stock prices and the percentage year to date price movement based on the last traded prices.
Dividends payable and yields for each company are shown in the Main and Junior Markets’ daily report charts that also show the closing volume pertaining to the bids and offers for each company.
The EPS & PE ratios are based on 2021 and 2022 actual or projected earnings, excluding major one off items. The PE Ratio is the most popular measure used to determine the value of stocks.


