Trading closed on Monday on the Jamaica Stock Exchange after a fall in the volume of stocks traded, with a greater value than on Friday. Trading resulted in declines in the major indices of the Main Market, the Junior Market and the JSE USD Market. At the end of trading, the prices of 41 shares rose, 57 fell and 17 remained firm.
 At the close of the market, the JSE Combined Market Index fell 974.90 points to finish at 377,998.89, the All Jamaican Composite Index lost 866.39 points to 444,683.49, the JSE Main Index shed 727.69 points to finish at 373,284.61, the Junior Market Index slipped 38.89 points to 2,937.81 and the JSE USD Market Index shed 12.51 points to end at 286.07.
At the close of the market, 42,765,003 shares were traded in all three markets, down from 66,141,744 units on Friday, with the value of stocks traded on the Junior and Main markets amounting to $423.87 million, up from $361.12 million on the previous day. Trading on the JSE USD market closed with an exchange of 5,256,613 shares for US$348,331 compared to 1,282,333 units at US$85,862 on Friday.
In Main Market activity, Kingston Wharves led trading with 9.95 million shares, followed by Transjamaican Highway with 6.54 million stocks and Wigton Energy with 1.90 million units.
In Junior Market trading, Elite Diagnostic led with 8.42 million shares, followed by EduFocal with 846,703 stocks and Derrimon Trading with 766,266 units.
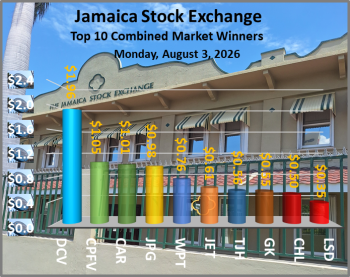
In Main Market ordinary share movements, among the top winners, Eppley Caribbean Property Fund popped $1.05 to finish at $43.99, Carreras rallied $1.01 and ended at $36.50, Jamaica Producers rose 98 cents to $21.98, West Indies Petroleum gained 76 cents in closing at $9.90 and Transjamaican Highway climbed 56 cents to close at $10.95. Among the top losers, Guardian Holdings lost $5 to end at $365.00, AS Bryden dropped $2 to close at $25.00, Seprod fell $1 to $74.00, Pan Jamaica skidded 95 cents and ended at $45.00 and General Accident declined 75 cents to end at $8.25. 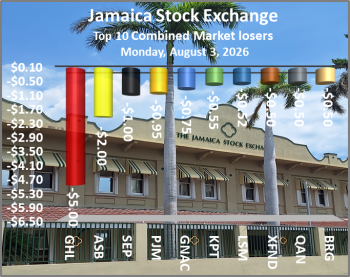 In the preference segment, Eppley 7.75% preference share shed $3.04 in closing at $17, Jamaica Public Service 7% dropped $1.05 to $38, Jamaica Public Service 9.5% fell $40 to end at $2,200, Productive Business Solutions 10.5% dived $51 to end at $1,187 and Sygnus Credit Investments 10% dropped by $13.50 to finish at $100.
In the Junior Market, among the winners, Dolphin Cove advanced $1.96 in closing at $12.17, Jetcon Corporation gained 61 cents to end at $4.04, Cargo Handlers gained 50 cents to close at $17.50, GWest Corporation climbed 9 cents to end at 68 cents and Image Plus gained 8 cents to $1.20. Among the top losers, Knutsford Express shed 37 cents to finish at $7.10, Consolidated Bakeries dropped 25 cents to $1.20, Derrimon Trading lost 19 cents in closing at $1.01, Limners and Bards skidded 19 cents and ended at $1.00 and Jamaican Teas dipped 18 cents to close at $2.05.
At the close of trading, the PE ratio for the current year, compiled from projected 2026-27 earnings, is 12.9 and 15.3 based on 2025 historical earnings. Major one-off income or expenses are excluded from earnings where applicable. The PE ratio is one of the most commonly used measures in valuing shares. It is calculated by dividing the stock price by earnings per share. The ICInsider.com PE ratio chart and the daily charts provide investors with regularly updated information to assist in making investment decisions.

The PE ratio chart includes all ordinary shares listed on the Jamaica Stock Exchange, grouped by industry and facilitates easy comparisons within sectors and the overall market.
Pertinent information is needed to navigate the numerous options in the stock market. The chart should be used to help in decision-making, especially when investing close to the market or sector averages, and not going too far from it unless compelling reasons exist. This approach reduces emotional bias in investment decisions and places them on fundamentals, without straying far from the majority of investors. Investors who buy stocks near the average will not overpay. The net asset value of each company is incorporated into the chart. Investors can use this measure in assessing stock values. The chart also includes daily changes in stock prices and percentage year to date price movements based on the last traded price. Dividends that are paid or due to be paid and yields for each company are shown in the Main and Junior Markets’ daily report charts, along with the closing volume of the highest bid and the lowest offer for each company.