Trading surged again on Wednesday following the sharp jump on Friday on the Jamaica Stock Exchange with the value of stocks traded exceeding $1 billion, with trading ending with the Junior and The Main Market rising above the close on Friday, with the USD Market also closing higher as the Junior Market slipped to close out trading, with market activity ending with the volume and falling below Wednesday’s levels on the penultimate day before the Christmas break for the market.
 A total of 132,966,020 shares, were traded in all three markets, up from 123,026,015 units on Friday.
The value of stocks traded on the Junior and Main markets amounts to $1.06 billion compared with $527.23 million on Friday. The JSE USD market with 127,343 shares traded for US$6,740 compared to 159,494 units at US$2,742 on Friday.
Barita Investments was one of a number of stocks dominating trading, after an exchange of 1.84 million shares at $129 million, Caribbean Cement traded 2.15 million shares for $115.6 million, Mailpac Group trading 50.06 million shares for $103 million, Jamaican Teas ended with an exchange of 32.75 million units for $74.8 million, NCB Financial traded 3,108,015 shares at $202 million, Wisynco Group closed with 4.37 million shares for $93.8 million, Sygnus Credit Investments closed with 5.88 million at $62.9 million and Pan Jamaica had an exchange of 1.55 million shares for $76.7 million.
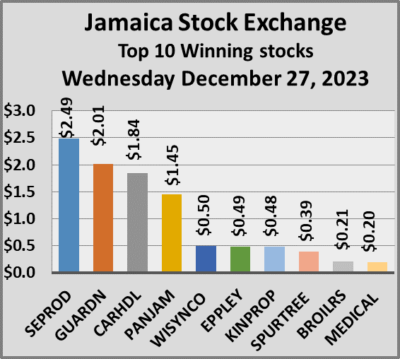
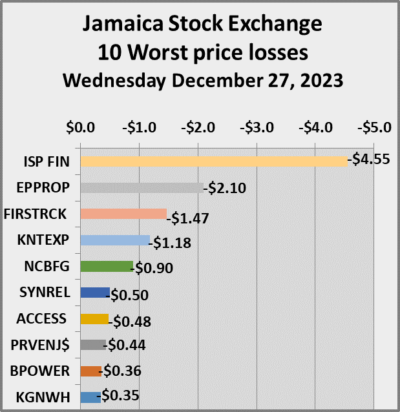
At the close of the market, Main Market stocks rallying were Seprod up $2.49, Guardian Holdings with a rise of $2.01, Pan Jamaica up $1.45 and Wisynco Group, up 50 cents. Declining Main Market stocks were Eppley Caribbean Property down $2.10 90 cents, First Rock Real Estate with a loss of $1.47 and NCB Financial with a fall of 90 cents.
Rising Junior Market stocks include Cargo handlers up $1.84, Spur Tree Spices gaining 39 cents and Medical Disposables up 20 cents. ISP Financial lost $4.55 and Knutsford Express fell $1.18.
 At the close of trading, the JSE Combined Market Index rose 1,922.04 points to close at 330,516.72, the All Jamaican Composite Index rallied 858.00 points to 354,396.78, the JSE Main Index rallied 761.89 points to wrap-up trading at 317,560.34. The Junior Market Index popped 5.11 points to end the day at 3,733.25 and the JSE USD Market Index rose 1.36 points to conclude trading at 222.46.
In the preference segment, no stock traded with a notable price change.
The market’s PE ratio, the most popular measure used to determine the value of stocks, ended at 21 on 2022-23 earnings and 14.1 times those for 2023-24 at the close of trading. ICInsider.com PE ratio chart and the more detailed daily charts provide investors with regularly updated information to help decision-making.
The PE ratio chart covers all ordinary shares on the Jamaica Stock Exchange, grouped by industry, allowing for easy comparisons between the same sector companies and the overall market. The EPS & PE ratios are based on 2023 and 2024 actual or projected earnings, excluding major one off items.
Investors need pertinent information to navigate numerous investment options successfully in the stock market. The ICInsider.com PE ratio chart and the more detailed daily report charts provide investors with regularly updated information to help decision-making.
Investors should use the chart to help make rational decisions when investing in stocks close to the average for the sector and not going too far from it unless there are compelling reasons to do so. This approach helps to remove emotions from investment decisions and place them on fundamentals while at the same time not being too far from the majority of investors. Investors who buy when the price of a stock is close to the average will find that they are not inclined to overpay for a stock.
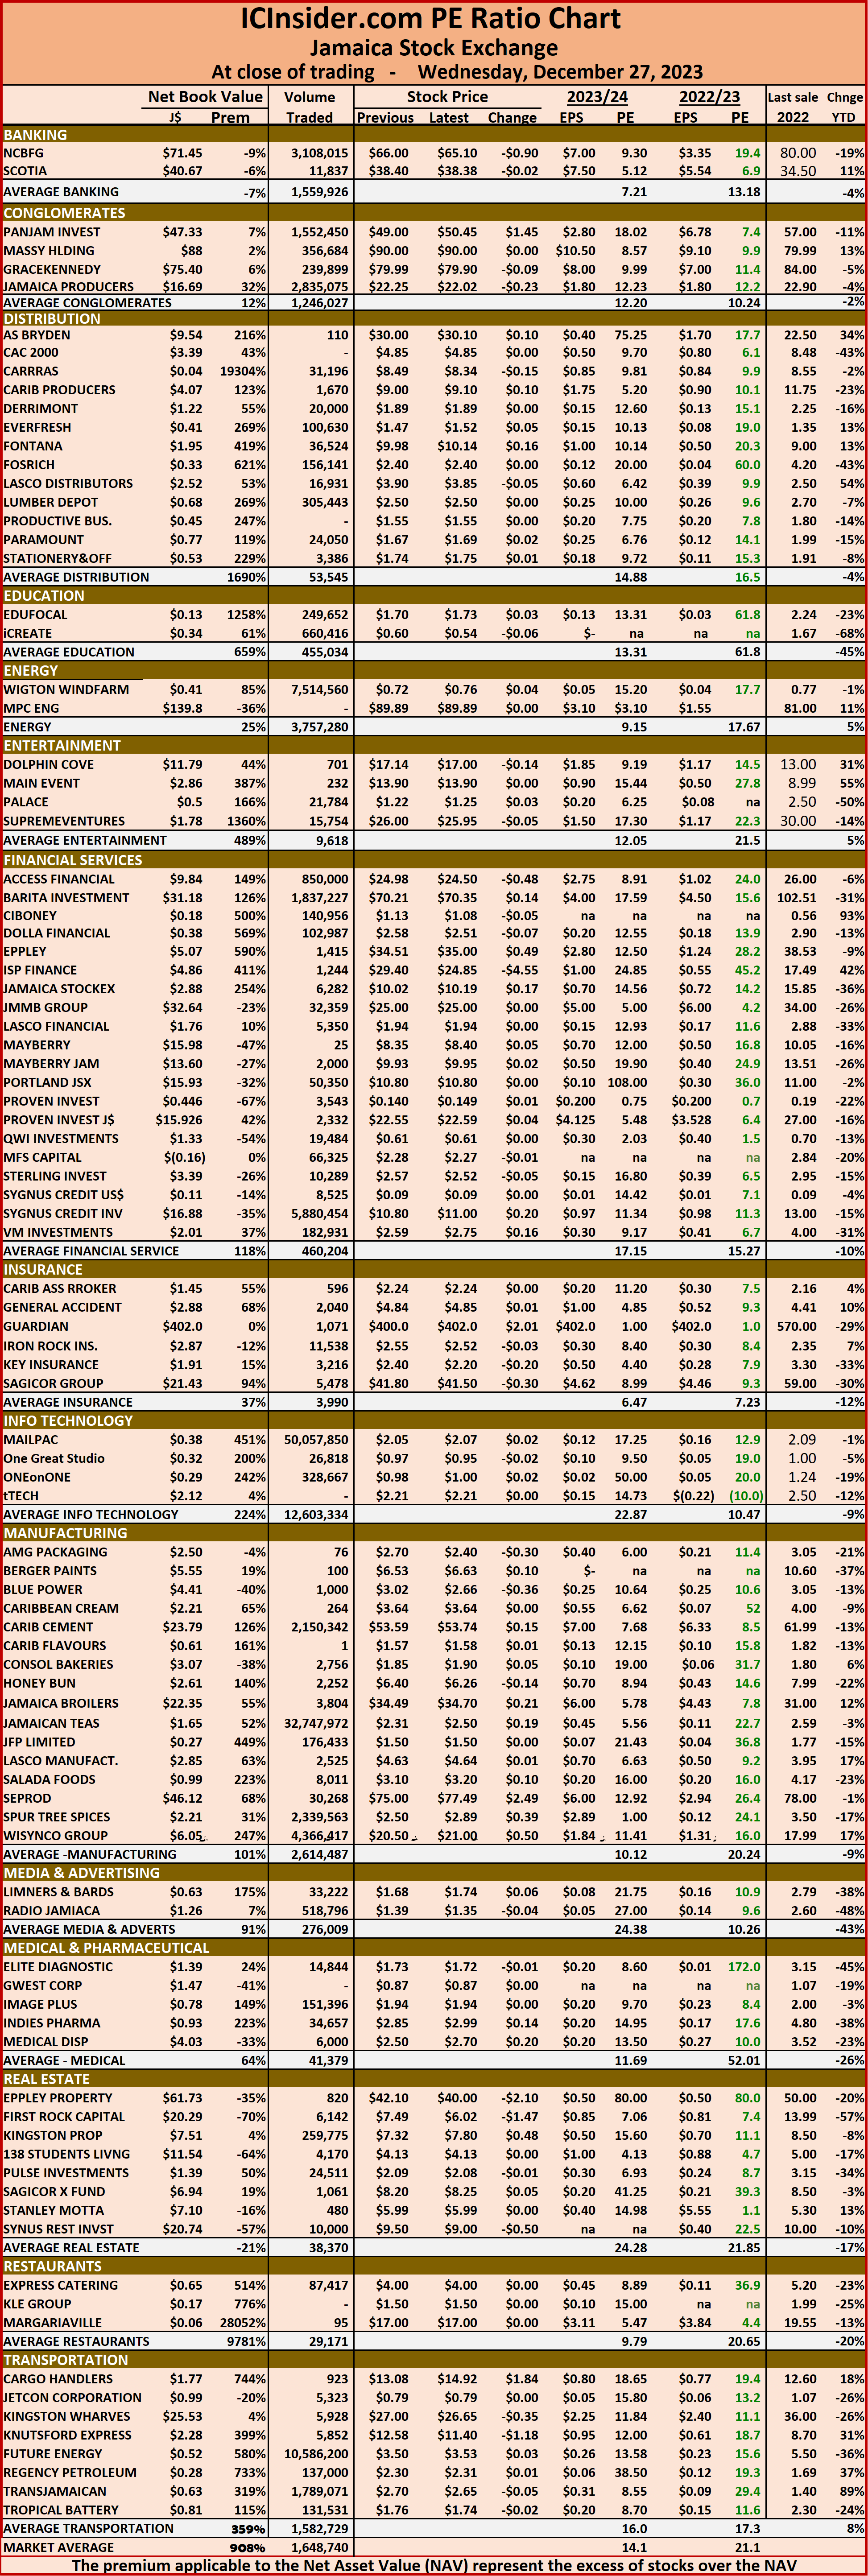 The net asset value of each company is reported as a guide to quickly assess the value of stocks based on this measure. The chart also shows daily changes in stock prices and the percentage year to date price movement based on the last traded prices.
Dividends paid or payable and yields for each company are shown in the Main and Junior Markets’ daily report charts, along with the closing volume pertaining to the highest bid and the lowest offer for each company.
Trading surge for Jamaican stocks
December 27, 2023 by IC Insider.com
Filed Under: Feature Stories, JSE Combined, Stock Market Tagged With: Cargo Handlers, Caribbean Cement, Daily Trading, Emerging market, Guardian Holdings, Jamaica Stock Exchange, Jamaica Stock Exchange Combined Index, Jamaican stocks, JSE Main Index, junior market, Junior Market index, Knutsford Express, Medical Disposables, NCB Financial Group, Net asset Value of Jamaican stocks, PE Ratio of Jamaican stocks, Spur Tree Spices, Trading Activity, Wisynco Group
About IC Insider.com


