The Junior Market closed solidly higher at the close of trading on Tuesday and held on to the bulk of the gains achieved after the market opened solidly higher at the commencement of trading, at the close, the USD market closed marginally higher and the Main Market that jumped sharply in the morning session of the Jamaica Stock Exchange declined to close the day marginally lower with the number of stocks changing hands falling, with the value of stocks traded jumping sharply over the previous day, resulting in prices of 27 shares rising and 42 declining.
 At the close of trading, the JSE Combined Market Index climbed by 170.39 points to close at 321,468.57, the All Jamaican Composite Index dropped 945.77 points to end the day at 349,182.53 and the JSE Main Index dipped 226.85 points to finish at 308,240.19. The Junior Market Index rallied 53.92 points to 3,723.93 and the JSE USD Market Index slipped 0.05 points to settle at 231.99.
At the close of trading, 19,413,847 shares were exchanged in all three markets, quite below the 25,096,434 units trading on Monday, with the value of stocks traded on the Junior and Main markets amounted to $404.59 million, well over the $303.10 million on the previous trading day and the JSE USD market closed with an exchange of 61,115 shares for US$1,543 compared to 46,461 units at US$5,650 on Monday.
In Main Market activity, NCB Financial led trading with 6.39 million shares followed by Wigton Windfarm with 1.87 million stocks, Transjamaican Highway with 1.26 million shares and Sagicor Select Financial Fund with 1.02 million units.
In Junior Market trading, MFS Capital Partners led trading with 1.05 million shares followed by ONE on ONE Educational with 624,842 units and Jamaican Teas with 500,018 stocks.
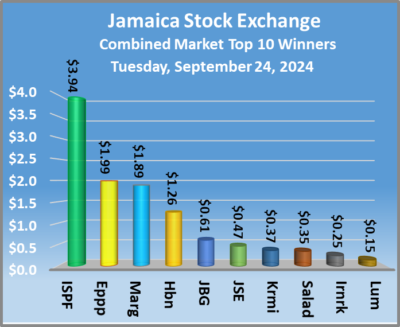
 In the preference segment, Eppley 7.25% preference share rose 99 cents to $19.59, Eppley 7.75% preference share gained $2 to finish at $21.99 and 138 Student Living preference share shed $1.01 to close at $179.99.
The market’s PE ratio, the most popular measure used to value stocks, ended at 19.7 on 2023-24 earnings and 13.3 times those for 2024-25 at the close of trading. ICInsider.com PE ratio chart and more detailed daily charts provide investors with regularly updated information to help decision-making.
The PE ratio chart covers all ordinary shares on the Jamaica Stock Exchange, grouped by industry, allowing for easy comparisons within a sector and the overall market. The EPS & PE ratios are based on 2023 and 2024 actual or projected earnings, excluding major one off items.
Pertinent information is required to navigate numerous investment options successfully in the stock market. The ICInsider.com PE ratio chart and more detailed daily charts provide investors with regularly updated information to help decision-making.
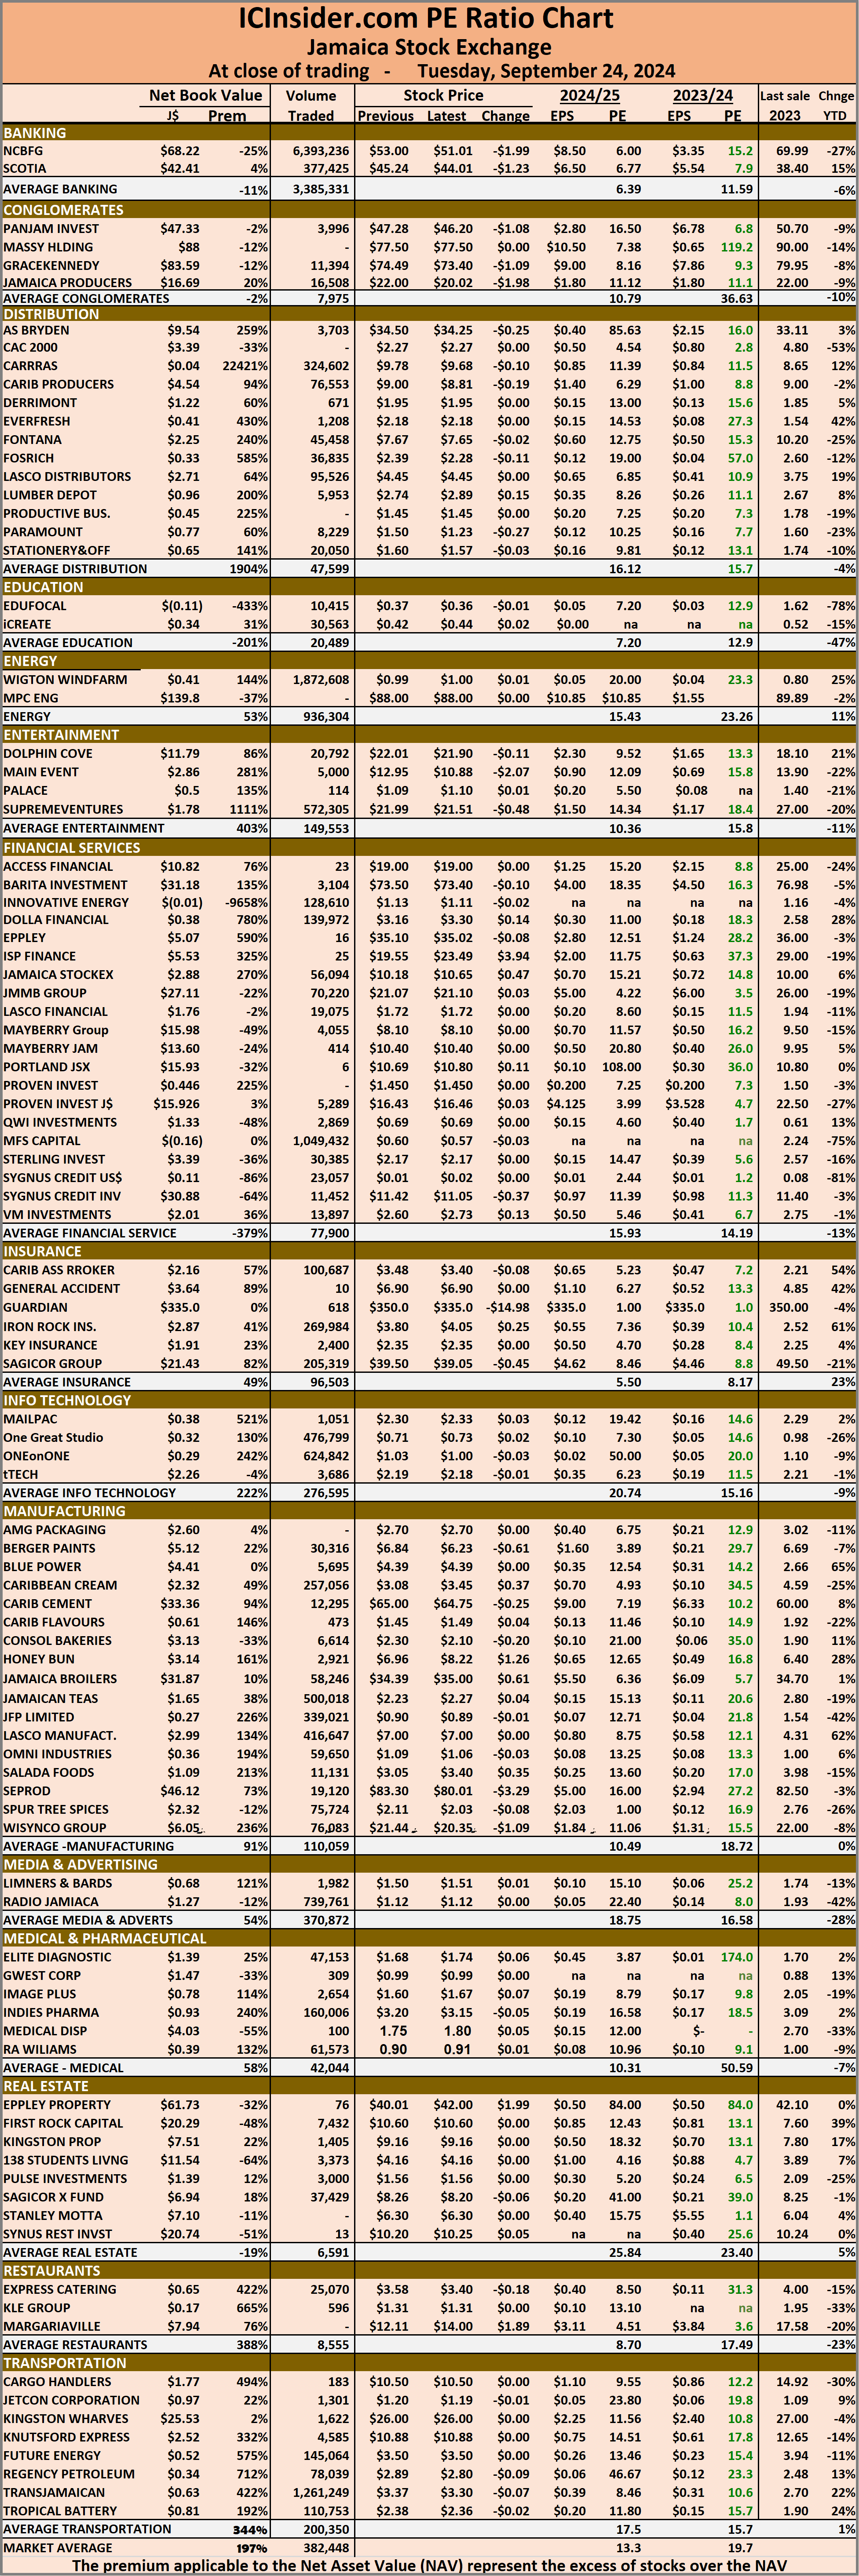 The chart should be used in making rational decisions when investing in stocks close to the average for the sector, not going too far from it unless there are compelling reasons to do so. This approach helps to remove emotions from investment decisions and place them on fundamentals while at the same time not being too far from the majority of investors. Investors who buy when the price of a stock is close to the average will find that they are not inclined to overpay for a stock.
The net asset value of each company is incorporated into the chart. Investors can use this measure in assessing stock values. The chart also shows daily changes in stock prices and the percentage year to date price movement based on the last traded prices.
Dividends that are paid or are due to be paid and yields for each company are shown in the Main and Junior Markets’ daily report charts, along with the closing volume of the highest bid and the lowest offer for each company.
Trading jumps on the Jamaican Stock Exchange
Filed Under: Feature Stories, JSE Combined, Stock Market Tagged With: 138 Student Living, Caribbean Cement, Daily Trading, Emerging market, Eppley, Jamaica Producers, Jamaica Stock Exchange, Jamaica Stock Exchange Combined Index, Jamaican stocks, JSE Main Index, junior market, Junior Market index, NCB Financial, Net asset Value of Jamaican stocks, Pan Jam, PE Ratio of Jamaican stocks, Productive Business Solutions, RA Williams, Scotia Group, Seprod, Trading Activity, Transjamaican Highway, Wigton Windfarm
About IC Insider.com


Speak Your Mind
You must be logged in to post a comment.