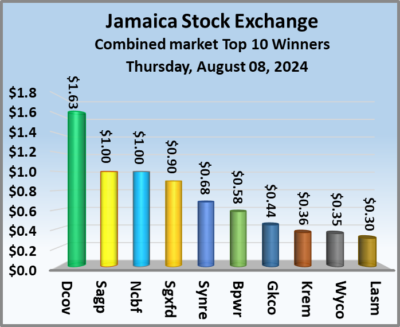
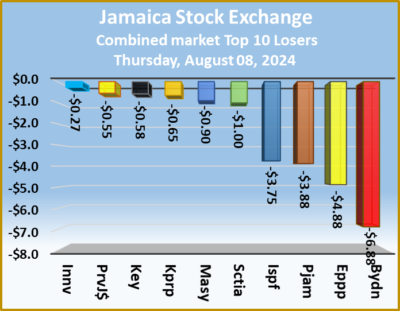
The Main Market and the Junior Market of the Jamaica Stock Exchange declined at the close of trading on Thursday as the JSE USD market closed marginally higher as trading ended with the number and the value of stocks that were exchanged declined from trading on the previous day, resulting in prices of 27 shares rising and 37 declining.
 At the close of trading, the JSE Combined Market Index fell 278.44 points to close at 321,471.8, the All Jamaican Composite Index dipped 234.32 points to 350,589.54 and the JSE Main Index slipped 148.64 points to settle at 308,690.08. The Junior Market Index sank 19.21 points to close at 3,665.17 and the JSE USD Market Index increased by 1.72 points to lock up trading at 224.82.
At the close of trading, 14,731,938 shares were exchanged in all three markets, down from 15,578,137 units on Wednesday, with the value of stocks traded on the Junior and Main markets amounted to just $43.08 million, falling below the moderate $55.05 million on the previous trading day and the JSE USD market closed with an exchange of 43,698 shares for US$3,627 compared to 411,077 units at US$8,093 on Wednesday.
In Main Market activity, Wigton Windfarm led trading with 2.60 million shares followed by Transjamaican Highway with 948,466 units and JMMB 9.5% preference share with 746,701 stocks.
In Junior Market trading, Lumber Depot led trading with 3.01 million shares followed by Regency Petroleum with 887,478 stocks and Omni Industries with 718,534 units.
 In the preference segment, Sygnus Credit Investments C10.5% declined $2.90 and ended at $105.
The market’s PE ratio, the most popular measure used to value stocks, ended at 19.6 on 2023-24 earnings and 13.4 times those for 2024-25 at the close of trading. ICInsider.com PE ratio chart and more detailed daily charts provide investors with regularly updated information to help decision-making.
The PE ratio chart covers all ordinary shares on the Jamaica Stock Exchange, grouped by industry, allowing for easy comparisons within a sector and the overall market. The EPS & PE ratios are based on 2023 and 2024 actual or projected earnings, excluding major one off items.
Pertinent information is required to navigate numerous investment options successfully in the stock market. The ICInsider.com PE ratio chart and more detailed daily charts provide investors with regularly updated information to help decision-making.
The chart should be used in making rational decisions when investing in stocks close to the average for the sector, not going too far from it unless there are compelling reasons to do so. This approach helps to remove emotions from investment decisions and place them on fundamentals while at the same time not being too far from the majority of investors. Investors who buy when the price of a stock is close to the average will find that they are not inclined to overpay for a stock.
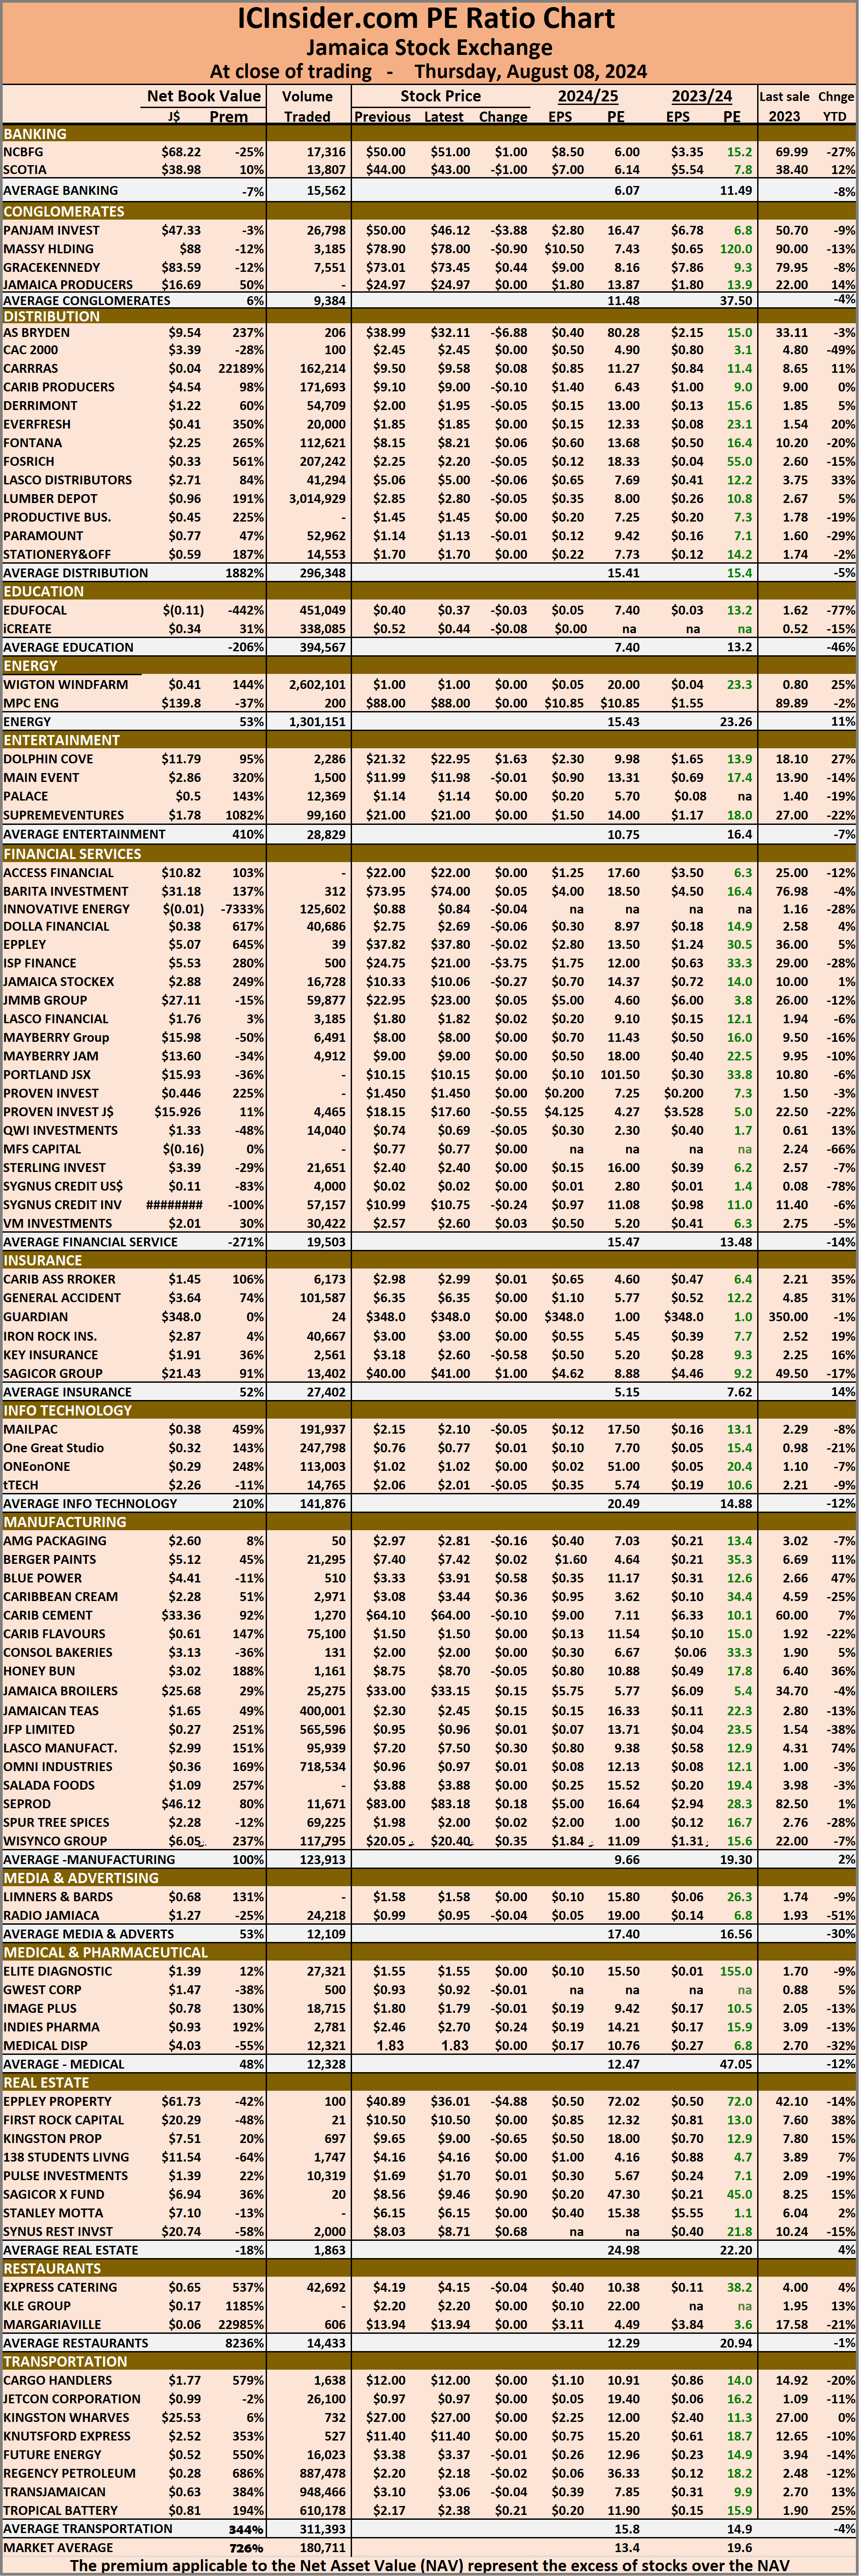 The net asset value of each company is incorporated into the chart. Investors can use this measure in assessing stock values. The chart also shows daily changes in stock prices and the percentage year to date price movement based on the last traded prices.
Dividends that are paid or are due to be paid and yields for each company are shown in the Main and Junior Markets’ daily report charts, along with the closing volume of the highest bid and the lowest offer for each company.
Trading drops on the JSE markets
August 8, 2024 by IC Insider.com
Filed Under: Feature Stories, JSE Combined, Stock Market Tagged With: 138 Student Living, Caribbean Cement, Daily Trading, Emerging market, Eppley, Jamaica Producers, Jamaica Stock Exchange, Jamaica Stock Exchange Combined Index, Jamaican stocks, JPS, JSE Main Index, junior market, Junior Market index, NCB Financial, Net asset Value of Jamaican stocks, Pan Jam, PE Ratio of Jamaican stocks, Productive Business Solutions, Scotia Group, Seprod, Trading Activity, Transjamaican Highway, Wigton Windfarm
About IC Insider.com