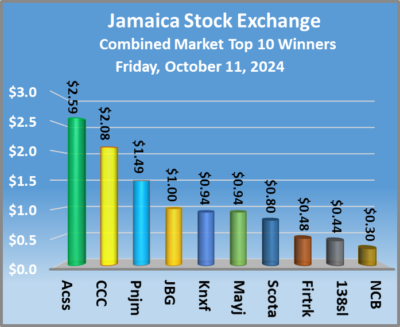
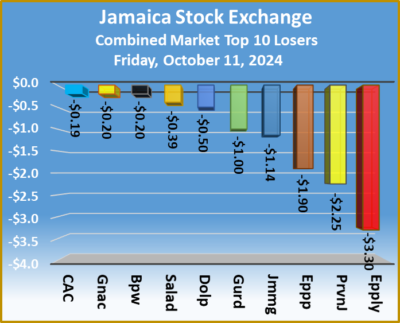
The Main Market rose appreciably in trading on the Jamaica Stock Exchange on Friday as the Junior Market eked out a modest rise and the JSE USD market closed moderately lower on a day of slow trading that ended with the number and the value of stocks changing hands falling, resulting in prices of 25 shares rising and 38 declining.
 At the close of trading, the JSE Combined Market Index rallied 1,079.28 points to 325,670.96, the All Jamaican Composite Index jumped 2,315.52 points to 357,986.26, the JSE Main Index rose 1,094.94 points to 312,620.28. The Junior Market Index climbed just 4.50 points to end at 3,725.93 and the JSE USD Market Index fell 1.56 points to end at 220.60.
At the close of trading, a mere 7,927,009 shares were exchanged in all three markets, down from 16,269,115 units on Thursday with the value of stocks traded on the Junior and Main markets amounted to $54.13 million, just below the $62.93 million on the previous trading day and the JSE USD market closed with an exchange of 386,222 shares for US$19,062 compared to 143,387 units at US$6,984 on Thursday.
On a tepid trading day, Main Market activity ended with, Transjamaican Highway being the leading trade with 1.71 million shares followed by Wigton Windfarm with 1.14 million units and QWI Investments with 608,452 stock units.
On a subdued day of trading in the Junior Market trading, JFP Ltd was the lead trade with 578,834 shares followed by Lumber Depot with 332,517 units and Jamaican Teas with 156,696 stock units.
The preference segment had no stock trading with a notable price movement.
 The market’s PE ratio, the most popular measure used to value stocks, ended at 21 on 2023-24 earnings and 13 times those for 2024-25 at the close of trading. ICInsider.com PE ratio chart and more detailed daily charts provide investors with regularly updated information to help decision-making.
The PE ratio chart covers all ordinary shares on the Jamaica Stock Exchange, grouped by industry, allowing for easy comparisons within a sector and the overall market. The EPS & PE ratios are based on 2023 and 2024 actual or projected earnings, excluding major one off items.
Pertinent information is required to navigate numerous investment options successfully in the stock market. The ICInsider.com PE ratio chart and more detailed daily charts provide investors with regularly updated information to help decision-making.
The chart should be used in making rational decisions when investing in stocks close to the average for the sector, not going too far from it unless there are compelling reasons to do so. This approach helps to remove emotions from investment decisions and place them on fundamentals while at the same time not being too far from the majority of investors. Investors who buy when the price of a stock is close to the average will find that they are not inclined to overpay for a stock.
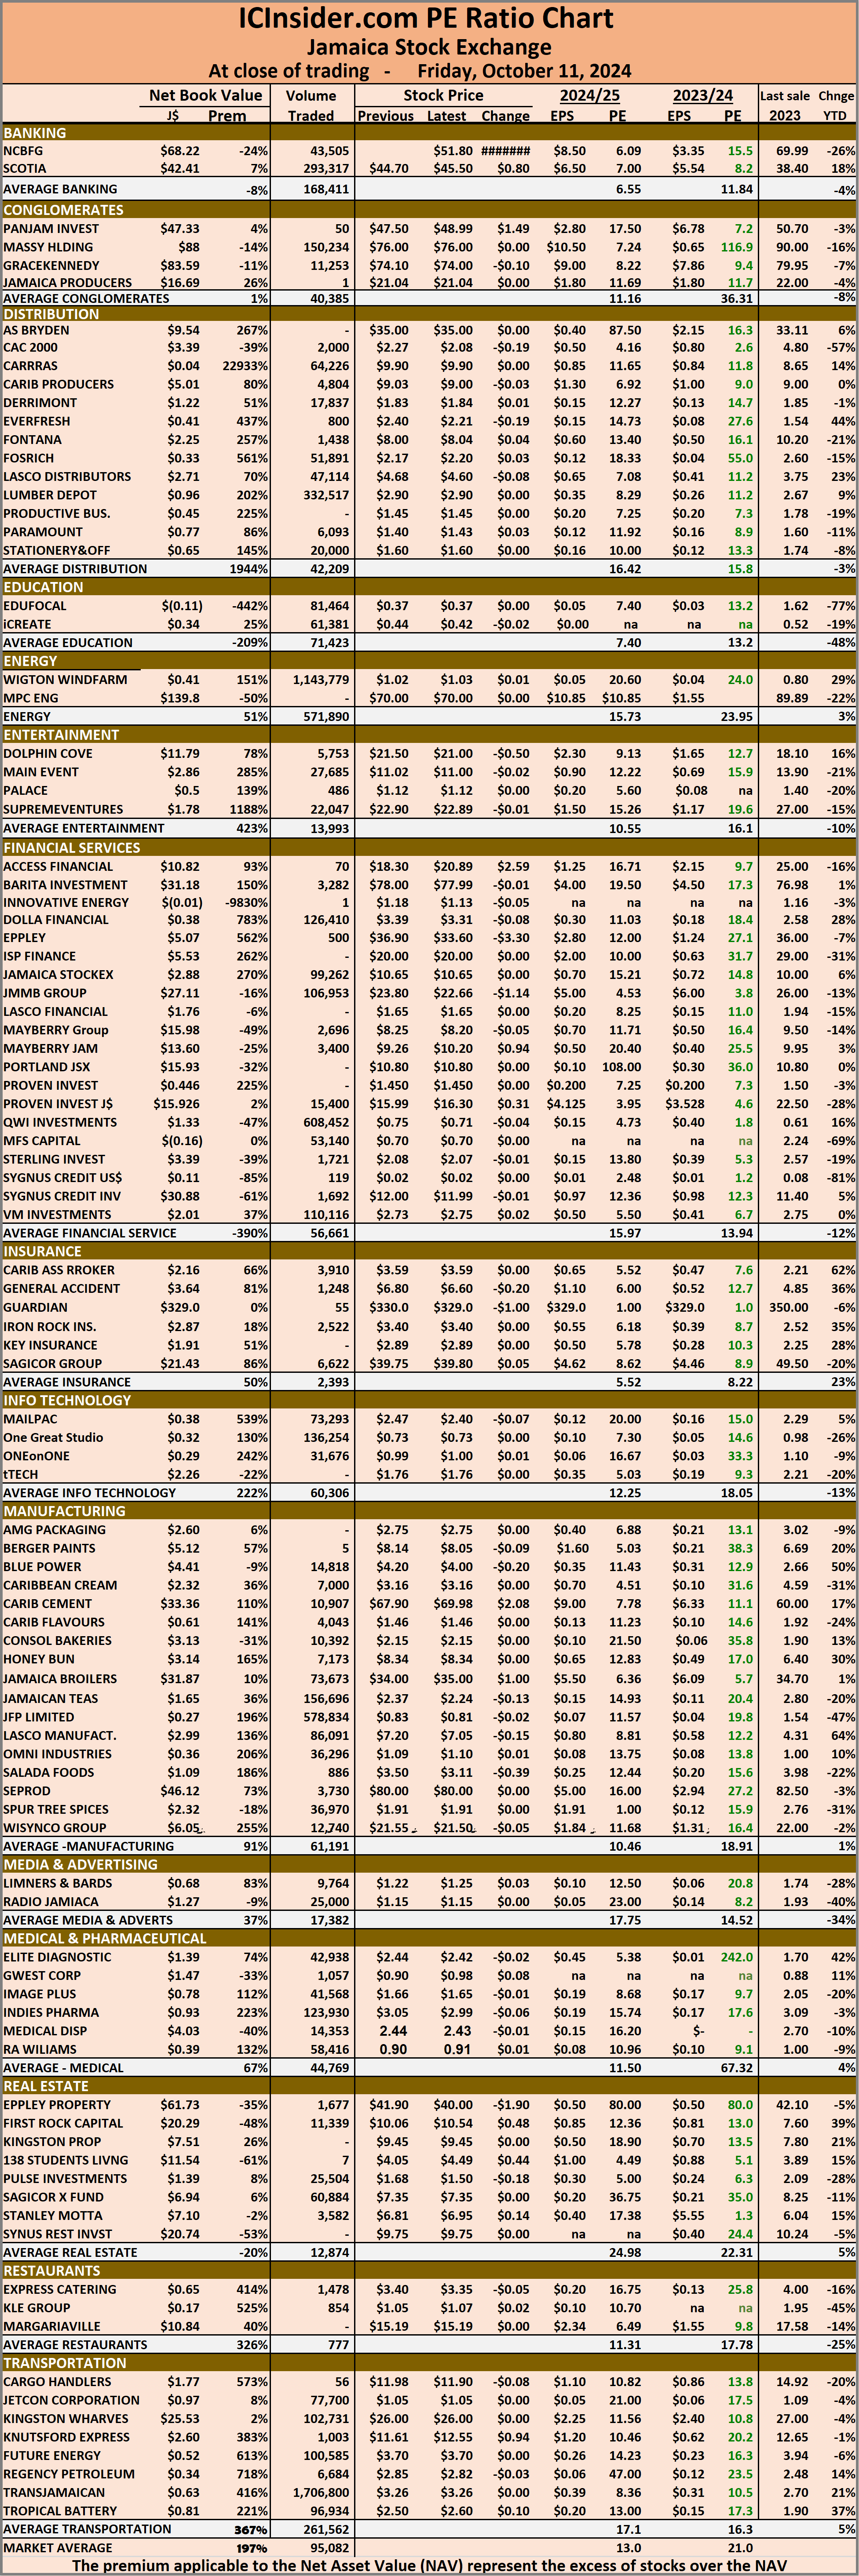 The net asset value of each company is incorporated into the chart. Investors can use this measure in assessing stock values. The chart also shows daily changes in stock prices and the percentage year to date price movement based on the last traded prices.
Dividends that are paid or are due to be paid and yields for each company are shown in the Main and Junior Markets’ daily report charts, along with the closing volume of the highest bid and the lowest offer for each company.
Trading drops on the Jamaica Stock Exchange
Filed Under: Feature Stories, JSE Combined, Stock Market Tagged With: 138 Student Living, Caribbean Cement, Daily Trading, Emerging market, Eppley, Jamaica Producers, Jamaica Stock Exchange, Jamaica Stock Exchange Combined Index, Jamaican stocks, JPS, JSE Main Index, junior market, Junior Market index, NCB Financial, Net asset Value of Jamaican stocks, Pan Jam, PE Ratio of Jamaican stocks, Productive Business Solutions, RA Williams, Scotia Group, Seprod, Trading Activity, Transjamaican Highway, Wigton Windfarm
About IC Insider.com


Speak Your Mind
You must be logged in to post a comment.