The Junior Market and the JSE USD Market bounced in trading on Wednesday as the Main Market of the Jamaica Stock Exchange declined after the market ended trading with a drop in the number of stocks changing hands, with the value falling from the previous trading day, resulting in prices of 31 shares rising and 38 declining.
 At the close of trading, the JSE Combined Market Index declined 1,284.86 points to 321,482.79, the All Jamaican Composite Index lost 393.83 points to end at 350,784.73 and the JSE Main Index dropped 1,716.09 points to 308,869.86. The Junior Market Index jumped 49.59 points to 3,642.09 and the JSE USD Market Index popped 5.80 points to end at 234.08.
At the close of trading, 10,764,954 shares were exchanged in all three markets, down from 47,160,532 units on Tuesday, with the value of stocks traded on the Junior and Main markets amounted to $55.44 million, well below the $134.91 million on the previous trading day and the JSE USD market closed with an exchange of just 4,998 shares for US$383 compared to 6,189,214 units at US$129,634 on Tuesday.
In Main Market activity, Transjamaican Highway led trading with 2.81 million shares followed by Wigton Windfarm with 1.06 million units and Sagicor Real Estate Fund with 178,695 stocks.
In Junior Market trading, Derrimon Trading led trading with 1.68 million shares followed by RA Williams with 1.09 million units and Regency Petroleum with 326,110 stock units.
 In the preference segment, 138 Student Living preference share dropped $30 to $165.
The market’s PE ratio, the most popular measure used to value stocks, ended at 19.7 on 2023-24 earnings and 13.3 times those for 2024-25 at the close of trading. ICInsider.com PE ratio chart and more detailed daily charts provide investors with regularly updated information to help decision-making.
The PE ratio chart covers all ordinary shares on the Jamaica Stock Exchange, grouped by industry, allowing for easy comparisons within a sector and the overall market. The EPS & PE ratios are based on 2023 and 2024 actual or projected earnings, excluding major one off items.
Pertinent information is required to navigate numerous investment options successfully in the stock market. The ICInsider.com PE ratio chart and more detailed daily charts provide investors with regularly updated information to help decision-making.
The chart should be used in making rational decisions when investing in stocks close to the average for the sector, not going too far from it unless there are compelling reasons to do so. This approach helps to remove emotions from investment decisions and place them on fundamentals while at the same time not being too far from the majority of investors. Investors who buy when the price of a stock is close to the average will find that they are not inclined to overpay for a stock.
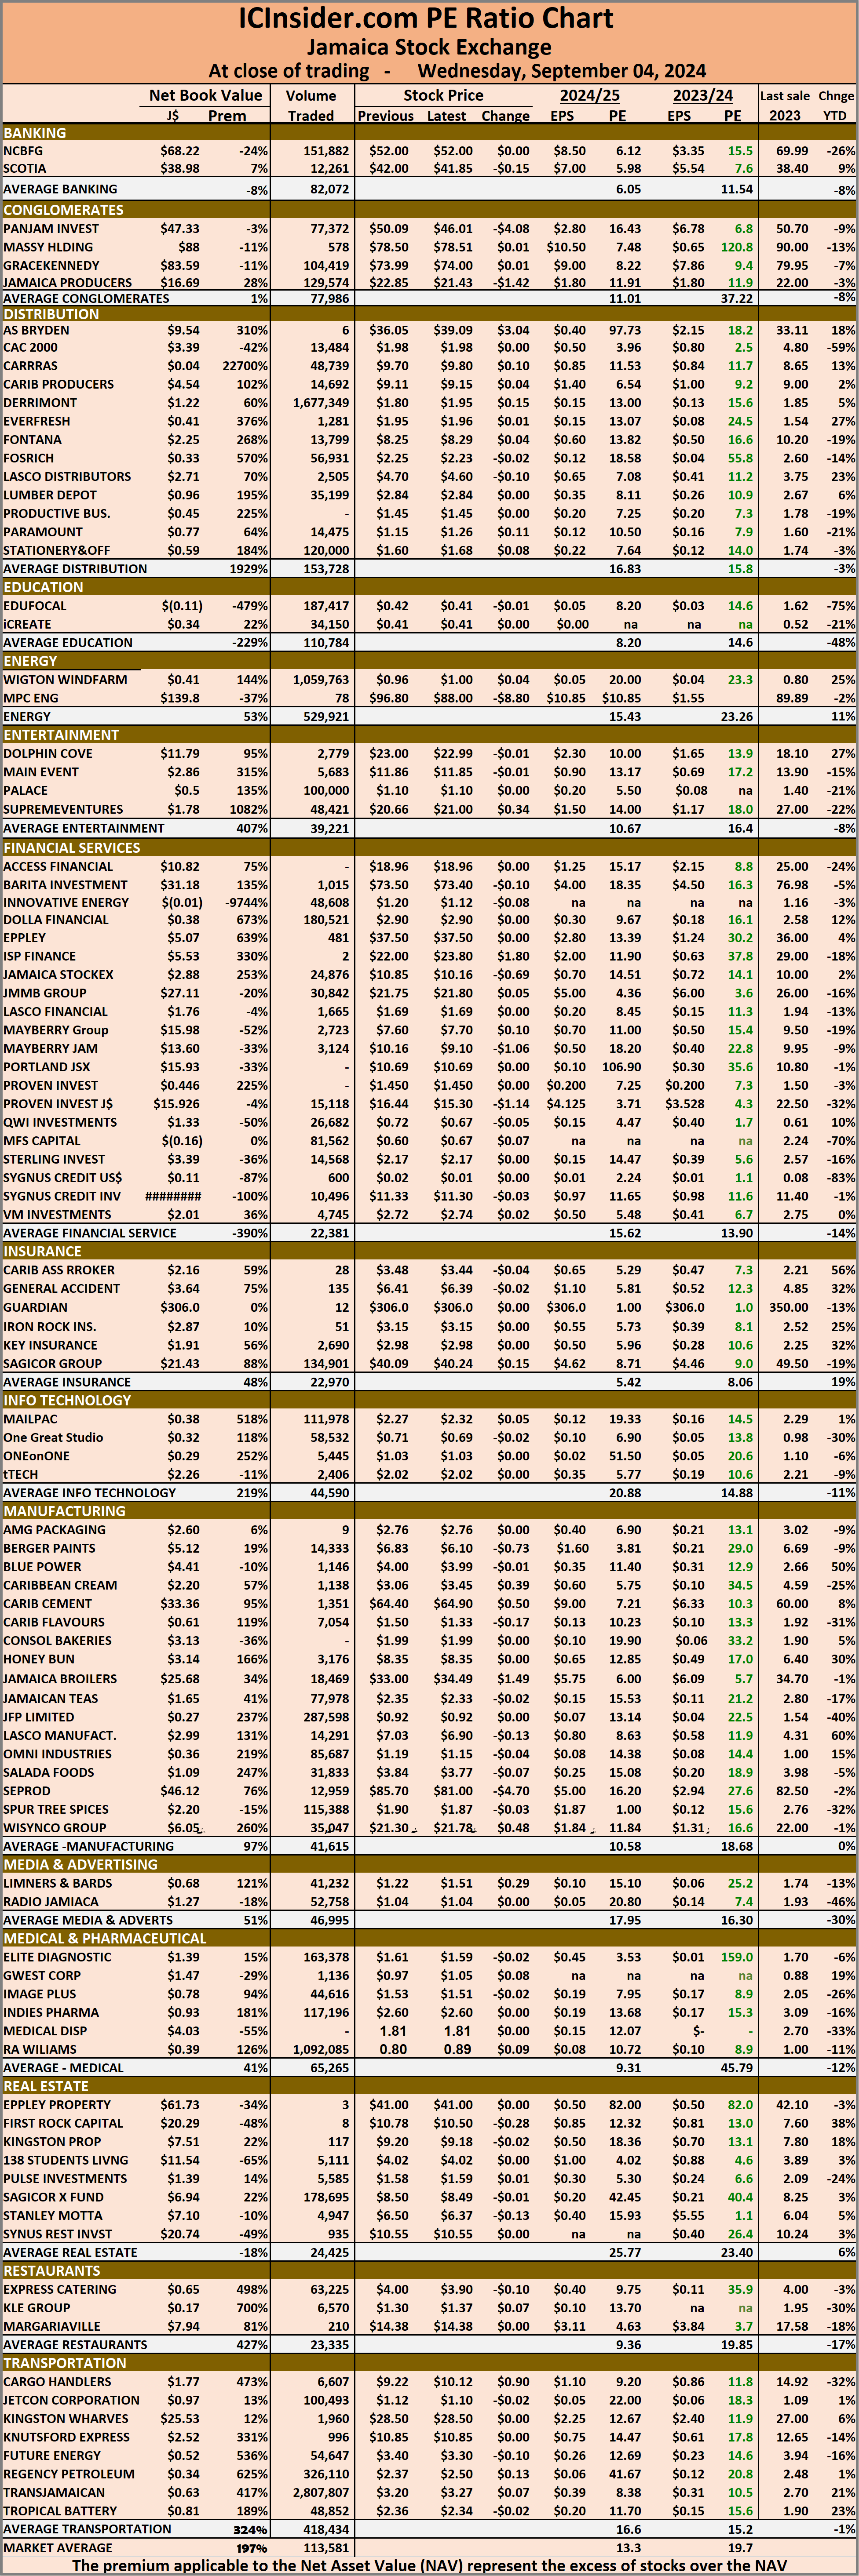 The net asset value of each company is incorporated into the chart. Investors can use this measure in assessing stock values. The chart also shows daily changes in stock prices and the percentage year to date price movement based on the last traded prices.
Dividends that are paid or are due to be paid and yields for each company are shown in the Main and Junior Markets’ daily report charts, along with the closing volume of the highest bid and the lowest offer for each company.
Trading drop on the JSE markets Wednesday
September 4, 2024 by IC Insider.com
Filed Under: Feature Stories, JSE Combined, Stock Market Tagged With: 138 Student Living, Caribbean Cement, Daily Trading, Emerging market, Eppley, Jamaica Producers, Jamaica Stock Exchange, Jamaica Stock Exchange Combined Index, Jamaican stocks, JSE Main Index, junior market, Junior Market index, NCB Financial, Net asset Value of Jamaican stocks, Pan Jam, PE Ratio of Jamaican stocks, Productive Business Solutions, Scotia Group, Seprod, Trading Activity, Transjamaican Highway, Wigton Windfarm
About IC Insider.com