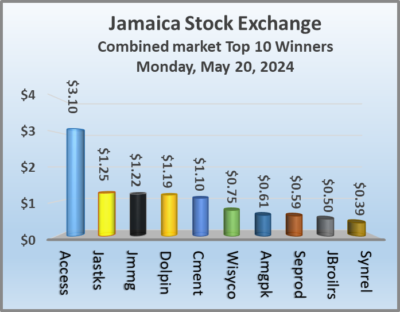
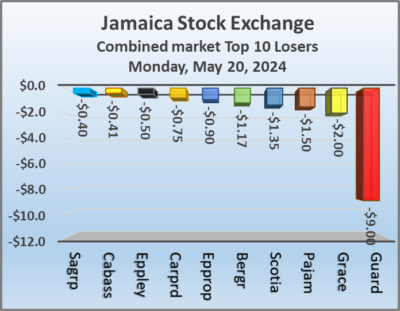
Rising stocks outclassed those declining on the Main Market of the Jamaica Stock Exchange on Monday but the market indices dropped at the end of trading, the Junior Market rose while the JSE USD market closed moderately higher as trading ended with the number and the value of stocks changing hands falling from the previous trading day, resulting in prices of 35 shares rising and 32 declining.
 At the close of trading, the JSE Combined Market Index climbed 682.46 points to 333,310.47 and the All Jamaican Composite Index fell 551.92 points to 357,848.33. The JSE Main Index shed 811.24 points to settle at 320,505.98. The Junior Market Index rose 13.66 points to 3,740.25 and the JSE USD Market Index gained 1.51 points to close at 238.56.
At the close of trading, 17,563,944 shares were exchanged in all three markets, down from 32,255,498 units on Friday, with the value of stocks traded on the Junior and Main markets amounted to $75.2 million, well below the $497.67 million on Friday and the JSE USD market closed with an exchange of 98,295 shares for US$9,105 compared to 280,988 units at US$32,878 on Friday.
In Main Market activity, Wigton Windfarm led trading with 2.38 million shares followed by Transjamaican Highway with 1.11 million stocks and Lasco Distributors with 1.10 million units.
In the Junior Market, ONE on ONE Educational led trading with 4.37 million shares followed by Stationery and Office Supplies with 2.01 million stock units and Everything Fresh with 908,181 units.
 In the preference segment, Sygnus Credit Investments C10.5% gained $1 to end at $109.
The market’s PE ratio, the most popular measure used to determine the value of stocks, sits at 21.3 on 2023-24 earnings and 13.3 times those for 2024-25 at the close of trading. ICInsider.com PE ratio chart and the more detailed daily charts provide investors with regularly updated information to help decision-making.
The PE ratio chart covers all ordinary shares on the Jamaica Stock Exchange, grouped by industry, allowing for easy comparisons within sectors and the overall market. The EPS & PE ratios are based on 2023 and 2024 actual or projected earnings, excluding major one off items.
Pertinent information is required to navigate numerous investment options successfully in the stock market. The ICInsider.com PE ratio chart and the more detailed daily report charts provide investors with regularly updated information to help decision-making.
The chart should be used in making rational decisions when investing in stocks close to the average for the sector, not going too far from it unless there are compelling reasons to do so. This approach helps to remove emotions from investment decisions and place them on fundamentals while at the same time not being too far from the majority of investors. 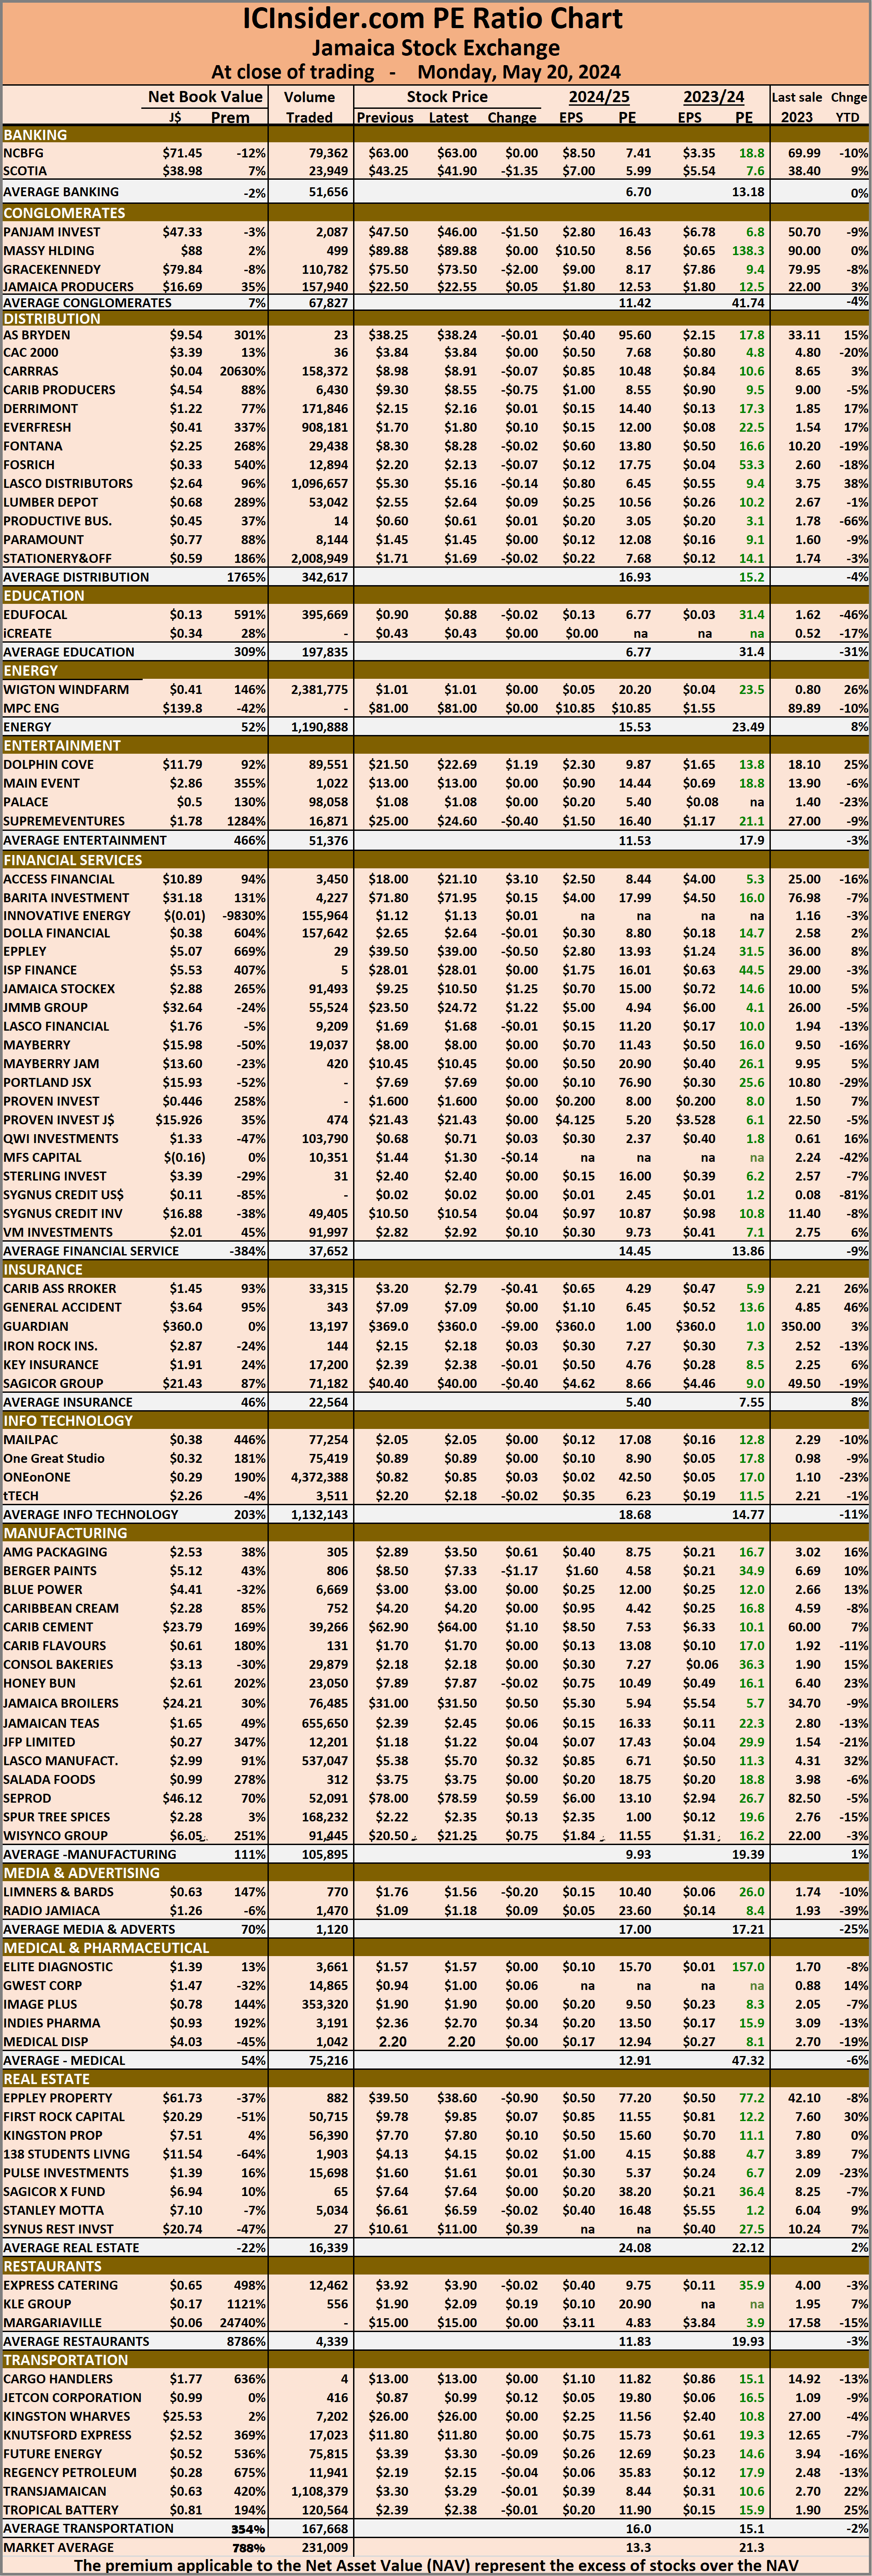 Investors who buy when the price of a stock is close to the average will find that they are not inclined to overpay for a stock.
The net asset value of each company is reported as a guide for investors to quickly assess the value of stocks based on this measure. The chart also shows daily changes in stock prices and the percentage year to date price movement based on the last traded prices.
Dividends paid or payable and yields for each company are shown in the Main and Junior Markets’ daily report charts, along with the closing volume of the highest bid and the lowest offer for each company.
Trading dives on the Jamaica Stock Exchange
May 20, 2024 by IC Insider.com
Filed Under: Feature Stories, JSE Combined, Stock Market Tagged With: 138 Student Living, Caribbean Cement, Daily Trading, Emerging market, Eppley, Jamaica Producers, Jamaica Stock Exchange, Jamaica Stock Exchange Combined Index, Jamaican stocks, JPS, JSE Main Index, junior market, Junior Market index, NCB Financial, Net asset Value of Jamaican stocks, ONE on ONE Educational, Pan Jam, PE Ratio of Jamaican stocks, Productive Business Solutions, Scotia Group, Seprod, SOS, Trading Activity, Transjamaican Highway, Wigton Windfarm
About IC Insider.com