Supreme Ventures posted a big jump 68 percent rise in profits for the March quarter and lighted the Main Market with the price jumping to close at $32 up from $27.50 on Thursday at the same time trading in the Junior Market pushed to market to another record close.
 The JSE Combined Index that jumped 6,472.00 points on Thursday climbed 5,194.97 points on Friday to end at 414,921.64. The All Jamaican Composite Index added 6,426.56 points to 7,875.41 points gained on Thursday to close at 457,454.74, the highest close since early September last year. The JSE Main Index added 5,124.13 points on Friday to end at 401,741.38 and the JSE USD market index rose 2.49 points to end at 223.49. The Junior Market gained 44.79 points to finish at a record closing high of 4,369.94, to be up 27.5 percent year to date.
The market’s PE ratio ended at 23.3 based on 2021-22 earnings and 13.1 times those for 2022-23 at the close of the Jamaica Stock Exchange.
Investors need a series of measures and pertinent information to successfully navigate the many investment choices in the local stock market. The ICInsider.com PE ratio chart and the more detailed daily report charts provide investors with regularly updated information to help with decision-making.
Investors should make use of the chart to help make rational investment decisions by investing in stocks that are close to the average for the sector and not going too far from it unless there are compelling reasons to do so. This approach helps to take emotions out of the investment decision and put in on fundamentals while at the same time not being too far from the majority of investors. Investors who buy when the price of a stock is close to the average will find that they are not inclined to overpay for a stock.
 The ICInsider.com PE Ratio chart covers all ordinary shares listed on the Jamaica Stock Exchange. It shows companies grouped on an industry basis, allowing easy comparisons between the same sector companies and the overall market.
The net asset value of each company is reported as a guide to assess the value of stocks based on this measure quickly. The chart also shows daily changes in stock prices and the percentage year to date price movement based on the last traded prices. Dividends payable and yields for each company are shown in the Main and Junior Markets’ daily report charts that show the closing volume for the bids and offers.
The EPS & PE ratios are based on 2021 and 2022 actual or projected earnings, excluding major one off items. The PE Ratio is the most popular measure used to determine the value of stocks.
 The JSE Combined Index that dropped 4,909.77 points on Wednesday spurted 6,472.00 points to end at 409,726.67. The All Jamaican Composite Index recovered all of the 7,446.51 points drop on Wednesday by adding 7,875.41 points to 451,018.18, the JSE Main Index bettered the 5,441.59 points drop by adding 6,575.09 points and ended at 396,617.25 and the JSE USD market index slipped 3.97 points to end at 221.00.
 The ICInsider.com PE Ratio chart covers all ordinary shares listed on the Jamaica Stock Exchange. It shows companies grouped on an industry basis, allowing easy comparisons between the same sector companies and the overall market.
 The All Jamaican Composite Index dived 7,446.51 points to 443,142.76, the JSE Main Index dropped 5,441.59 points to 390,042.16 and the JSE USD market index edged 0.03 points higher to end at 224.97.
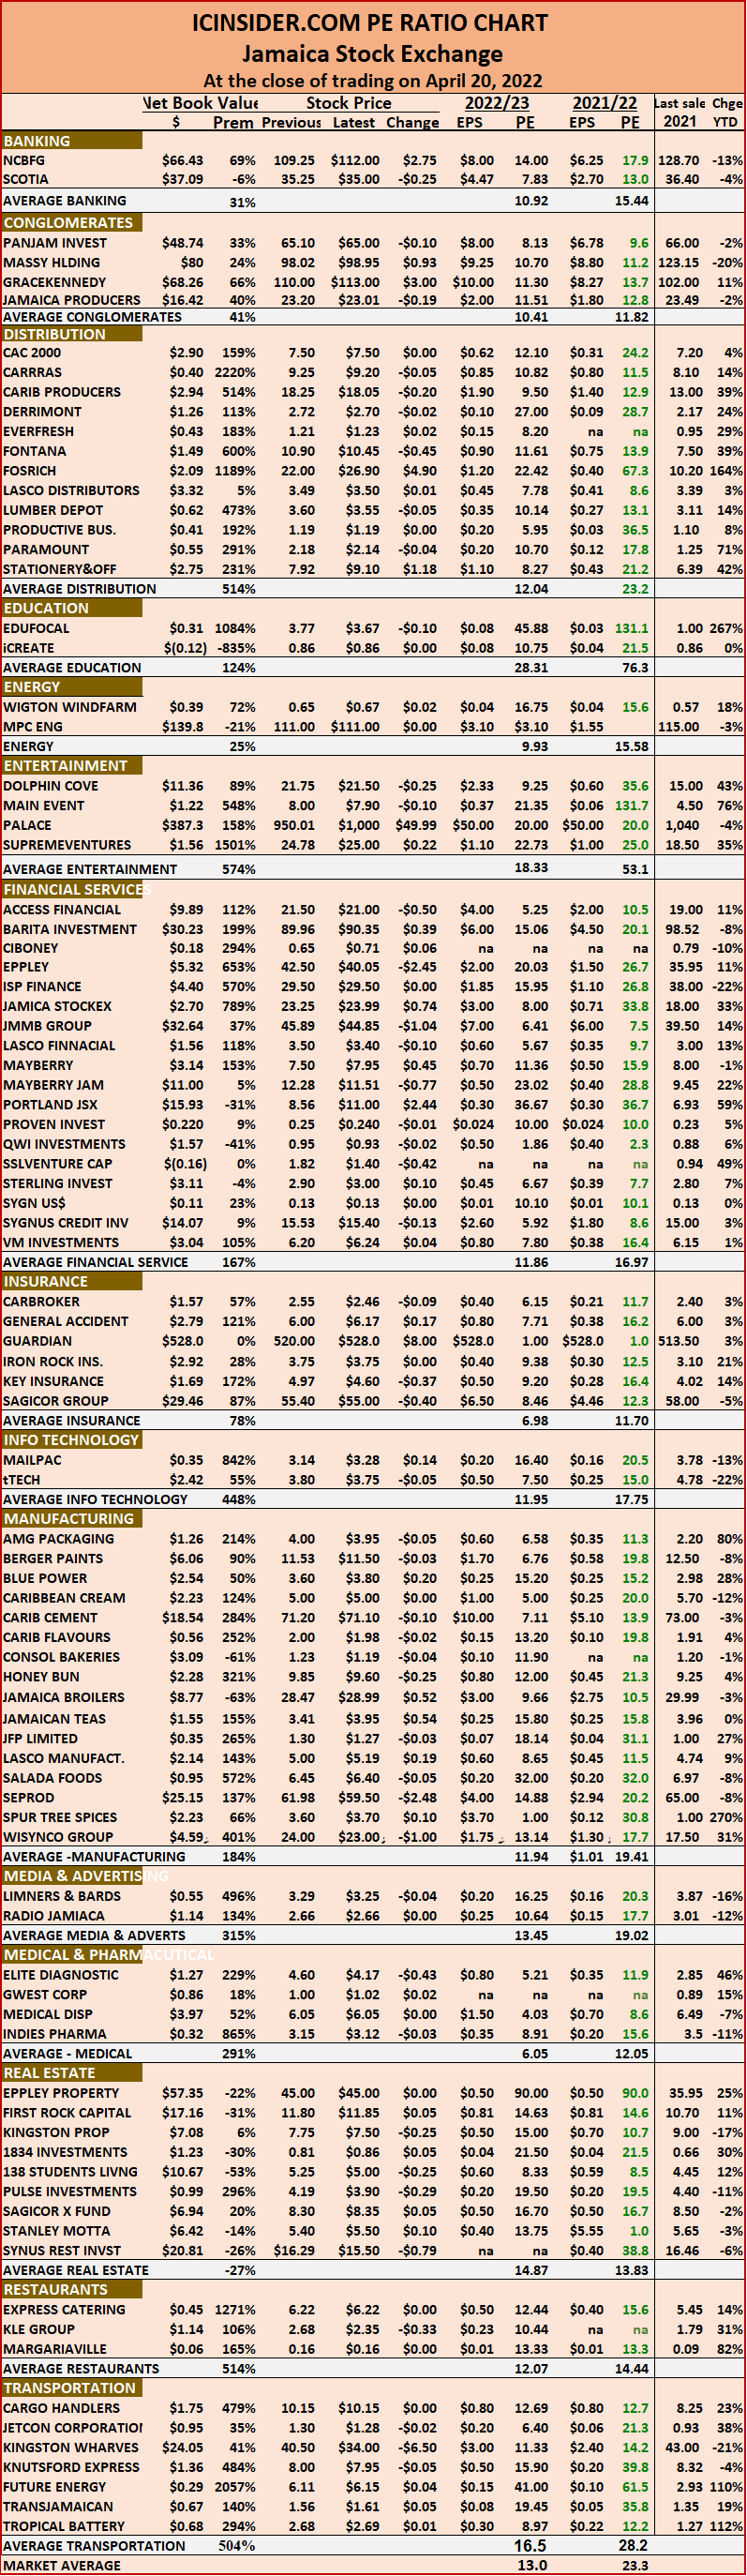 The ICInsider.com PE Ratio chart covers all ordinary shares listed on the Jamaica Stock Exchange. It shows companies grouped on an industry basis, allowing easy comparisons between the same sector companies and the overall market.
 The All Jamaican Composite Index gained 1,364.08 points to 450,589.27, the JSE Main Index rose 996.90 points to 395483.75 and the JSE USD market index popped 3.50 points to end at 224.94.
 The net asset value of each company is reported as a guide to assess the value of stocks based on this measure quickly. The chart also shows daily changes in stock prices and the percentage year to date price movement based on the last traded prices. Dividends payable and yields for each company are shown in the Main and Junior Markets’ daily report charts that show the closing volume for the bids and offers.
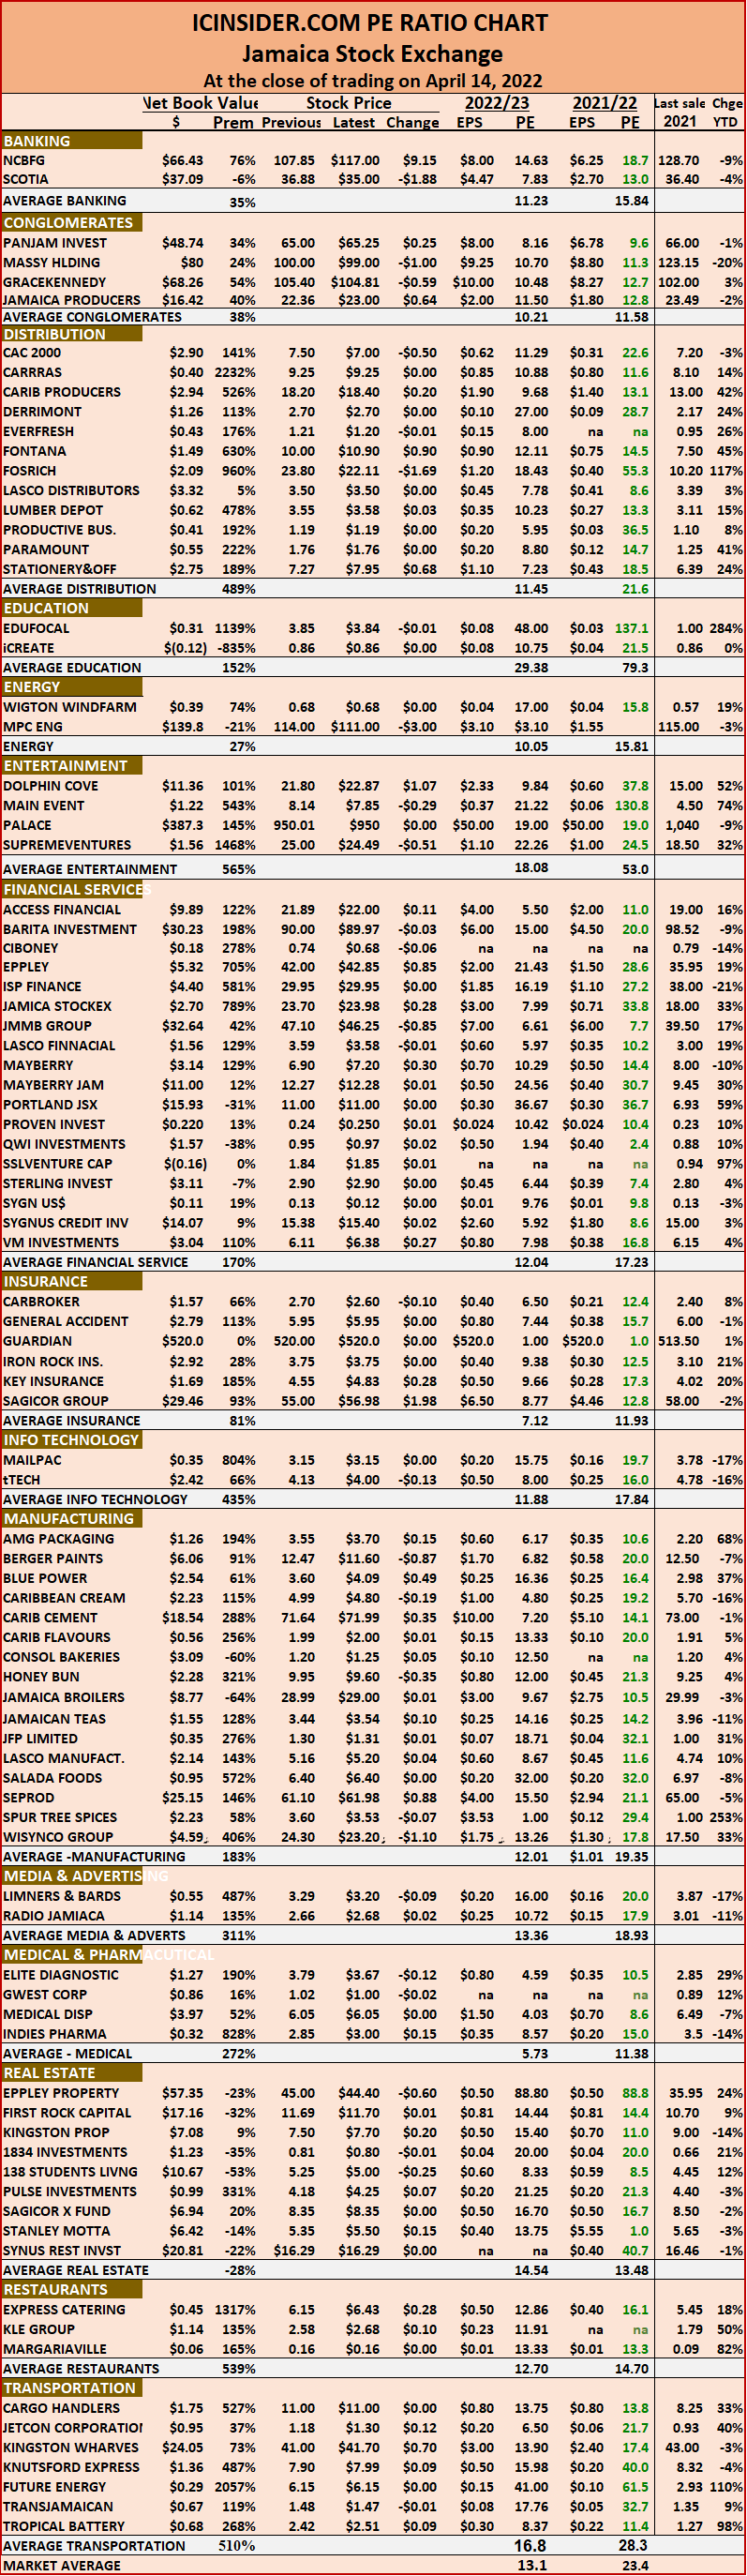 The ICInsider.com PE Ratio chart covers all ordinary shares listed on the Jamaica Stock Exchange. It shows companies grouped on an industry basis, allowing easy comparisons between the same sector companies and the overall market.
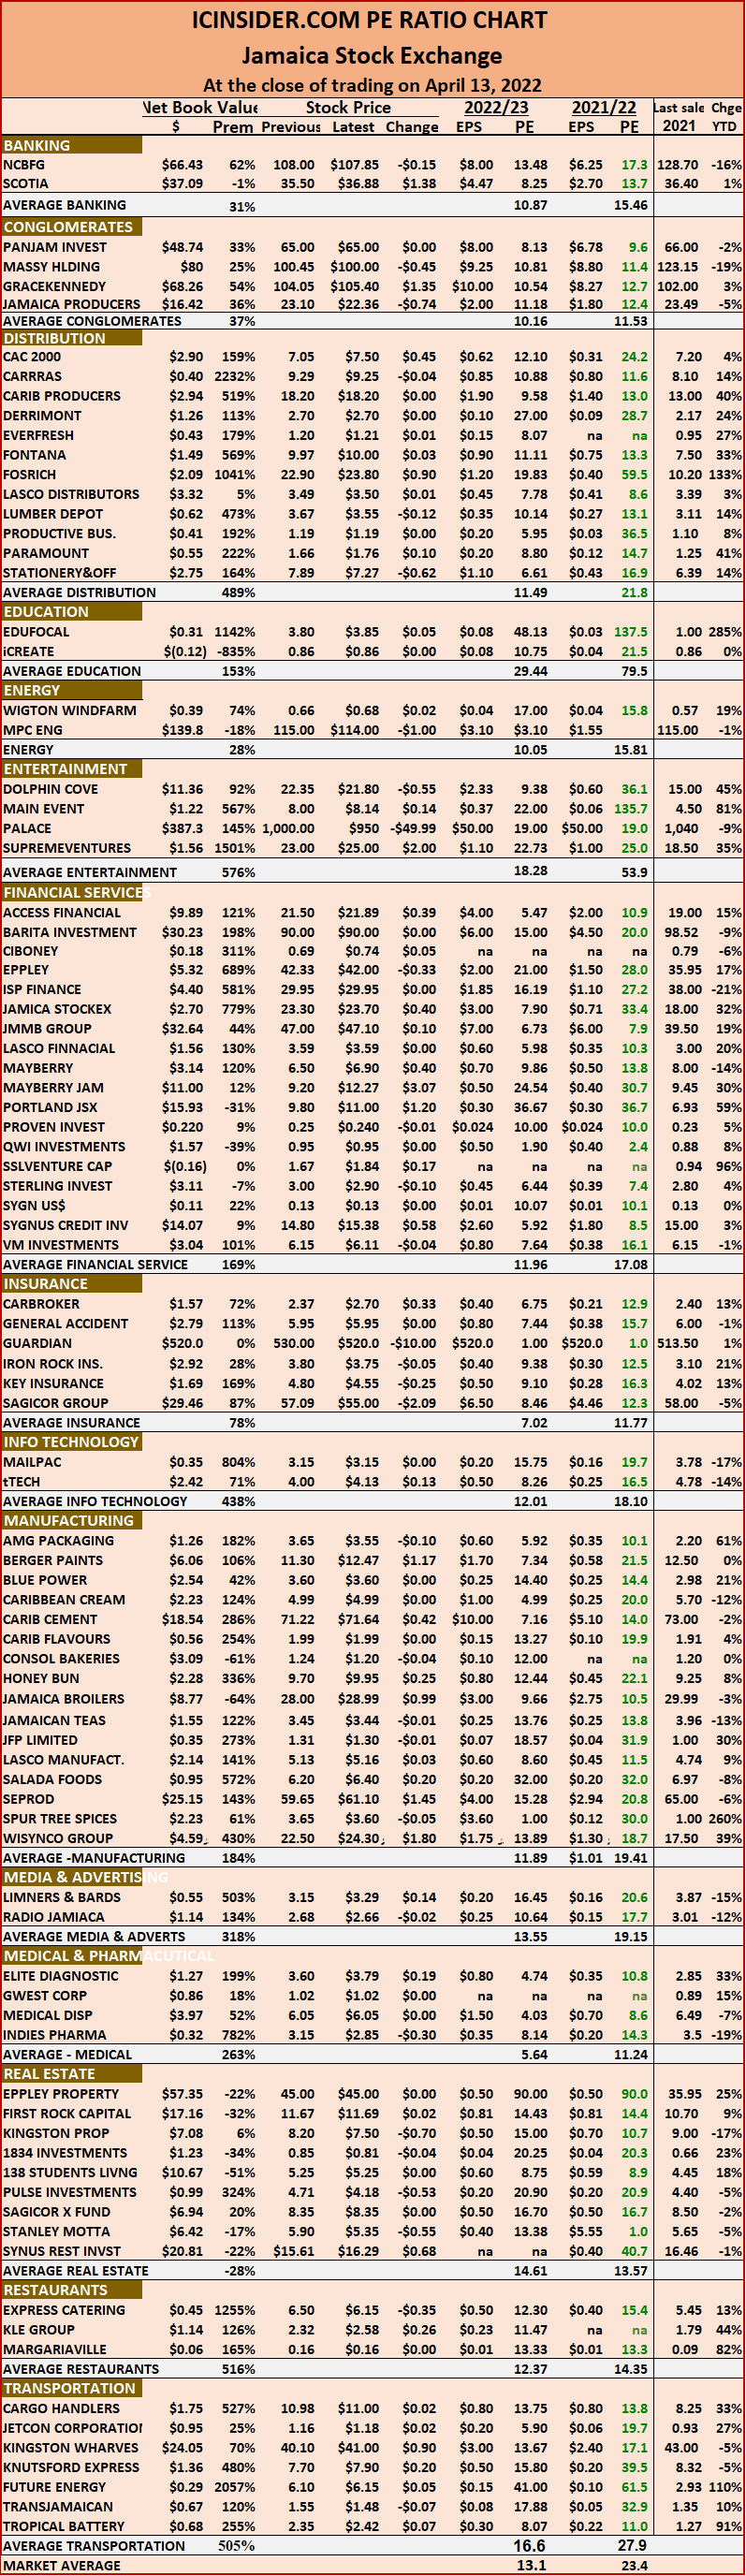 The ICInsider.com PE Ratio chart covers all ordinary shares listed on the Jamaica Stock Exchange. It shows companies grouped on an industry basis, allowing easy comparisons between the same sector companies and the overall market.
 The ICInsider.com PE Ratio chart covers all ordinary shares listed on the Jamaica Stock Exchange. It shows companies grouped on an industry basis, allowing easy comparisons between the same sector companies and the overall market.
 The ICInsider.com PE Ratio chart covers all ordinary shares listed on the Jamaica Stock Exchange. It shows companies grouped on an industry basis, allowing easy comparisons between the same sector companies and the overall market.
 The ICInsider.com PE Ratio chart covers all ordinary shares listed on the Jamaica Stock Exchange. It shows companies grouped on an industry basis, allowing easy comparisons between the same sector companies and the overall market.
 The ICInsider.com PE Ratio chart covers all ordinary shares listed on the Jamaica Stock Exchange. It shows companies grouped on an industry basis, allowing easy comparisons between the same sector companies and the overall market.