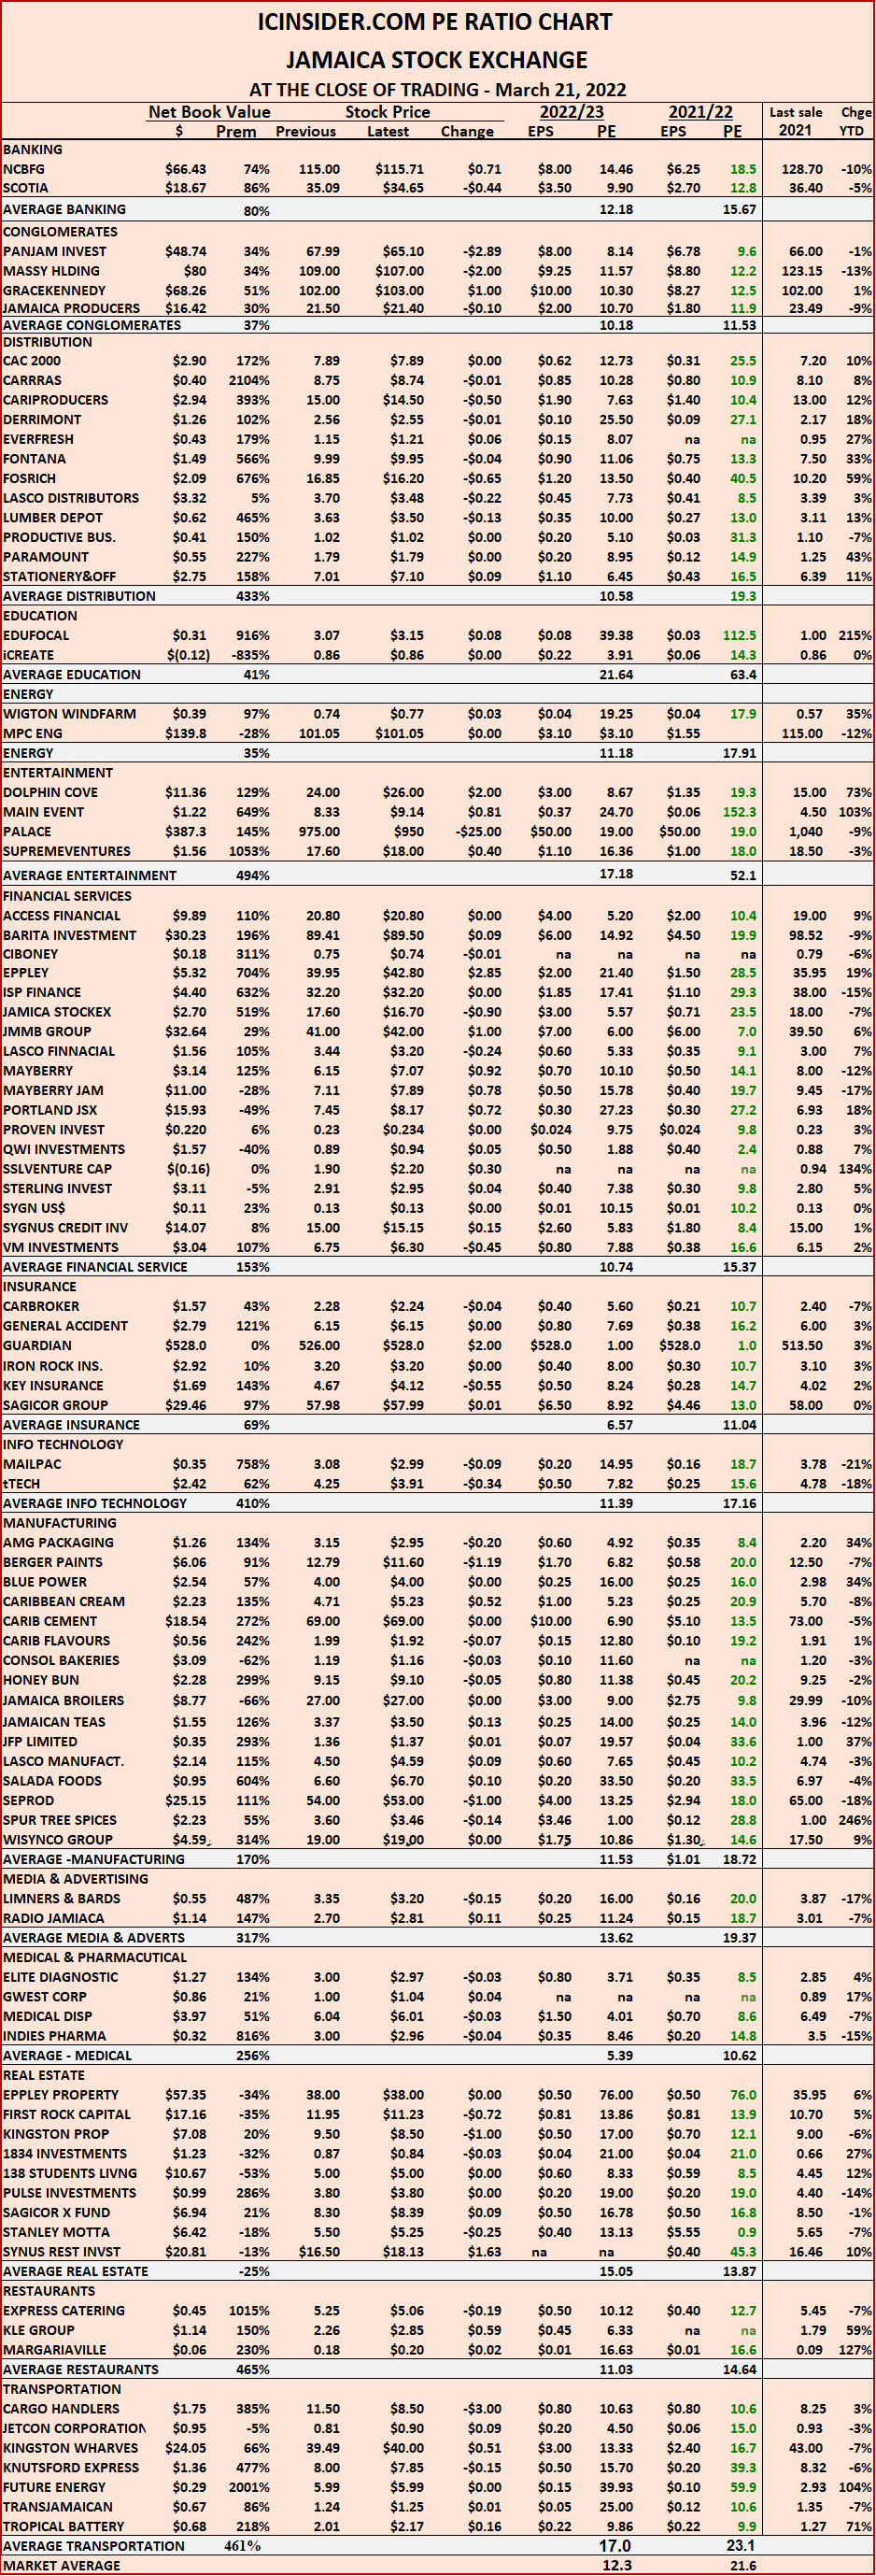
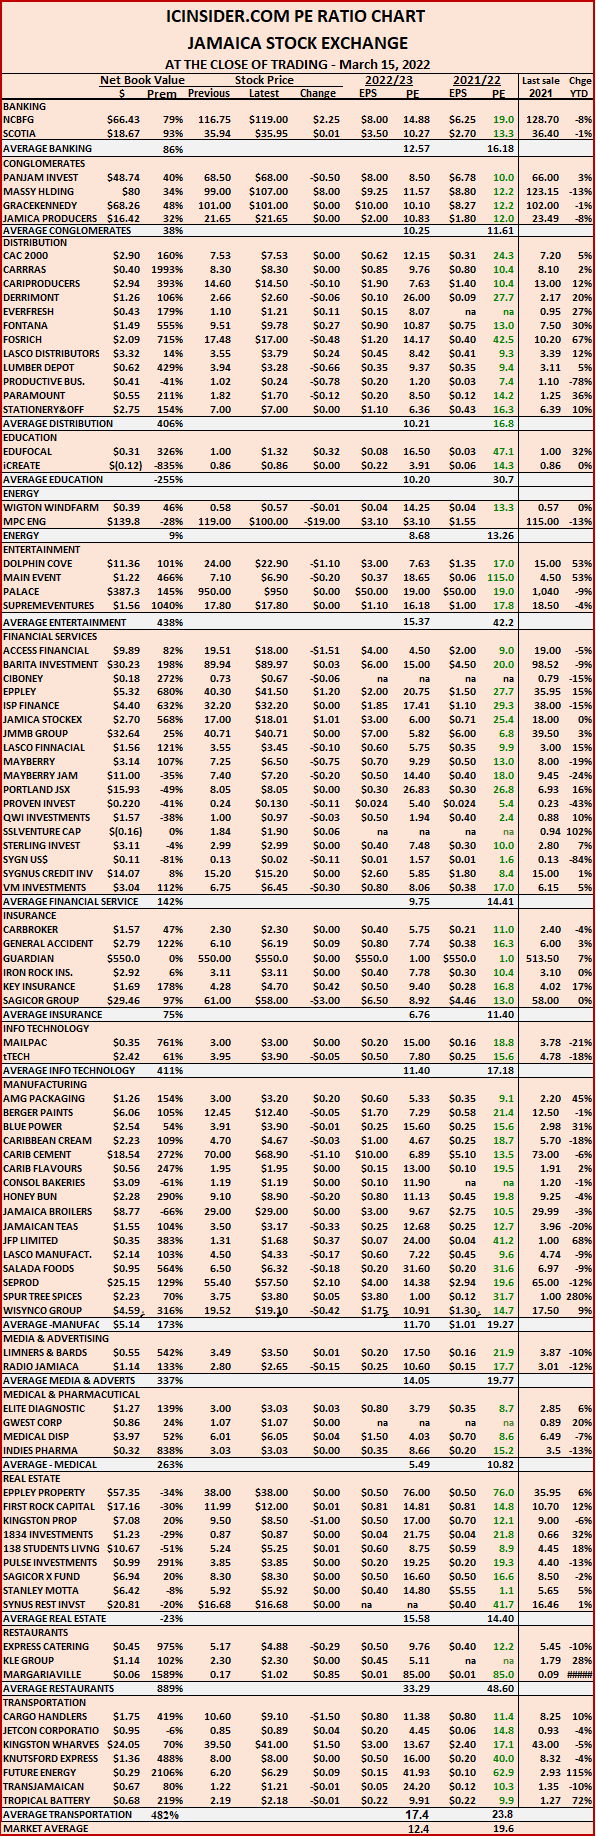
Since listing on the Junior Market on Tuesday last week, EduFocal jumped 306 percent from the IPO price of $1as it hit an all-time high of $4.06 on Monday and ran out of steam with nearly 30 million units traded valued more than $1.6 million, with the price pulling back to $3.15 at the close.
At the close of trading, the Combined Index jumped 2,519.74 points to 398,338.57, the All Jamaican Composite Index surged 5,036.59 points to end at 434,295.40 and the JSE Main Index rose 3,059.12 points to end at 387,410.06 and the Junior Market Index dropped 38.77 points to close at 4013.42.
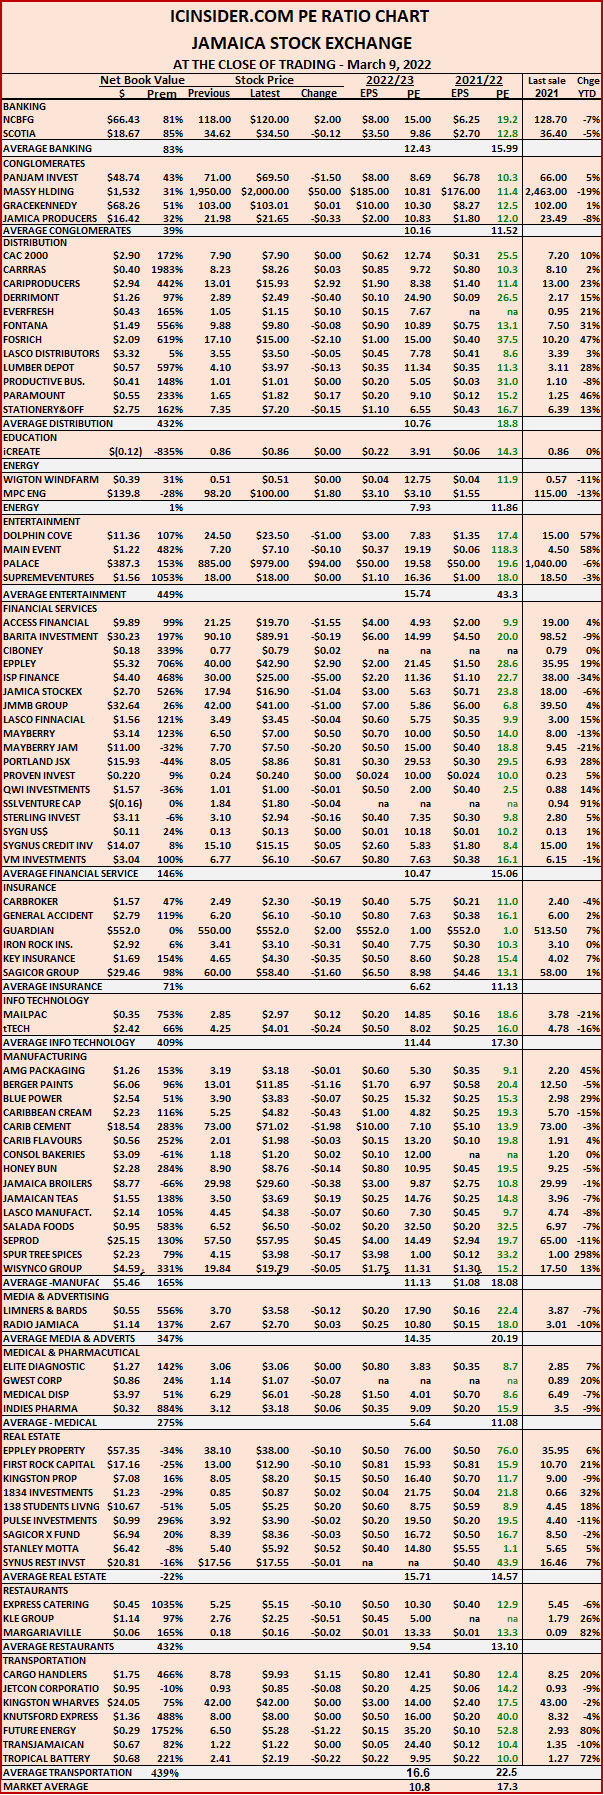
The market’s PE ratio ended at 21.6 based on 2021-22 earnings and 12.3 times those for 2022-23 at the close of the Jamaica Stock Exchange.
Investors need a series of measures and pertinent information to successfully navigate the many investment choices in the local stock market. The ICInsider.com PE ratio chart and the more detailed daily report charts provide investors with regularly updated information to help with decision-making.
 Investors should make use of the chart to help make rational investment decisions by investing in stocks that are close to the average for the sector and not going too far from it unless there are compelling reasons to do so. This approach helps to take emotions out of the investment decision and put in on fundamentals while at the same time not being too far from the majority of investors. Investors who buy when the price of a stock is close to the average will find that they are not inclined to overpay for a stock.
The ICInsider.com PE Ratio chart covers all ordinary shares listed on the Jamaica Stock Exchange. It shows companies grouped on an industry basis, allowing easy comparisons between the same sector companies and the overall market.
The net asset value of each company is reported as a guide to assess the value of stocks based on this measure quickly. The chart also shows daily changes in stock prices and the percentage year to date price movement based on the last traded prices. Dividends payable and yields for each company are shown in the Main and Junior Markets’ daily report charts that show closing volume for the bids and offers.
The EPS & PE ratios are based on 2021 and 2022 actual or projected earnings, excluding major one off items. The PE Ratio is the most popular measure used to determine the value of stocks.
EduFocal rally runs out of steam
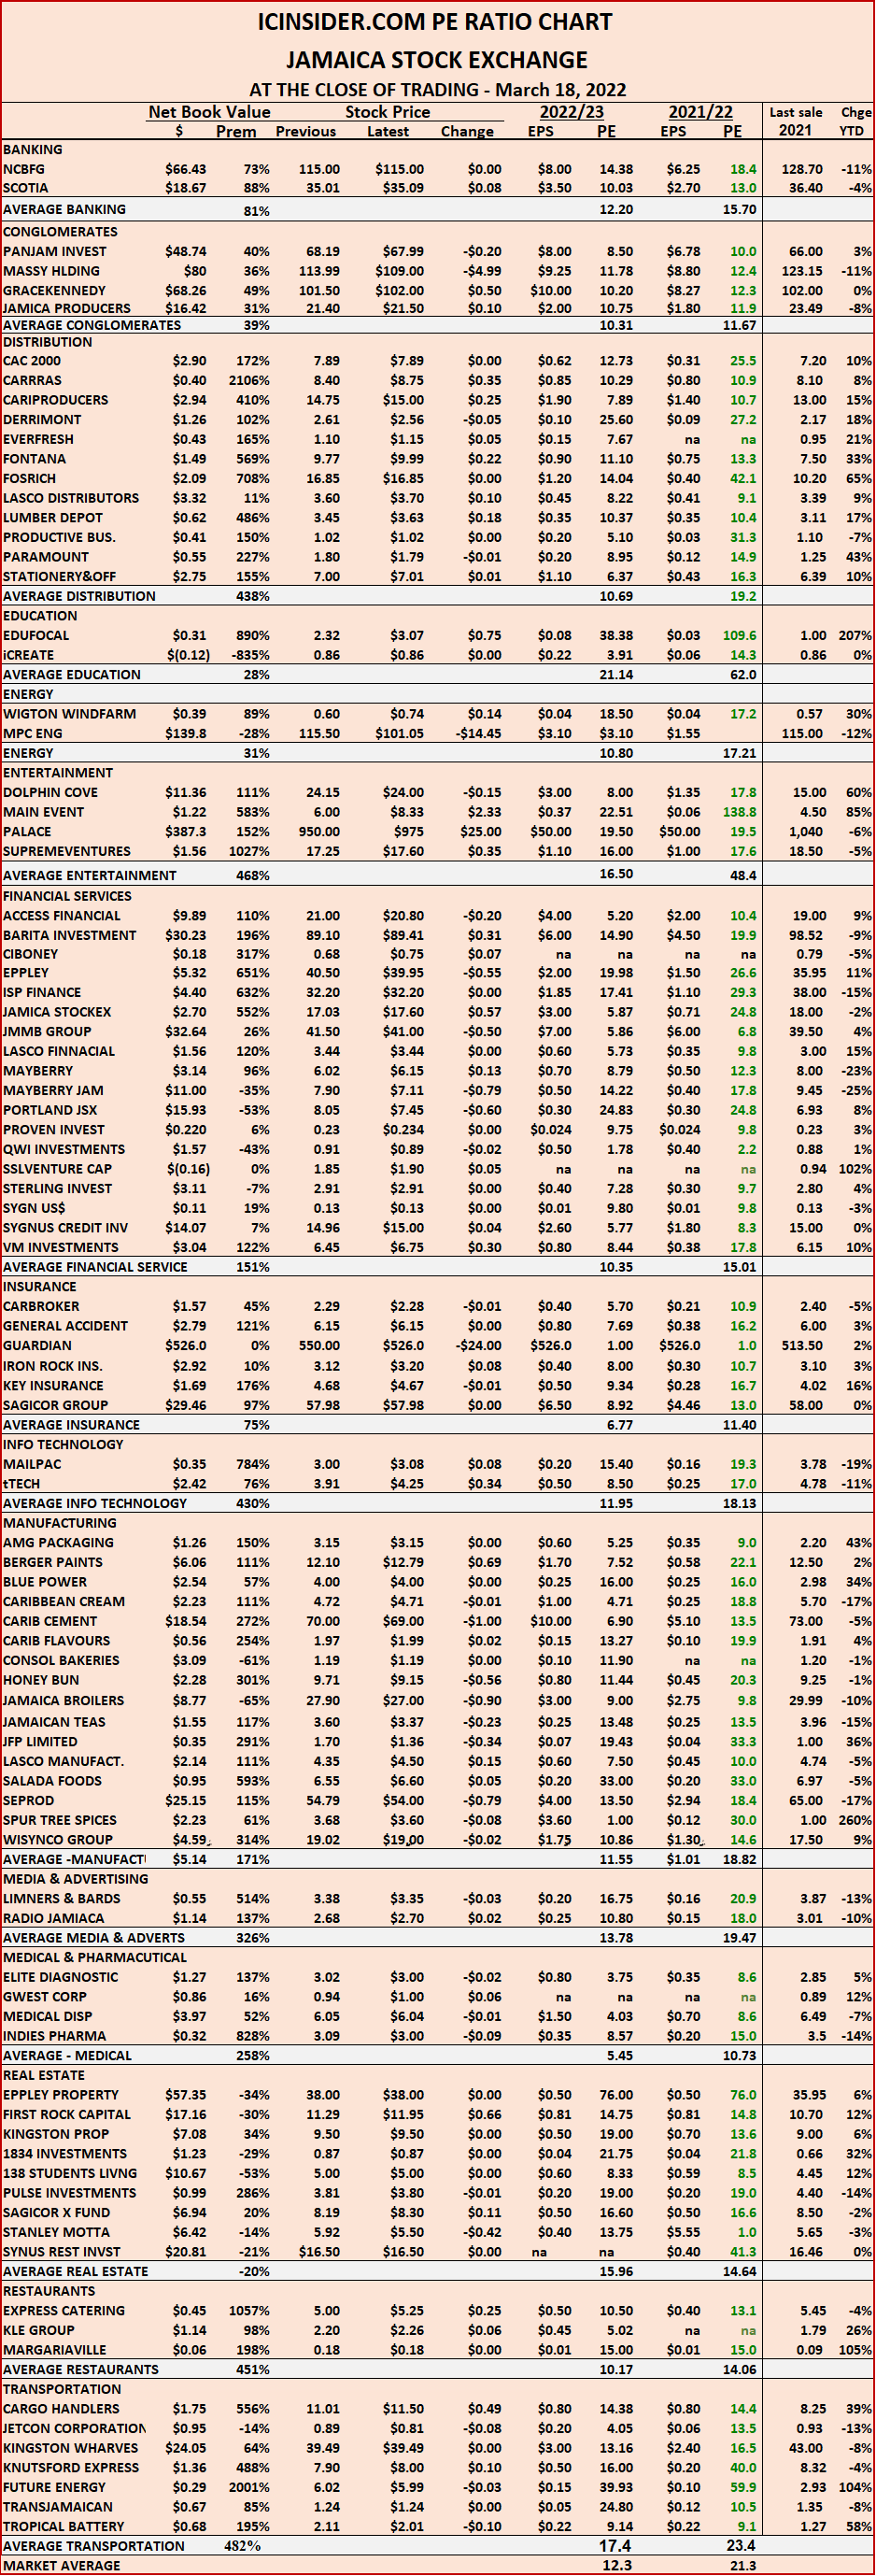
EduFocal gains 207% in a week
Since listing on the Junior Market on Tuesday EduFocal is up 207 percent from the IPO price in early March, with demand at more than 18 million shares at $3 and above at the close of the market on Friday after gaining 75 cents for the day and helping to move the Junior Market Index jumped 76.48 points to settle at 4052.19, at the same time the Combined Index jumped 2,195.90 points to 395,818.83, the All Jamaican Composite Index gained 1,319.00 points to end at 429,258.81 and the JSE Main Index rose 1,620.15 points to end at 384,350.94,
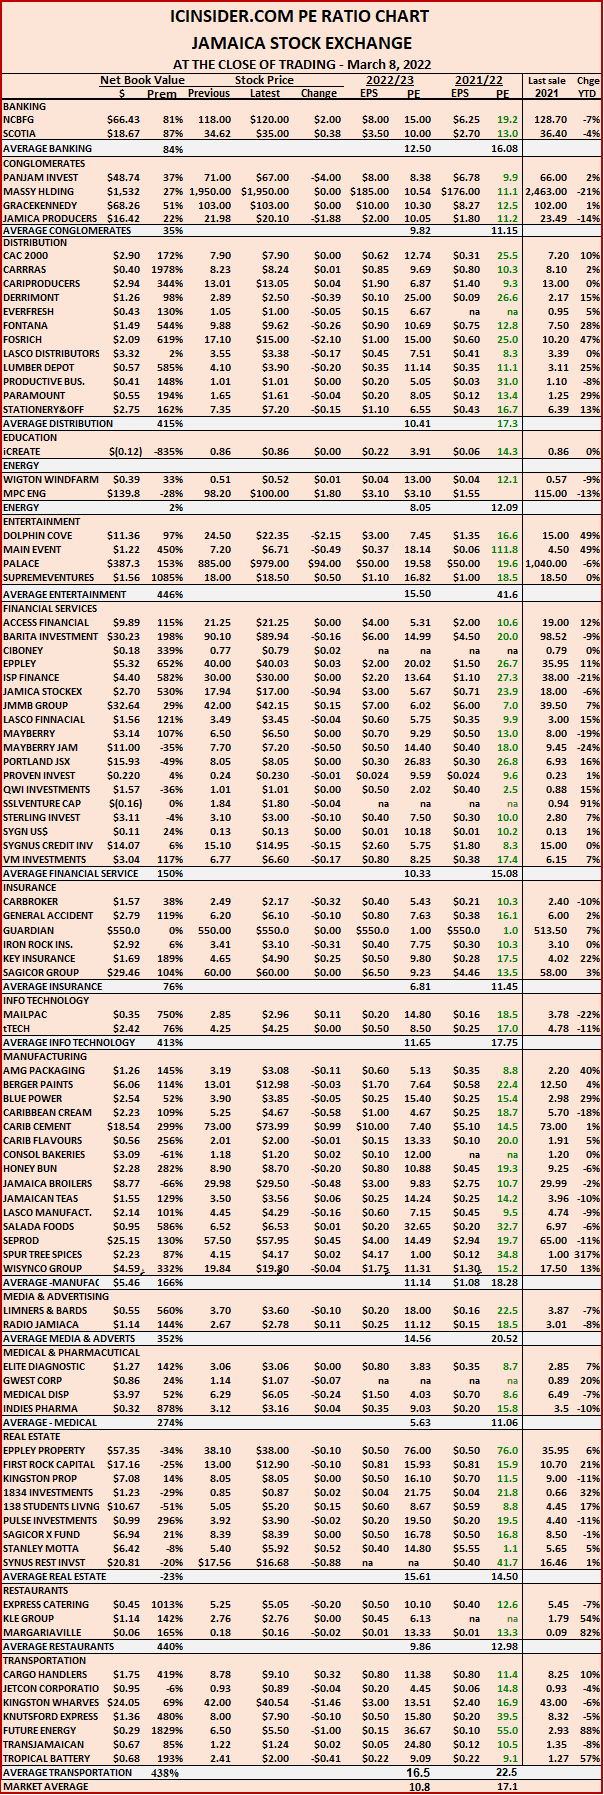
The market’s PE ratio ended at 21.3 based on 2021-22 earnings and 12.3 times those for 2022-23 at the close of the Jamaica Stock Exchange.
Investors need a series of measures and pertinent information to successfully navigate the many investment choices in the local stock market. The ICInsider.com PE ratio chart along with the more detailed daily report charts, provide investors with regularly updated information to help with decision making.
Investors should make use of the chart to help make rational investment decisions, by investing in stocks that are close to the average for the sector and not going too far from it, unless there are compelling reasons to do so. Investors who buy when the price of a stock is close to the average will find that they are not inclined to overpay for a stock. This approach helps to take emotions out of the investment decision and put in on fundamentals while at the same time not being too far from the majority of investors.
 The ICInsider.com PE Ratio chart covers all ordinary shares listed on the Jamaica Stock Exchange and shows companies grouped on an industry basis, allowing for easy comparisons between same sector companies as well as the overall market.
The net asset value of each company is reported as a guide to easily assess the value of stocks based on this measure. The chart also shows daily changes in stock prices and the percentage year to date price movement based on the last traded prices. Dividends payable and yields for each company are shown in the Main and Junior Markets’ daily report charts that show closing volume for the bids and offers.
The EPS & PE ratios are based on 2021 and 2022 actual or projected earnings, excluding major one-off items. The PE Ratio is the most popular measure used to determine the value of stocks.
NCB dropped to a low of $90
In Thursday trading, NCB Financial dropped to a 52 weeks’ intraday low of $90 before bouncing within minutes of the close to trading at $115 but the stock has only 14 bids to buy with most under $100 and an indication of the stock’s weakness. The fall in NCB helped in pushing the Main Market of the Jamaica Stock Exchange down, with the Combined Index dropping 2,719.24 points to 393,622.90, the All Jamaican Composite Index dived 4,466.69 points to 427,939.8, the JSE Main Index tumbled 2,641.22 points to end at 382,730.79, while the Junior Market Index declined 27.76 points to settle at 3,975.71.
The market’s PE ratio ended at 19.5 based on 2021-22 earnings and 11.8 times those for 2022-23 at the close of the Jamaica Stock Exchange.
Investors need a series of measures and pertinent information to successfully navigate the many investment choices in the local stock market. The ICInsider.com PE ratio chart along with the more detailed daily report charts, provide investors with regularly updated information to help with decision making.
Investors should make use of the chart to help make rational investment decisions, by investing in stocks that are close to the average for the sector and not going too far from it, unless there are compelling reasons to do so. 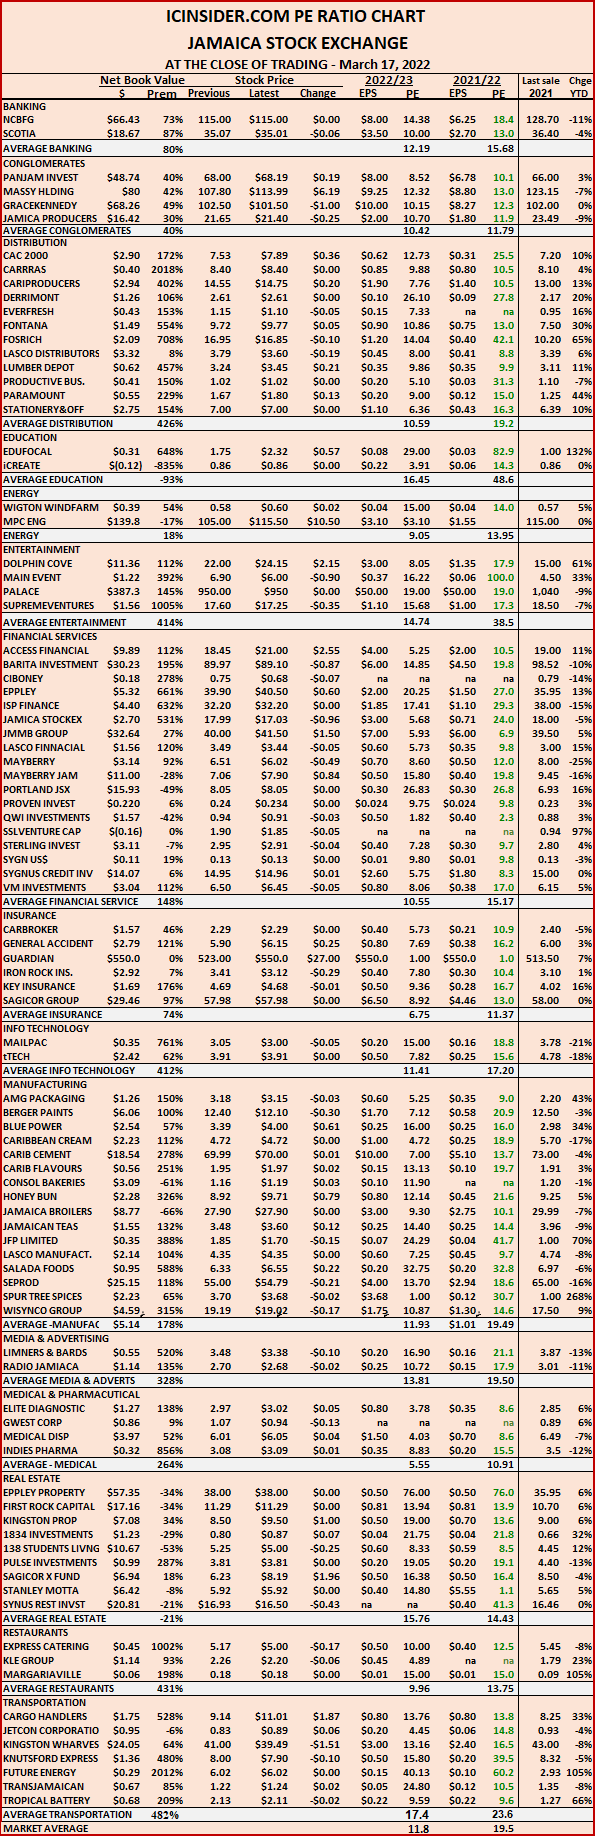 Investors who buy when the price of a stock is close to the average will find that they are not inclined to overpay for a stock. This approach helps to take emotions out of the investment decision and put in on fundamentals while at the same time not being too far from the majority of investors.
The ICInsider.com PE Ratio chart covers all ordinary shares listed on the Jamaica Stock Exchange and shows companies grouped on an industry basis, allowing for easy comparisons between same sector companies as well as the overall market.
The net asset value of each company is reported as a guide to easily assess the value of stocks based on this measure. The chart also shows daily changes in stock prices and the percentage year to date price movement based on the last traded prices. Dividends payable and yields for each company are shown in the Main and Junior Markets’ daily report charts that show closing volume for the bids and offers.
The EPS & PE ratios are based on 2021 and 2022 actual or projected earnings, excluding major one off items. The PE Ratio is the most popular measure used to determine the value of stocks.
New listing enriching investors
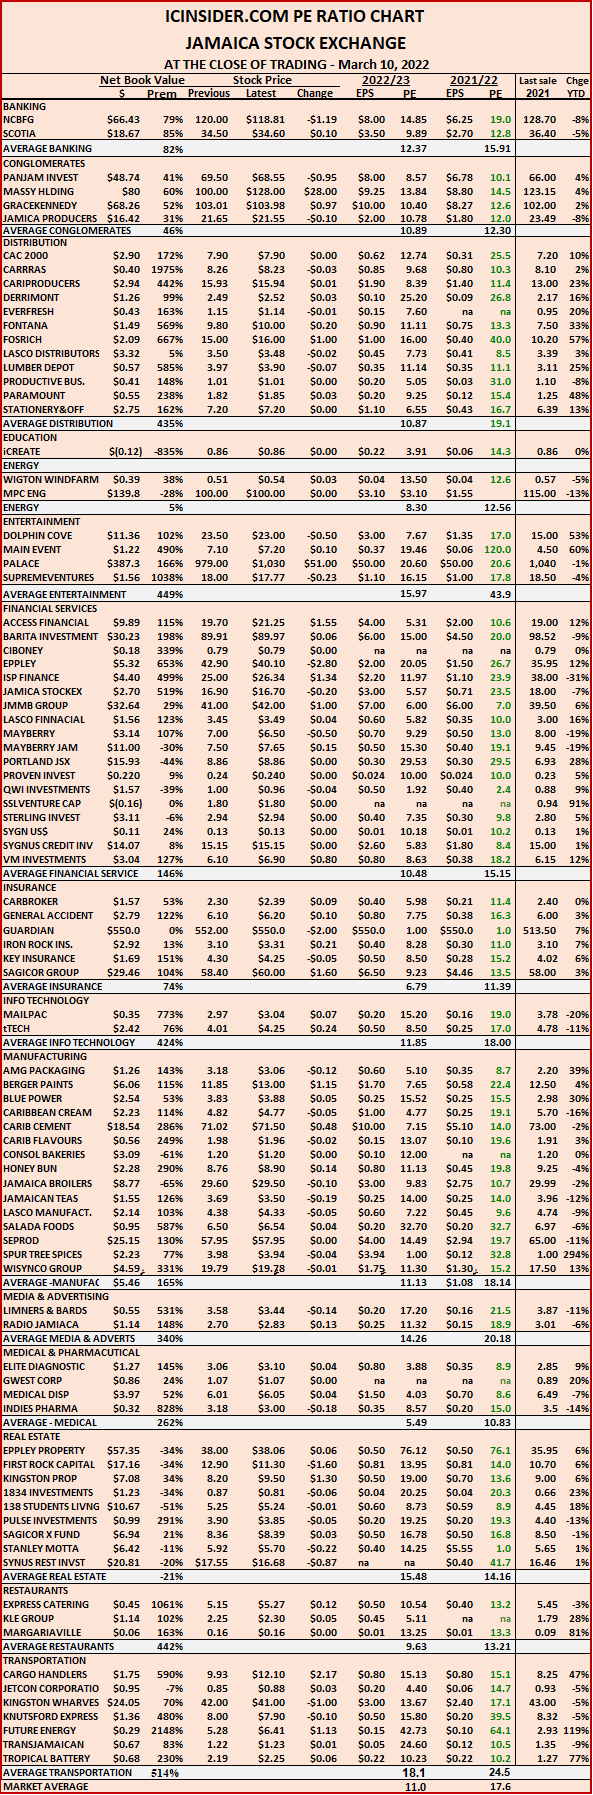
In Wednesday’s trading on the Jamaica Stock Exchange, this week’s listed EduFocal climbed to $1.75 and JFP climbed to $1.85, after trading as high as $1.90, with both helping the Junior Market Index to rise 8.03 points to settle at 4,003.47 at the close.
The Combined Index dropped 1,013.51 points to 396,342.20 the All Jamaican Composite Index lost 1,779.45 points to settle at 432,406.50, the JSE Main Index dipped 1,158.80 points to end at 385,372.01.
The market’s PE ratio ended at 19 based on 2021-22 earnings and 11.7 times those for 2022-23 at the close of the Jamaica Stock Exchange.
Investors need a series of measures and pertinent information to successfully navigate the many investment choices in the local stock market. The ICInsider.com PE ratio chart along with the more detailed daily report charts, provide investors with regularly updated information to help with decision making.
Investors should make use of the chart to help make rational investment decisions, by investing in stocks that are close to the average for the sector and not going too far from it, unless there are compelling reasons to do so. 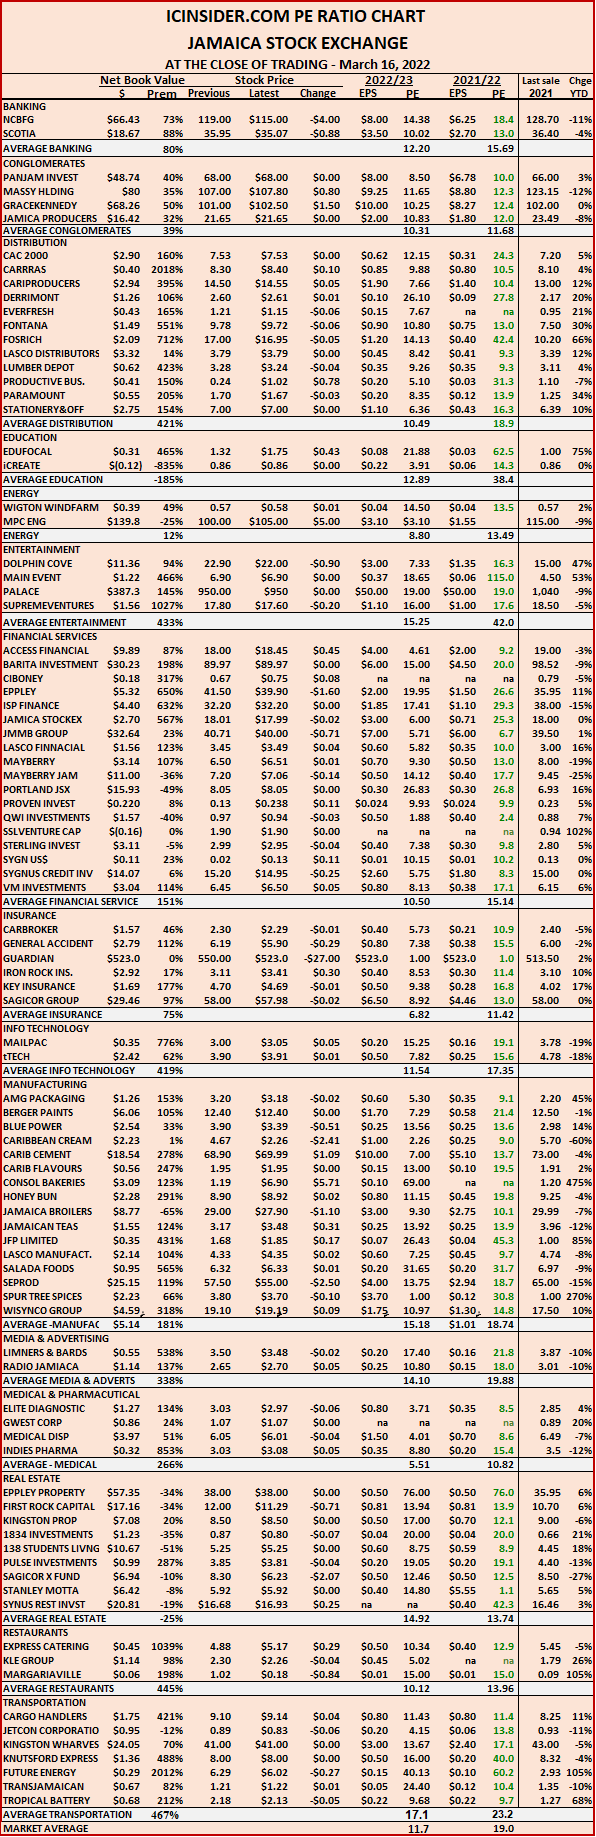 Investors who buy when the price of a stock is close to the average will find that they are not inclined to overpay for a stock. This approach helps to take emotions out of the investment decision and put in on fundamentals while at the same time not being too far from the majority of investors.
The ICInsider.com PE Ratio chart covers all ordinary shares listed on the Jamaica Stock Exchange and shows companies grouped on an industry basis, allowing for easy comparisons between same sector companies as well as the overall market.
The net asset value of each company is reported as a guide to easily assess the value of stocks based on this measure. The chart also shows daily changes in stock prices and the percentage year to date price movement based on the last traded prices. Dividends payable and yields for each company are shown in the Main and Junior Markets’ daily report charts that show closing volume for the bids and offers.
The EPS & PE ratios are based on 2021 and 2022 actual or projected earnings, excluding major one off items. The PE Ratio is the most popular measure used to determine the value of stocks.
Edufocal jumps 31% on first day trading on Junior Market
Shares of EduFocal were listed on the Jamaica Stock Exchange on Tuesday following the recent initial public offer of shares following the listing of JFP Limited on Monday. Edufocal hit the maximum of $1.32 for the day with a small number of shares trading, with nearly 33 million on the bid at the close, while JFP climbed to $1.68, up 68 percent from the IPO price of $1.
The Combined Index dived 3,528.93 points to 397,355.68, the All Jamaican Composite Index declined 4,236.02 points to 434,185.95, the JSE Main Index dropped 3,408.49 points to end at 386,530.80 while the Junior Market Index dropped 38.05 points to settle at 3,995.43.
The market’s PE ratio ended at 20.7 based on 2021-22 earnings and 12.8 times those for 2022-23 at the close of the Jamaica Stock Exchange.
Investors need a series of measures and pertinent information to successfully navigate the many investment choices in the local stock market. The ICInsider.com PE ratio chart along with the more detailed daily report charts, provide investors with regularly updated information to help with decision making.
 Investors should make use of the chart to help make rational investment decisions, by investing in stocks that are close to the average for the sector and not going too far from it, unless there are compelling reasons to do so. Investors who buy when the price of a stock is close to the average will find that they are not inclined to overpay for a stock. This approach helps to take emotions out of the investment decision and put in on fundamentals while at the same time not being too far from the majority of investors.
The ICInsider.com PE Ratio chart covers all ordinary shares listed on the Jamaica Stock Exchange and shows companies grouped on an industry basis, allowing for easy comparisons between same sector companies as well as the overall market.
The net asset value of each company is reported as a guide to easily assess the value of stocks based on this measure. The chart also shows daily changes in stock prices and the percentage year to date price movement based on the last traded prices. Dividends payable and yields for each company are shown in the Main and Junior Markets’ daily report charts that show closing volume for the bids and offers.
The EPS & PE ratios are based on 2021 and 2022 actual or projected earnings, excluding major one off items. The PE Ratio is the most popular measure used to determine the value of stocks.
JFP jumps 31% Massy drags down JSE Index
The recent initial publicly offered stock, JFP Limited listed on the Jamaica Stock Exchange on Monday and closed 31 percent higher than the issue price of $1, but the move up was just barely able to keep the junior market from falling at the close, with the Combined Index diving 10,223.74 points to 400,884.61 after Massy Holdings dropped in price.
The All Jamaican Composite Index declined a more moderate 1,713.39 points to settle at 438,421.97, JSE Main Index dropped 10,931.95 points to 389,939.30, while the Junior Market Index added just 2.59 points to end the week at 4032.48, after rising to 4,109 points shortly after the market opened.
The market’s PE ratio ended at 17.6 based on 2021-22 earnings and 11 times those for 2022-23 at the close of the Jamaica Stock Exchange.
Investors need a series of measures and pertinent information to successfully navigate the many investment choices in the local stock market. The ICInsider.com PE ratio chart along with the more detailed daily report charts, provide investors with regularly updated information to help with decision making.
Investors should make use of the chart to help make rational investment decisions, by investing in stocks that are close to the average for the sector and not going too far from it, unless there are compelling reasons to do so. 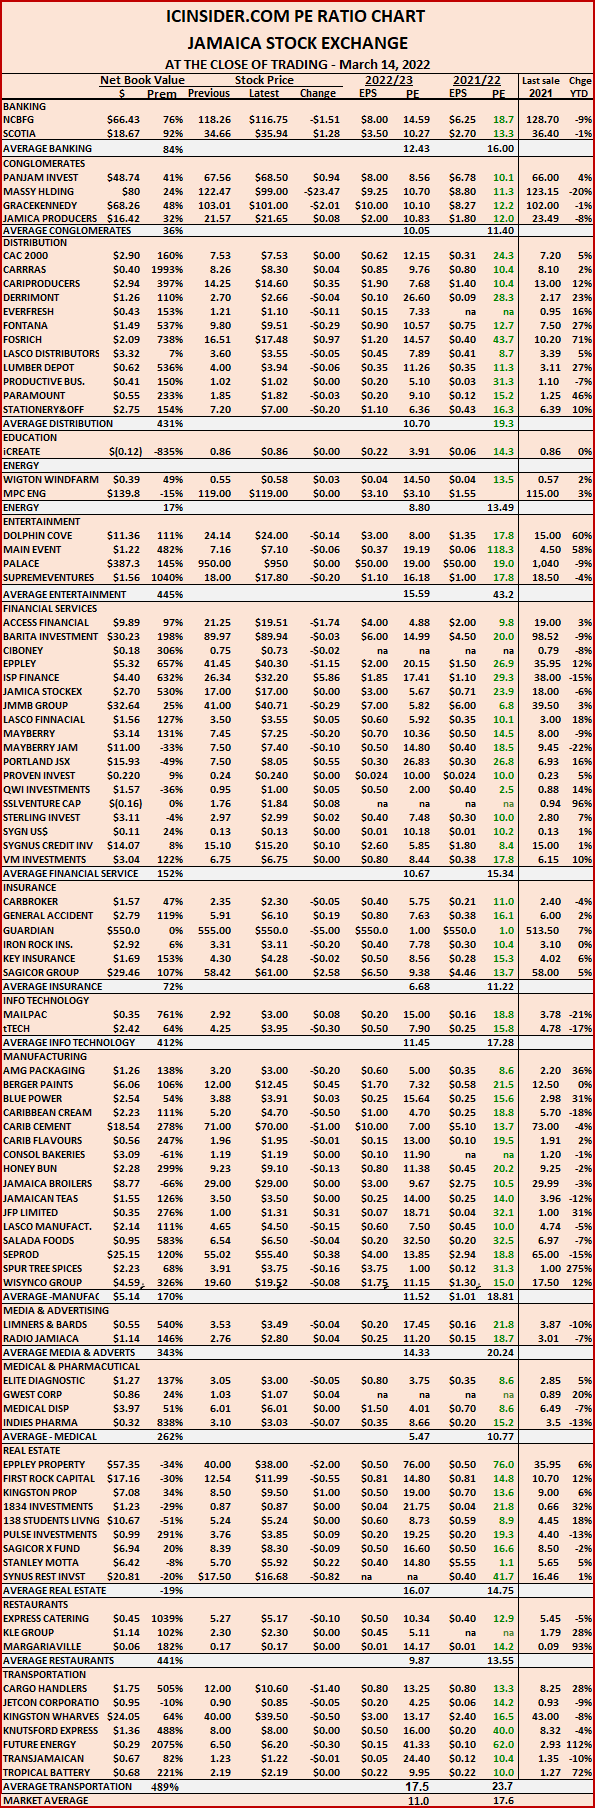 Investors who buy when the price of a stock is close to the average will find that they are not inclined to overpay for a stock. This approach helps to take emotions out of the investment decision and put in on fundamentals while at the same time not being too far from the majority of investors.
The ICInsider.com PE Ratio chart covers all ordinary shares listed on the Jamaica Stock Exchange and shows companies grouped on an industry basis, allowing for easy comparisons between same sector companies as well as the overall market.
The net asset value of each company is reported as a guide to easily assess the value of stocks based on this measure. The chart also shows daily changes in stock prices and the percentage year to date price movement based on the last traded prices. Dividends payable and yields for each company are shown in the Main and Junior Markets’ daily report charts that show closing volume for the bids and offers.
The EPS & PE ratios are based on 2021 and 2022 actual or projected earnings, excluding major one off items. The PE Ratio is the most popular measure used to determine the value of stocks.
Bounce for Jamaica Stock Exchange
The Jamaica Stock Exchange made headway at the close on Friday, with the JSE Main Index adding 876.40 points to settle at 400,871.3 and the Combined Index gaining 1618.02 points to 411,108.40, but the All Jamaican Composite Index declined 2,112.90 points to settle at 440,135.36, while the Junior Market made great strides in the past two days with the market Index adding another 90.51 points on Friday following Thursday’s 70.26 points rise to end the week at 4031.89.
The market’s PE ratio ended at 17.6 based on 2021-22 earnings and 11 times those for 2022-23 at the close of the Jamaica Stock Exchange.
Investors need a series of measures and pertinent information to successfully navigate the many investment choices in the local stock market. The ICInsider.com PE ratio chart along with the more detailed daily report charts, provide investors with regularly updated information to help with decision making.
Investors should make use of the chart to help make rational investment decisions, by investing in stocks that are close to the average for the sector and not going too far from it, unless there are compelling reasons to do so. 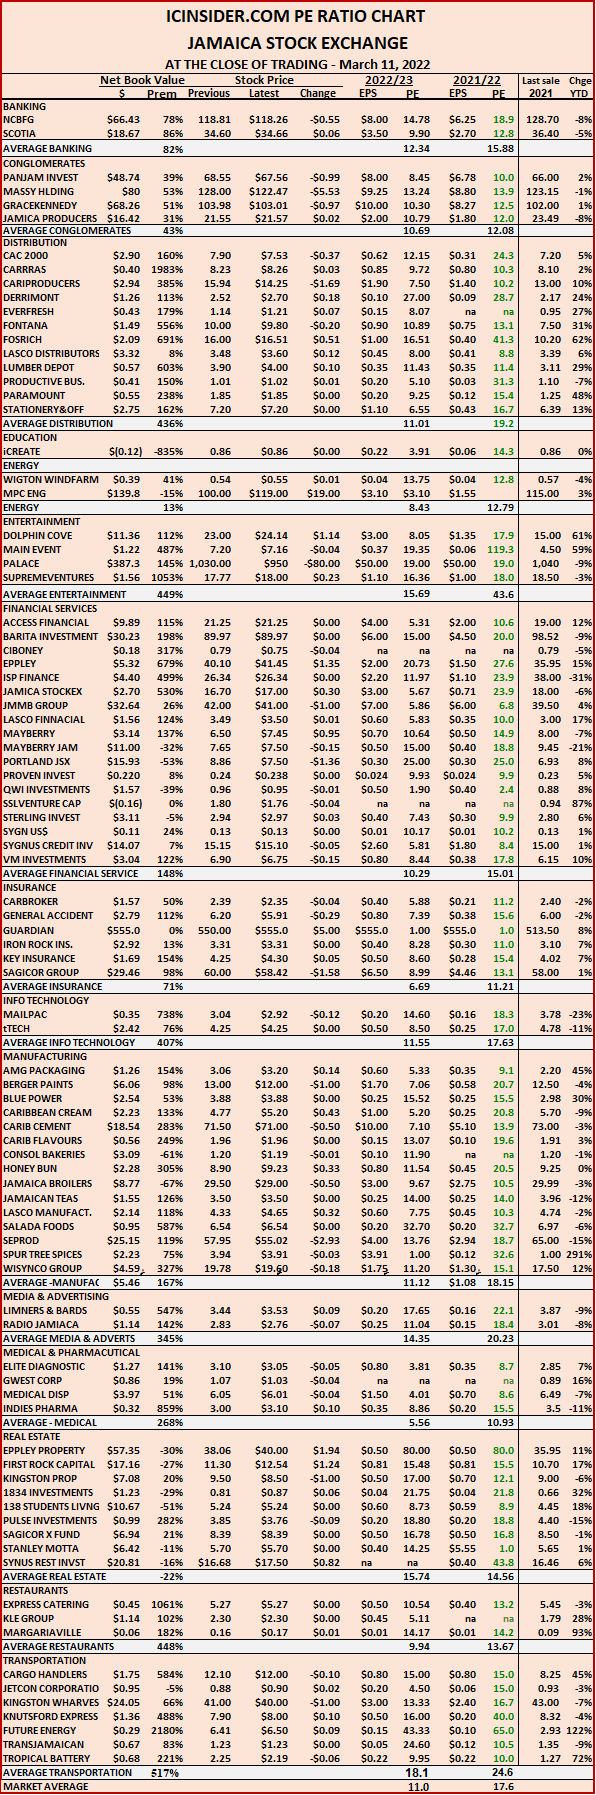 Investors who buy when the price of a stock is close to the average will find that they are not inclined to overpay for a stock. This approach helps to take emotions out of the investment decision and put in on fundamentals while at the same time not being too far from the majority of investors.
The ICInsider.com PE Ratio chart covers all ordinary shares listed on the Jamaica Stock Exchange and shows companies grouped on an industry basis, allowing for easy comparisons between same sector companies as well as the overall market.
The net asset value of each company is reported as a guide to easily assess the value of stocks based on this measure. The chart also shows daily changes in stock prices and the percentage year to date price movement based on the last traded prices. Dividends payable and yields for each company are shown in the Main and Junior Markets’ daily report charts that show closing volume for the bids and offers.
The EPS & PE ratios are based on 2021 and 2022 actual or projected earnings, excluding major one off items. The PE Ratio is the most popular measure used to determine the value of stocks.
Massy pushes JSE Main Index sharply higher
The Jamaica Stock Exchange got a huge bolt in trading on Thursday, with the JSE Main Index adding 11,265.05 points to settle at 399,994.85 after Massy Holdings stock jumped$28 to $128 following the 20 for one stock split. The Combined Index gained 11,173.78 points to 409,490.33, the All Jamaican Composite Index rallied 1,744.16 points to 442,248.26 and The Junior Market almost reversed Wednesday’s 76 points loss by adding 70.26 points on Thursday to end at 3941.38.
![]() The market’s PE ratio ended at 17.6 based on 2021-22 earnings and 11 times those for 2022-23 at the close of the Jamaica Stock Exchange market activity.
The market’s PE ratio ended at 17.6 based on 2021-22 earnings and 11 times those for 2022-23 at the close of the Jamaica Stock Exchange market activity.
Investors need a series of measures and pertinent information to successfully navigate the many investment choices in the local stock market. The ICInsider.com PE ratio chart along with the more detailed daily report charts, provide investors with regularly updated information to help with decision making.
Investors should make use of the chart to help make rational investment decisions, by investing in stocks that are close to the average for the sector and not going too far from it, unless there are compelling reasons to do so. Investors who buy when the price of a stock is close to the average will find that they are not inclined to overpay for a stock. This approach helps to take emotions out of the investment decision and put in on fundamentals while at the same time not being too far from the majority of investors.
The ICInsider.com PE Ratio chart covers all ordinary shares listed on the Jamaica Stock Exchange and shows companies grouped on an industry basis, allowing for easy comparisons between same sector companies as well as the overall market.
 The net asset value of each company is reported as a guide to easily assess the value of stocks based on this measure. The chart also shows daily changes in stock prices and the percentage year to date price movement based on the last traded prices. Dividends payable and yields for each company are shown in the Main and Junior Markets’ daily report charts that show closing volume for the bids and offers.
The EPS & PE ratios are based on 2021 and 2022 actual or projected earnings, excluding major one off items. The PE Ratio is the most popular measure used to determine the value of stocks.
Jamaica Stock Exchange markets drop
The Jamaica Stock Exchange suffered all round losses on Wednesday, with the Junior Market dropping another 71 points to end at 3,871.12 coming from a record high of 4,185.95 points last Friday.
Jamaica Stock Exchange Main Market index slipped, with the Combined Index falling 1,434.66 points to 398,316.55, the All Jamaican Composite Index declined 1,032.87 points to 440,504 and the JSE Main Index fell 817.05 points to settle at 388,729.80.
The market’s PE ratio ended at 17.3 based on 2021-22 earnings and 10.8 times those for 2022-23 at the close of market activity on the Jamaica Stock Exchange.
Investors need a series of measures and pertinent information to successfully navigate the many investment choices in the local stock market. The ICInsider.com PE ratio chart along with the more detailed daily report charts, provide investors with regularly updated information to help with decision making.
 Investors should make use of the chart to help make rational investment decisions, by investing in stocks that are close to the average for the sector and not going too far from it, unless there are compelling reasons to do so. Investors who buy when the price of a stock is close to the average will find that they are not inclined to overpay for a stock. This approach helps to take emotions out of the investment decision and put in on fundamentals while at the same time not being too far from the majority of investors.
The ICInsider.com PE Ratio chart covers all ordinary shares listed on the Jamaica Stock Exchange and shows companies grouped on an industry basis, allowing for easy comparisons between same sector companies as well as the overall market.
The net asset value of each company is reported as a guide to easily assess the value of stocks based on this measure. The chart also shows daily changes in stock prices and the percentage year to date price movement based on the last traded prices. Dividends payable and yields for each company are shown in the Main and Junior Markets’ daily report charts that show closing volume for the bids and offers.
The EPS & PE ratios are based on 2021 and 2022 actual or projected earnings, excluding major one off items. The PE Ratio is the most popular measure used to determine the value of stocks.
Junior Market plunges 221 points in 2 days
Several stocks in the Junior Market that reached astronomical levels last week suffered a sharp reversal with the market index dropping 129.55 points on Monday followed by 91.49 points and Tuesday to settle at 3,947.12 as some of the recent highflying stocks suffered sharp retreat.
Jamaica Stock Exchange Main Market stocks maintained their consolidation posture. The Combined Index rose 652.77 points to 399,751.21, the All Jamaican Composite Index popped 814.75 points to 441,536.97 the JSE Main Index rallied 1,556.37 points to settle at 389,546.85
The market’s PE ratio ended at 17.1 based on 2021-22 earnings and 10.8 times those for 2022-23 at the close of market activity on the Jamaica Stock Exchange.
Investors need a series of measures and pertinent information to successfully navigate the many investment choices in the local stock market. The ICInsider.com PE ratio chart along with the more detailed daily report charts, provide investors with regularly updated information to help with decision making.
Investors should make use of the chart to help make rational investment decisions, by investing in stocks that are close to the average for the sector and not going too far from it, unless there are compelling reasons to do so. Investors who buy when the price of a stock is close to the average will find that they are not inclined to overpay for a stock. This approach helps to take emotions out of the investment decision and put in on fundamentals while at the same time not being too far from the majority of investors.
 The ICInsider.com PE Ratio chart covers all ordinary shares listed on the Jamaica Stock Exchange and shows companies grouped on an industry basis, allowing for easy comparisons between same sector companies as well as the overall market.
The net asset value of each company is reported as a guide to easily assess the value of stocks based on this measure. The chart also shows daily changes in stock prices and the percentage year to date price movement based on the last traded prices. Dividends payable and yields for each company are shown in the Main and Junior Markets’ daily report charts that show closing volume for the bids and offers.
The EPS & PE ratios are based on 2021 and 2022 actual or projected earnings, excluding major one off items. The PE Ratio is the most popular measure used to determine the value of stocks.


