Trading on the Jamaica Stock Exchange on Thursday ended with moderate changes to the market indices with the JSE Combined Index falling 1,703.57 points to 398.147.28.
 The All Jamaican Composite Index shed 2,384.19 points to 440,719.77, the JSE Main Index dipped 1,721.84 points to close at 386,428.37, the Junior Market index fell 10.30 points to 4,095.38 and the JSE USD market index slipped 1.51 points to close at 220.45.
Investors exchanged 26,698,445 shares in all markets, with the value of stocks traded in the Main and Junior Markets amounting to $224 million and in the JSE USD market, US$3,819.
The market’s PE ratio ended at 23.5 based on 2021-22 earnings and 12.9 times those for 2022-23 at the close of trading.
Investors need a series of measures and pertinent information to successfully navigate the many investment choices in the local stock market. The ICInsider.com PE ratio chart and the more detailed daily report charts provide investors with regularly updated information to help with decision-making.
Investors should use the chart to help make rational investment decisions by investing in stocks that are close to the average for the sector and not going too far from it unless there are compelling reasons to do so. This approach helps to take emotions out of the investment decision and put in on fundamentals while at the same time not being too far from the majority of investors. Investors who buy when the price of a stock is close to the average will find that they are not inclined to overpay for a stock.
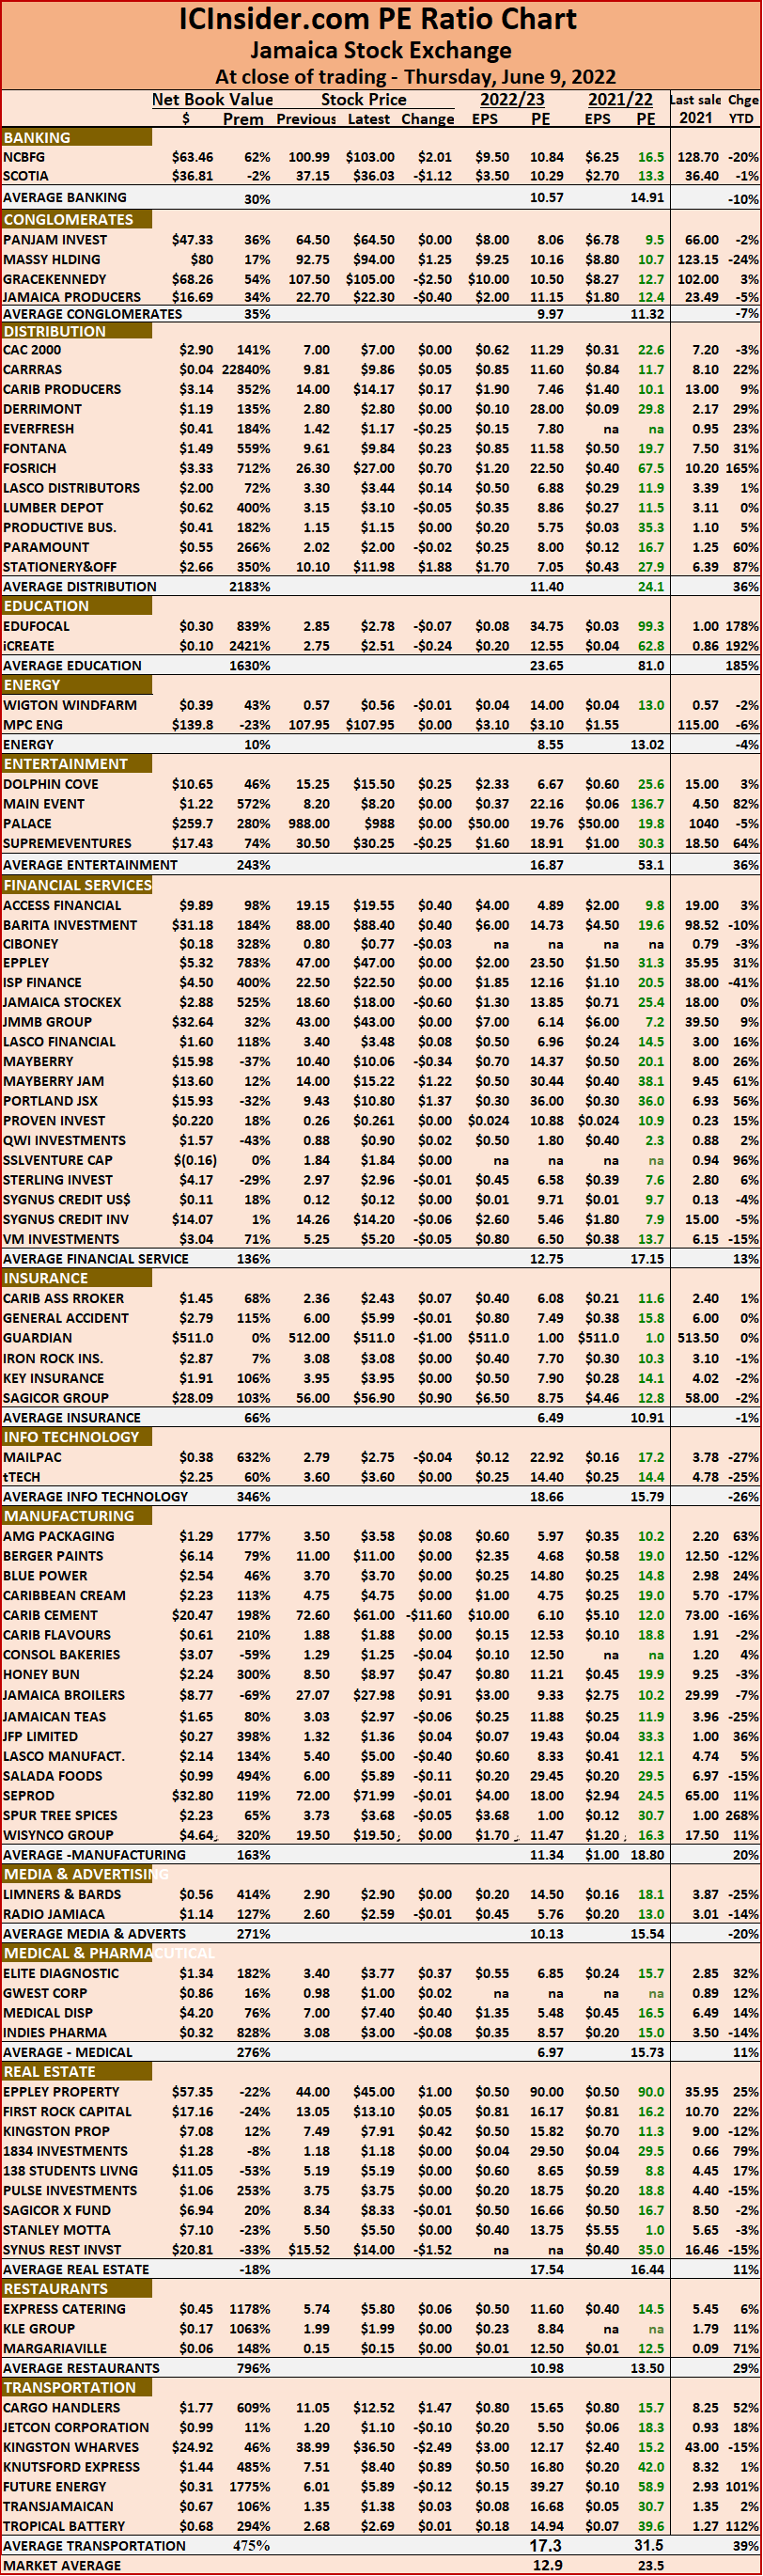 The ICInsider.com PE Ratio chart covers all ordinary shares listed on the Jamaica Stock Exchange. It shows companies grouped on an industry basis, allowing easy comparisons between the same sector companies and the overall market.
The net asset value of each company is reported as a guide to assess the value of stocks based on this measure quickly. The chart also shows daily changes in stock prices and the percentage year to date price movement based on the last traded prices. Dividends payable and yields for each company are shown in the Main and Junior Markets’ daily report charts that show the closing volume for the bids and offers.
The EPS & PE ratios are based on 2021 and 2022 actual or projected earnings, excluding major one off items. The PE Ratio is the most popular measure used to determine the value of stocks.
 The All Jamaican Composite Index climbed 4,841.97 points to 443,103.96, the JSE Main Index dropped 4,026.85 points to close at 388,150.21, but the JSE USD market index rose 5.84 points to close at 221.96.
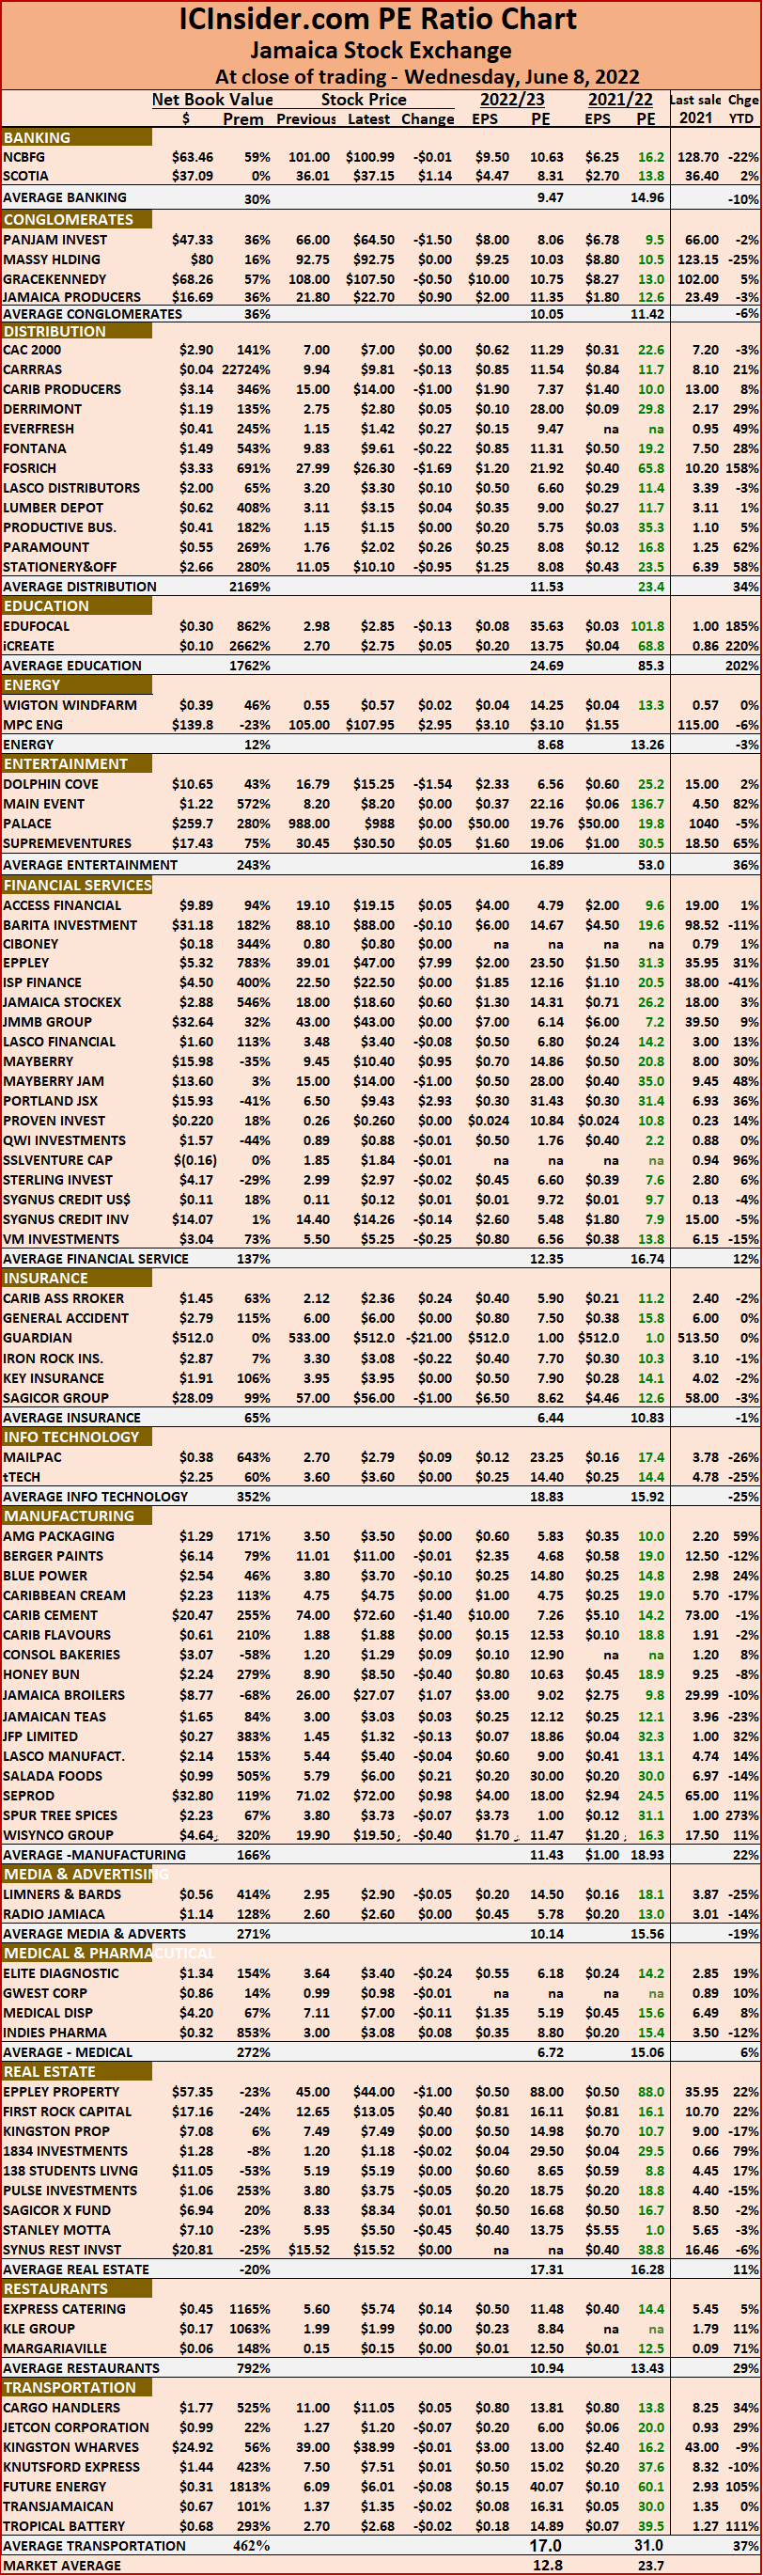 The ICInsider.com PE Ratio chart covers all ordinary shares listed on the Jamaica Stock Exchange. It shows companies grouped on an industry basis, allowing easy comparisons between the same sector companies and the overall market.
 The All Jamaican Composite Index dived 4,175.98 points to 438,261.99, the JSE Main Index dipped 4,103.95 points to close at 384,123.36 but the JSE USD market index rose 1.18 points to close at 216.12. Investors exchanged 18,835,425 shares in all markets, with the value of stocks traded in the Main and Junior Markets amounting to $119.9 million and in the JSE USD market, US$85,715.
 The ICInsider.com PE Ratio chart covers all ordinary shares listed on the Jamaica Stock Exchange. It shows companies grouped on an industry basis, allowing easy comparisons between the same sector companies and the overall market.
 The All Jamaican Composite Index shed 1,166.89 points to 442,437.97, the JSE Main Index dipped 1,330.54 points to close at 388,227.31, the Junior Market dropped 40.93 points to 4,222.21 and the JSE USD market index sipped 0.15 points to 214.94.
 The net asset value of each company is reported as a guide to assess the value of stocks based on this measure quickly. The chart also shows daily changes in stock prices and the percentage year to date price movement based on the last traded prices. Dividends payable and yields for each company are shown in the Main and Junior Markets’ daily report charts that show the closing volume for the bids and offers.
 The All Jamaican Composite Index shed 2,760.54 points to 443,604.86, the JSE Main Index dropped 1,705.22 points to close at 389,557.86 and the JSE USD market index sipped 0.03 points to 215.10. Investors exchanged 29,408,449 shares in all markets, with the value of stocks traded in the Main and Junior Markets amounting to $188.3 million and the JSE USD market, US$92,093.
 The ICInsider.com PE Ratio chart covers all ordinary shares listed on the Jamaica Stock Exchange. It shows companies grouped on an industry basis, allowing easy comparisons between the same sector companies and the overall market.
 The All Jamaican Composite Index shed 2,414.76 points to settle at 446,365.40, the JSE Main Index dropped 1,933.62 points to close at 391,263.08, the Junior Market lost 11.36 points to end at 4,226.66 and the JSE USD market index popped 1.88 points to 215.14.
 The ICInsider.com PE Ratio chart covers all ordinary shares listed on the Jamaica Stock Exchange. It shows companies grouped on an industry basis, allowing easy comparisons between the same sector companies and the overall market.
 The All Jamaican Composite Index shed 1,658.03 points to 448,780.16, the JSE Main Index dropped 1,215.87 points to close at 393,196.70, the Junior Market climbed 34.93 points to close at 4,238.03 and the JSE USD market index slipped 1.46 points to 213.26.
 The ICInsider.com PE Ratio chart covers all ordinary shares listed on the Jamaica Stock Exchange. It shows companies grouped on an industry basis, allowing easy comparisons between the same sector companies and the overall market.
 The All Jamaican Composite Index climbed 2,316.94 points to 450,438.19,the JSE Main Index added 2,129.19 points to close at 394,412.57, the Junior Market gained 56.75 points to close at 4,203.09 and the JSE USD market index popped 6.66 points to 214.72.
 The ICInsider.com PE Ratio chart covers all ordinary shares listed on the Jamaica Stock Exchange. It shows companies grouped on an industry basis, allowing easy comparisons between the same sector companies and the overall market.
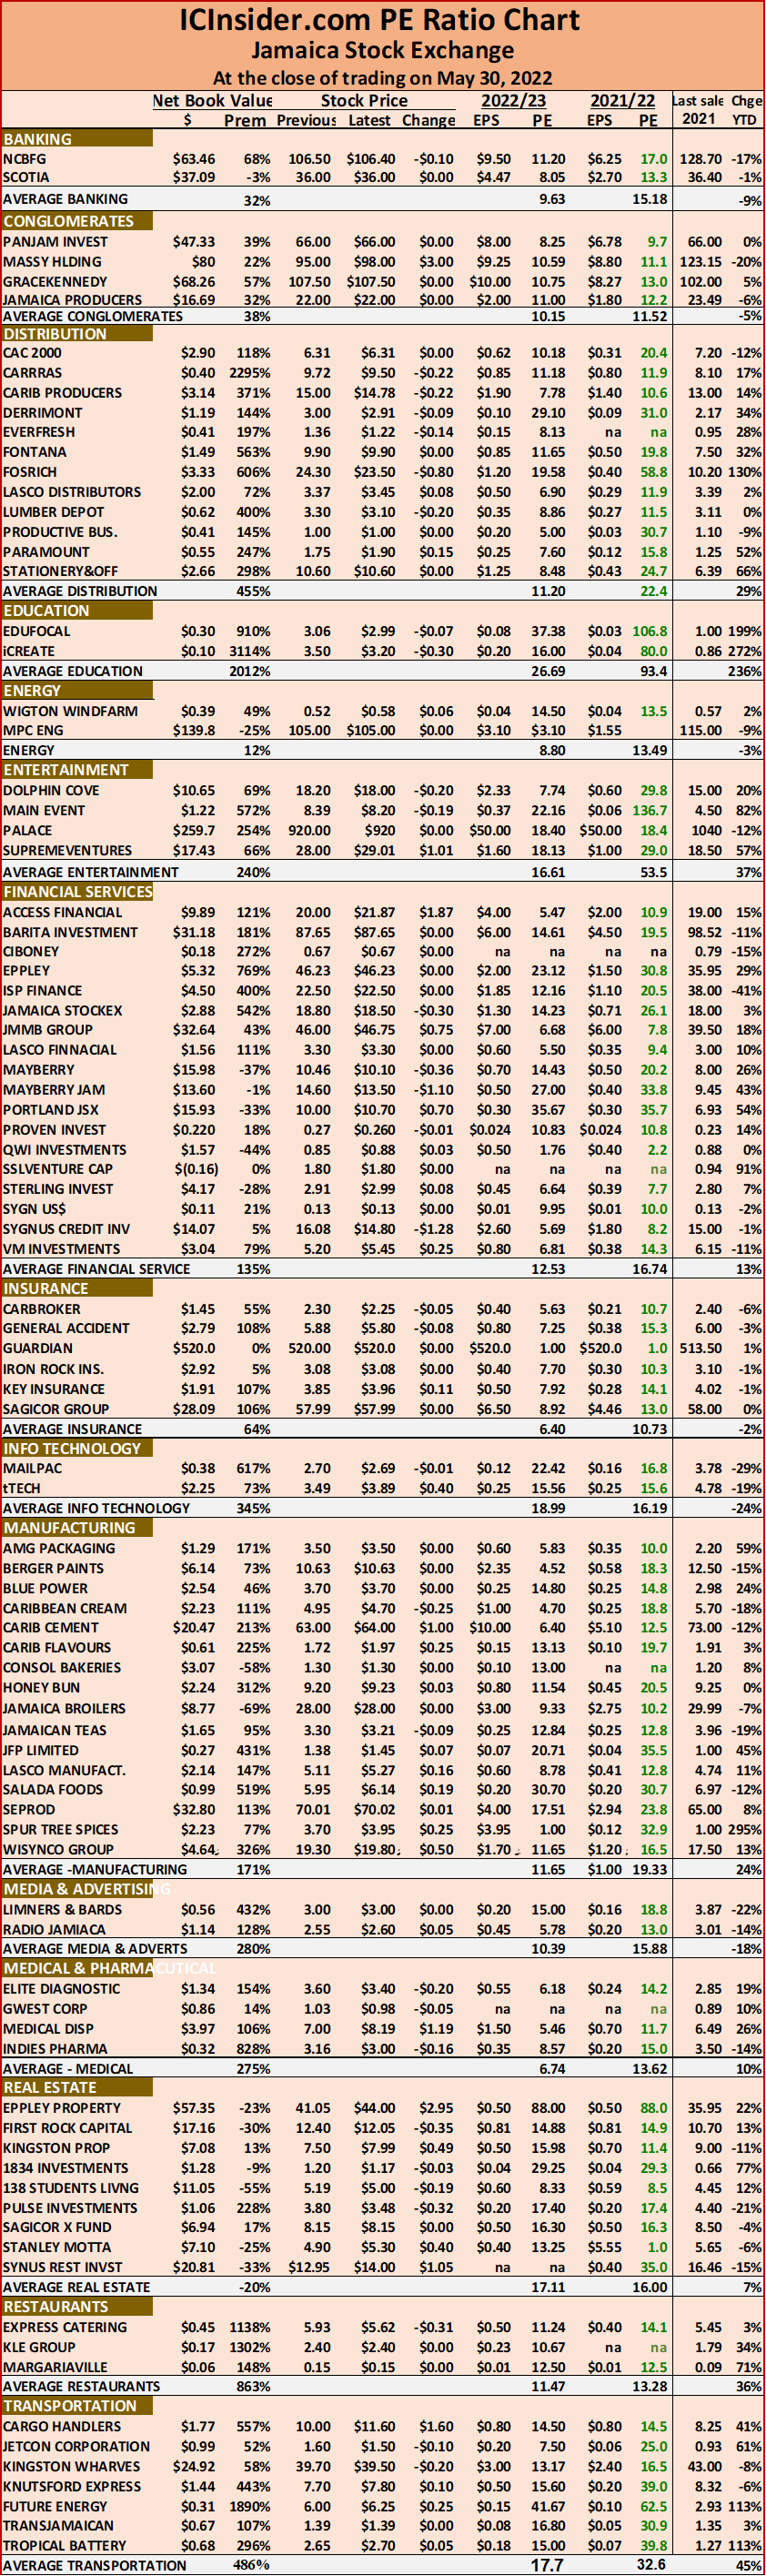 The ICInsider.com PE Ratio chart covers all ordinary shares listed on the Jamaica Stock Exchange. It shows companies grouped on an industry basis, allowing easy comparisons between the same sector companies and the overall market.
 The All Jamaican Composite Index rose 1,636.39 points to 443,816.22, the JSE Main Index added 678.54 points to close at 387,816.69, the Junior Market of the Jamaica Stock Exchange, badly bruised in the first half of the week, gained 15.96 points to close at 4,120.05 and the JSE USD market index slipped 0.41 points to 209.77.
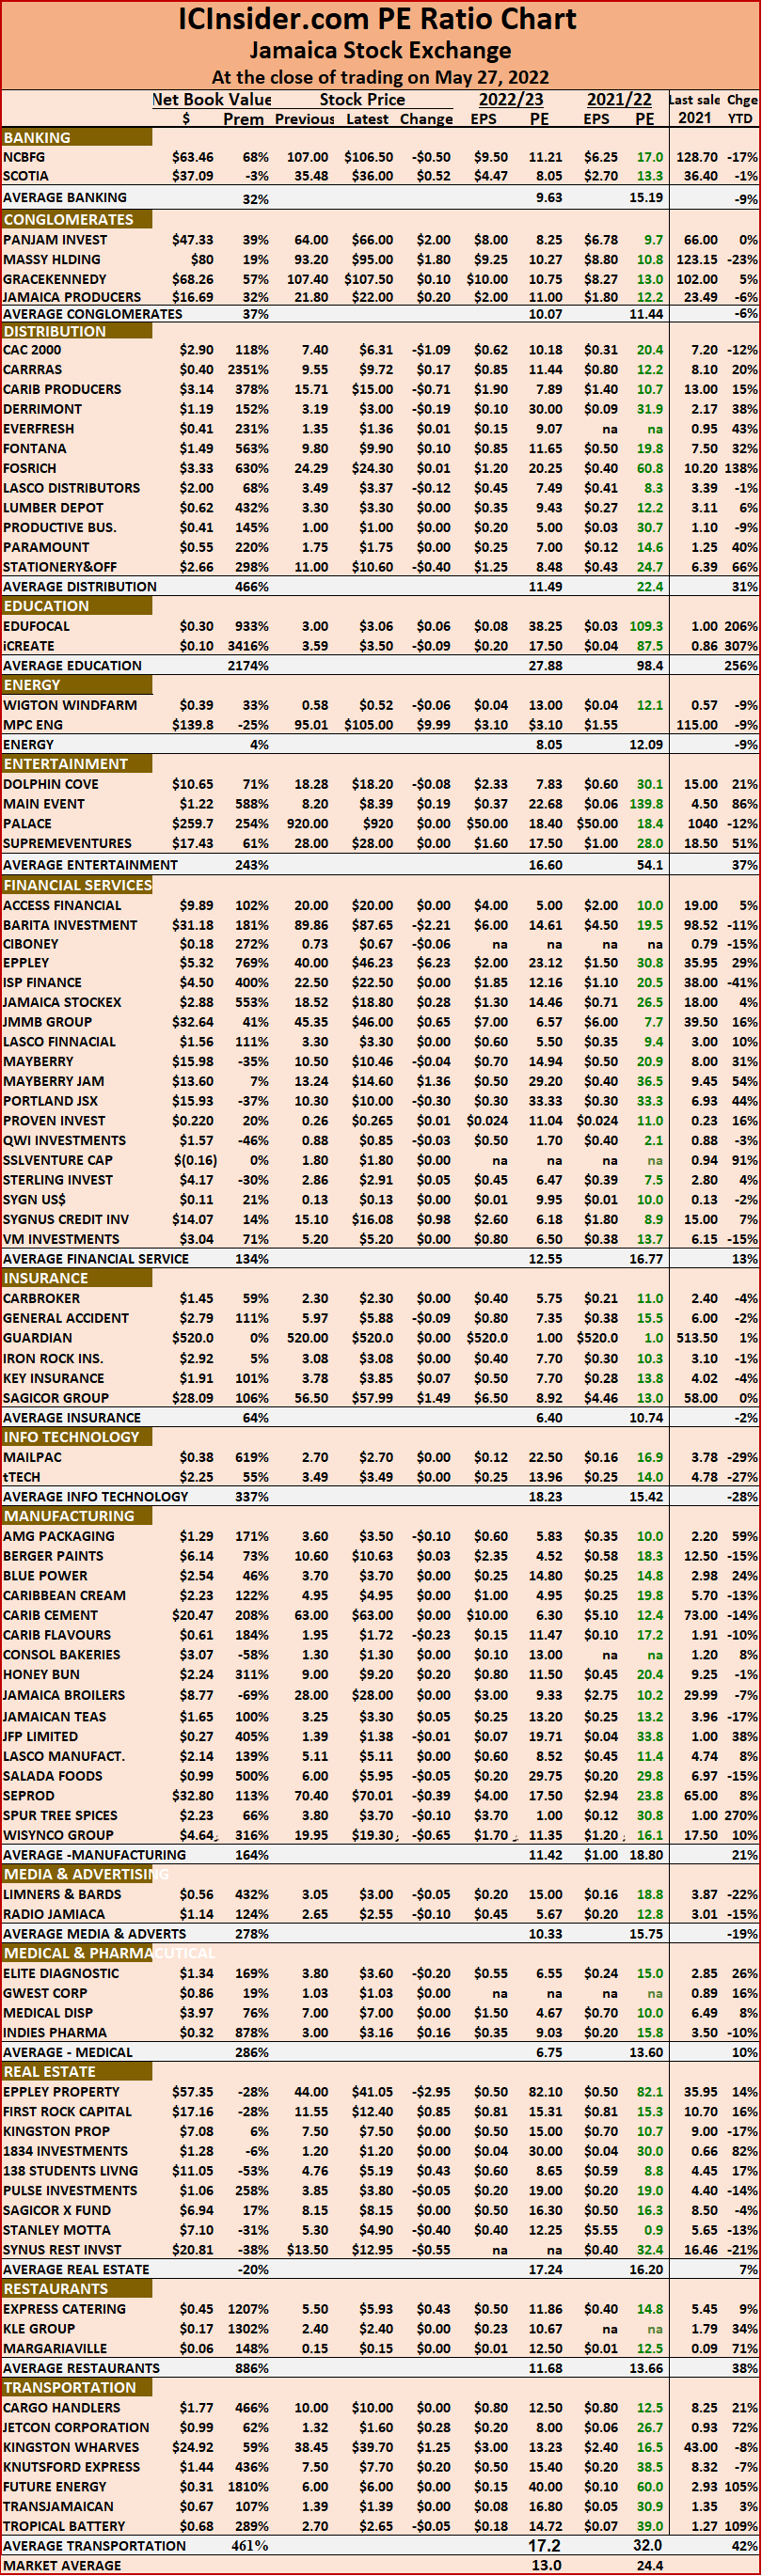 The ICInsider.com PE Ratio chart covers all ordinary shares listed on the Jamaica Stock Exchange. It shows companies grouped on an industry basis, allowing easy comparisons between the same sector companies and the overall market.


