The Jamaica Stock Exchange Main market recorded gains on Tuesday with all three Main Market indices closing higher but the Junior Market declined for a second day. The Combined Index added 3,323.62 points to end at 407,744.79, the All Jamaican Composite Index surged 5,549.32 points to 449,468.38 as trading in the Main Market jumped sharply over Monday and the JSE Main Index climbed 3,609.16 points to end at 396,015.94.
Trading slipped in trading on the Junior Market with the index falling 6.63 points to end at 4,165.36. Jamaica Stock Exchange closed at a 52 weeks’ high, followed by Supreme Ventures and Tansjamaican Highway.
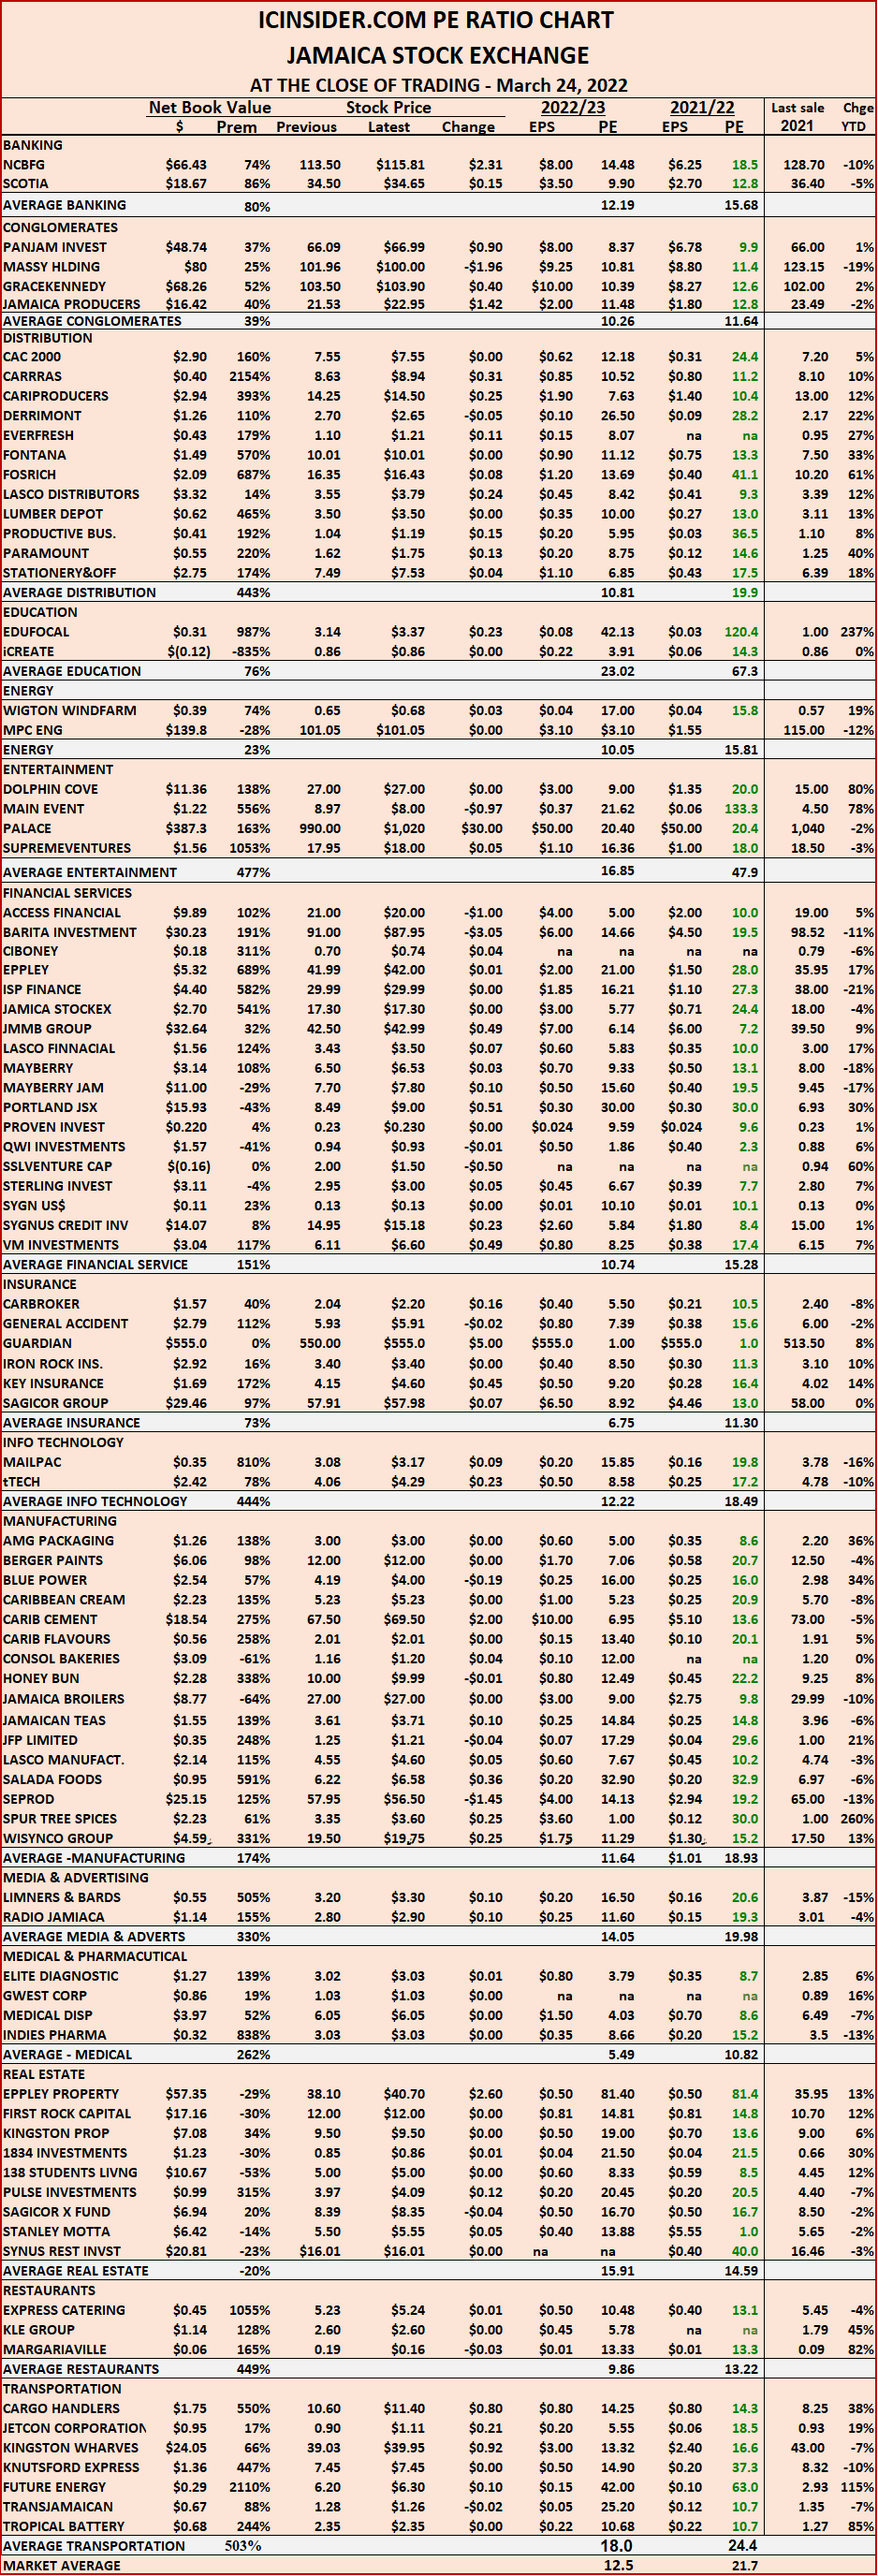
The market’s PE ratio ended at 23.2 based on 2021-22 earnings and 13.2 times those for 2022-23 at the close of the Jamaica Stock Exchange.
Investors need a series of measures and pertinent information to successfully navigate the many investment choices in the local stock market. The ICInsider.com PE ratio chart and the more detailed daily report charts provide investors with regularly updated information to help with decision-making.
Investors should make use of the chart to help make rational investment decisions by investing in stocks that are close to the average for the sector and not going too far from it unless there are compelling reasons to do so. This approach helps to take emotions out of the investment decision and put in on fundamentals while at the same time not being too far from the majority of investors. Investors who buy when the price of a stock is close to the average will find that they are not inclined to overpay for a stock.
 The ICInsider.com PE Ratio chart covers all ordinary shares listed on the Jamaica Stock Exchange. It shows companies grouped on an industry basis, allowing easy comparisons between the same sector companies and the overall market.
The net asset value of each company is reported as a guide to assess the value of stocks based on this measure quickly. The chart also shows daily changes in stock prices and the percentage year to date price movement based on the last traded prices. Dividends payable and yields for each company are shown in the Main and Junior Markets’ daily report charts that show closing volume for the bids and offers.
The EPS & PE ratios are based on 2021 and 2022 actual or projected earnings, excluding major one off items. The PE Ratio is the most popular measure used to determine the value of stocks.
Sharp rally in JSE Main Market indices
Trading jumps sharply on JSE Main Market
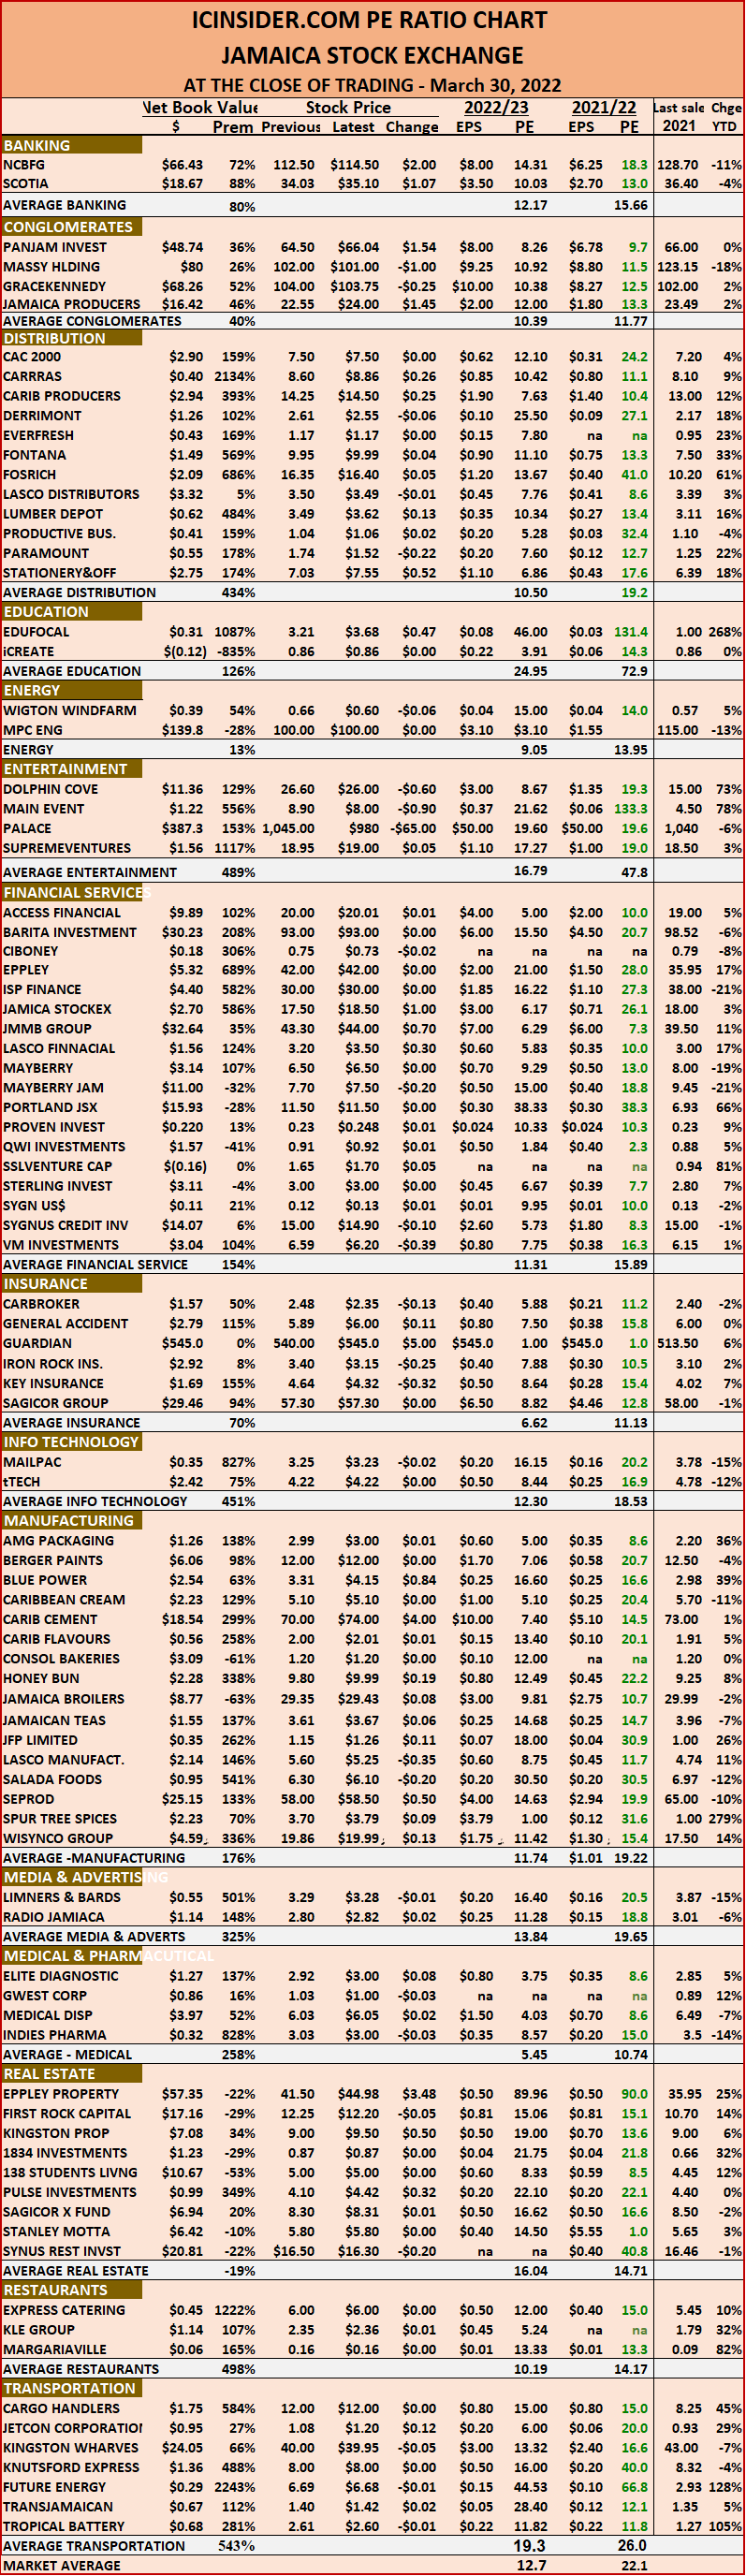
The Jamaica Stock Exchange Main market recorded gains on Monday with all three Main Market indices closing higher but the Junior Market fell. The Combined Index added 923.92 points to end at 404,421.17, the All Jamaican Composite Index rose 1,252.31 points to 443,919.06 as trading in the Main Market jumped sharply over Monday and the JSE  Main Index climbed 1,248.85 points to end at 392,406.78 on a day when JMMB Group traded at a new high of $60 resulting in the circuit breaker being triggered and the stock ended at a 52 weeks’ closing high of $54.
Trading slipped in trading on the Junior Market with the index falling 27.63 points to end at 4,171.59.
Mayberry Jamaican Equities was the lead trade for the day with 100 million shares.
The market’s PE ratio ended at 23.1 based on 2021-22 earnings and 13.1 times those for 2022-23 at the close of the Jamaica Stock Exchange.
Investors need a series of measures and pertinent information to successfully navigate the many investment choices in the local stock market. The ICInsider.com PE ratio chart and the more detailed daily report charts provide investors with regularly updated information to help with decision-making.
Investors should make use of the chart to help make rational investment decisions by investing in stocks that are close to the average for the sector and not going too far from it unless there are compelling reasons to do so. 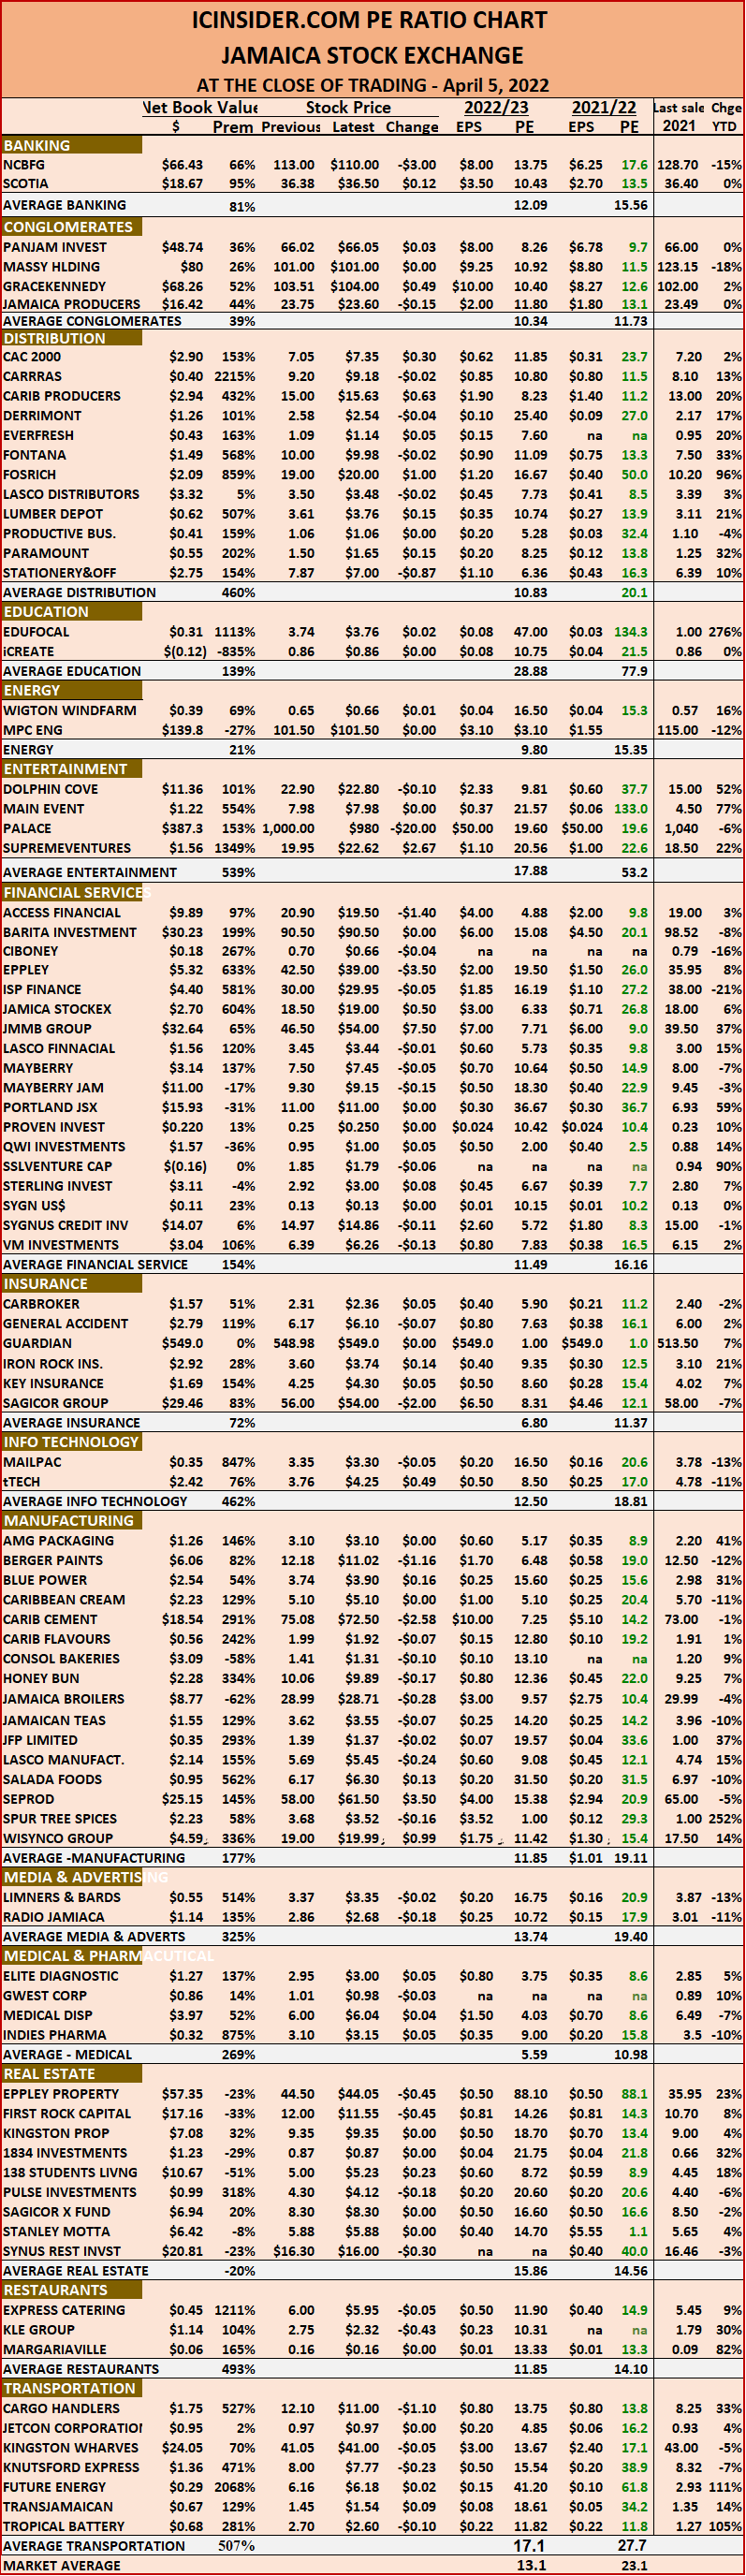 This approach helps to take emotions out of the investment decision and put in on fundamentals while at the same time not being too far from the majority of investors. Investors who buy when the price of a stock is close to the average will find that they are not inclined to overpay for a stock.
The ICInsider.com PE Ratio chart covers all ordinary shares listed on the Jamaica Stock Exchange. It shows companies grouped on an industry basis, allowing easy comparisons between the same sector companies and the overall market.
The net asset value of each company is reported as a guide to assess the value of stocks based on this measure quickly. The chart also shows daily changes in stock prices and the percentage year to date price movement based on the last traded prices. Dividends payable and yields for each company are shown in the Main and Junior Markets’ daily report charts that show closing volume for the bids and offers.
The EPS & PE ratios are based on 2021 and 2022 actual or projected earnings, excluding major one off items. The PE Ratio is the most popular measure used to determine the value of stocks.
JSE markets start week with gains
The Jamaica Stock Exchange recorded gains on Monday with all three Main Market indices closing higher and they were joined by the Junior Market. The Combined Index added 1,414.33 points to end at 403,497.25, the All Jamaican Composite Index rose 1,999.37 points to settle at 442,666.75 as trading in the Main Market slipped marginally from that on Friday and the JSE Main Index climbed 1384.40 points to end at 391157.93.
Trading plunged on the second day of trading on the Junior Market and ended, after adding 13.32 to end at 4,199.22.
The market’s PE ratio ended at 23 based on 2021-22 earnings and 13.1 times those for 2022-23 at the close of the Jamaica Stock Exchange.
Investors need a series of measures and pertinent information to successfully navigate the many investment choices in the local stock market. The ICInsider.com PE ratio chart and the more detailed daily report charts provide investors with regularly updated information to help with decision-making.
Investors should make use of the chart to help make rational investment decisions by investing in stocks that are close to the average for the sector and not going too far from it unless there are compelling reasons to do so.  This approach helps to take emotions out of the investment decision and put in on fundamentals while at the same time not being too far from the majority of investors. Investors who buy when the price of a stock is close to the average will find that they are not inclined to overpay for a stock.
The ICInsider.com PE Ratio chart covers all ordinary shares listed on the Jamaica Stock Exchange. It shows companies grouped on an industry basis, allowing easy comparisons between the same sector companies and the overall market.
The net asset value of each company is reported as a guide to assess the value of stocks based on this measure quickly. The chart also shows daily changes in stock prices and the percentage year to date price movement based on the last traded prices. Dividends payable and yields for each company are shown in the Main and Junior Markets’ daily report charts that show closing volume for the bids and offers.
The EPS & PE ratios are based on 2021 and 2022 actual or projected earnings, excluding major one off items. The PE Ratio is the most popular measure used to determine the value of stocks.
JSE markets slip into April
Stocks traded down at the close of the Jamaica Stock Exchange on Friday, with all three Main Market indices closing lower, with the Junior Market joining forces. The Combined Index fell 1,697.80 points to 402,082.92, the All Jamaican Composite Index dropped 1,990.84 points to 440,667.38, the JSE Main Index shed 2,207.57 points to end at 389,773.53 while the Junior Market fell 37.43 points to 4,185.90.
The market’s PE ratio ended at 22 based on 2021-22 earnings and 12.8 times those for 2022-23 at the close of the Jamaica Stock Exchange.
Investors need a series of measures and pertinent information to successfully navigate the many investment choices in the local stock market. The ICInsider.com PE ratio chart and the more detailed daily report charts provide investors with regularly updated information to help with decision-making.
Investors should make use of the chart to help make rational investment decisions by investing in stocks that are close to the average for the sector and not going too far from it unless there are compelling reasons to do so. This approach helps to take emotions out of the investment decision and put in on fundamentals while at the same time not being too far from the majority of investors. Investors who buy when the price of a stock is close to the average will find that they are not inclined to overpay for a stock.
 The ICInsider.com PE Ratio chart covers all ordinary shares listed on the Jamaica Stock Exchange. It shows companies grouped on an industry basis, allowing easy comparisons between the same sector companies and the overall market.
The net asset value of each company is reported as a guide to assess the value of stocks based on this measure quickly. The chart also shows daily changes in stock prices and the percentage year to date price movement based on the last traded prices. Dividends payable and yields for each company are shown in the Main and Junior Markets’ daily report charts that show closing volume for the bids and offers.
The EPS & PE ratios are based on 2021 and 2022 actual or projected earnings, excluding major one off items. The PE Ratio is the most popular measure used to determine the value of stocks.
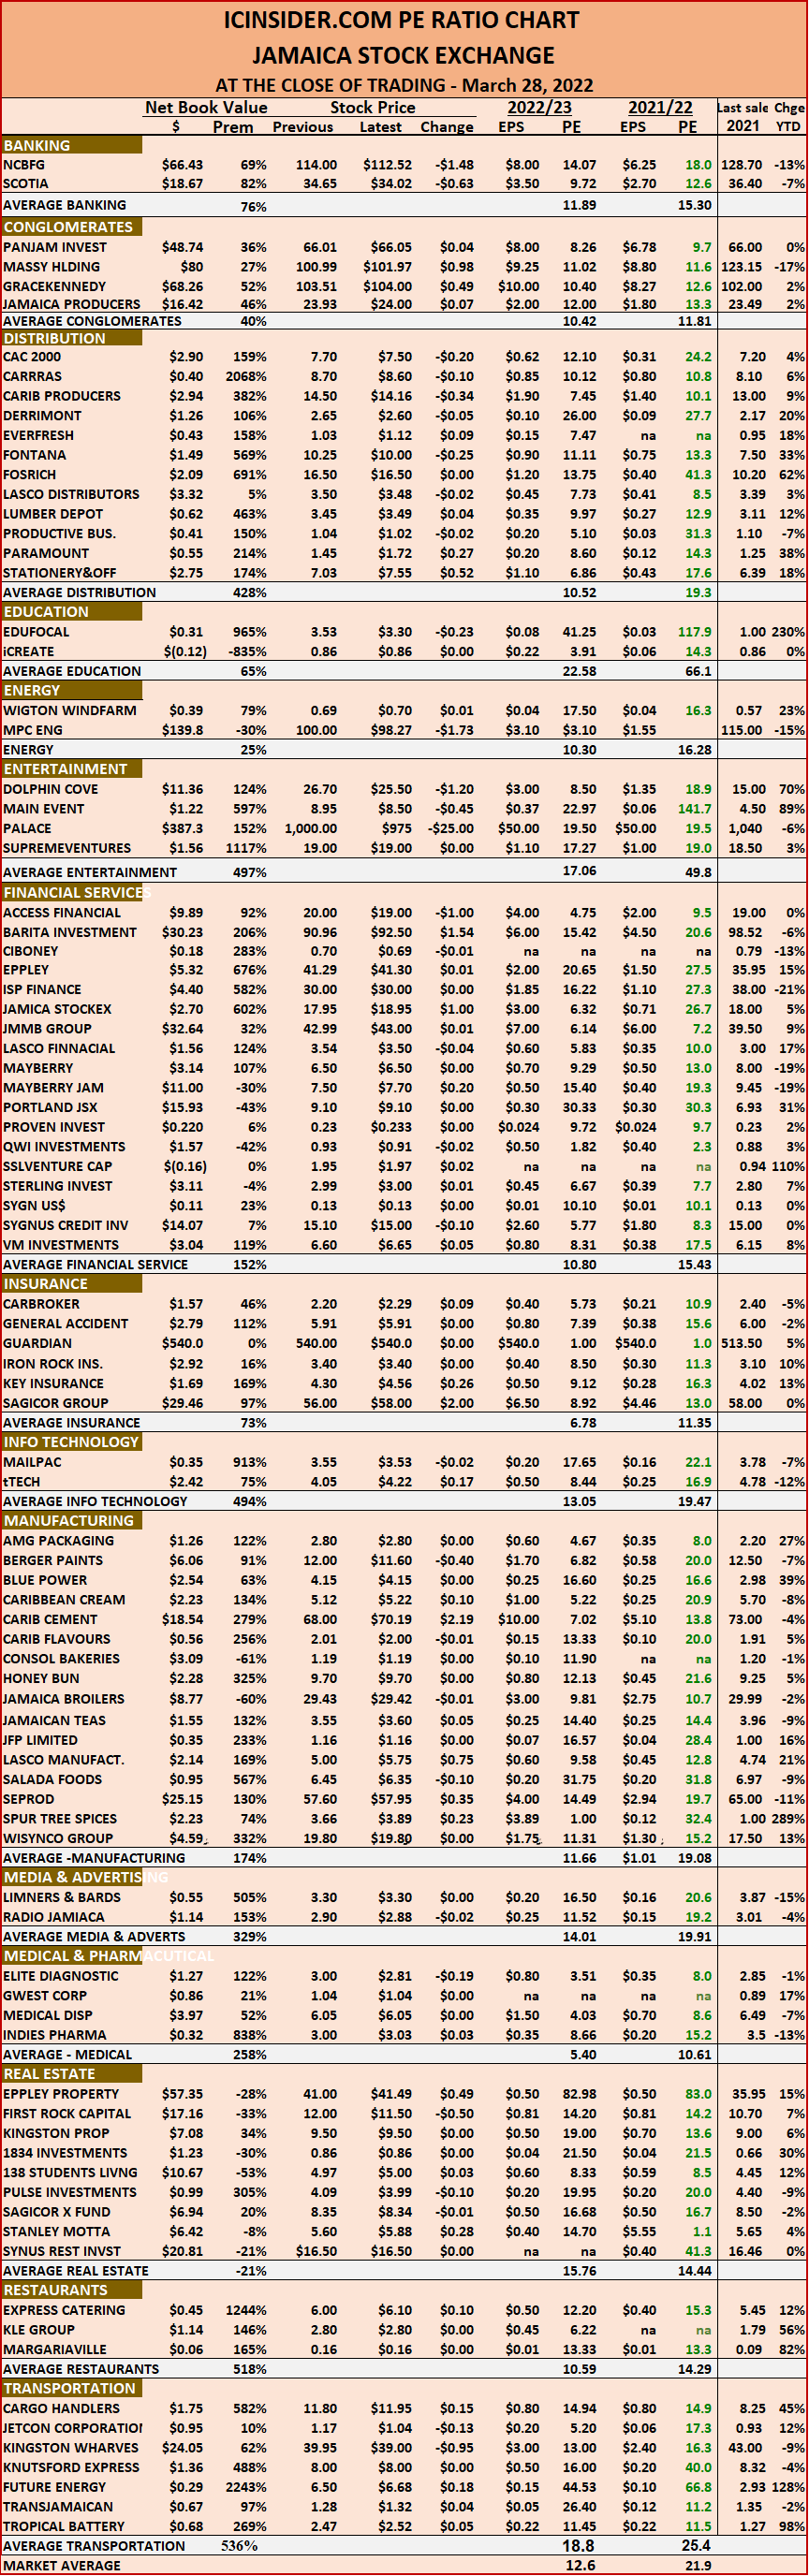
JSE finishes off March with sharp rally
The Jamaica Stock Exchange ended trading on Thursday with all three Main Market indices rising to close out March. The Combined Index climbed 2,368.79 points to 403.780.72, the All Jamaican Composite Index jumped 3,189.37 points to 442,658.22 and the JSE Main Index climbed 2,207.57 points to end at 391,231.96 while the Junior Market jumped 34.01 points to 4,223.33.
The market’s PE ratio ended at 22.1 based on 2021-22 earnings and 12.8 times those for 2022-23 at the close of the Jamaica Stock Exchange.
Investors need a series of measures and pertinent information to successfully navigate the many investment choices in the local stock market. The ICInsider.com PE ratio chart and the more detailed daily report charts provide investors with regularly updated information to help with decision-making.
Investors should make use of the chart to help make rational investment decisions by investing in stocks that are close to the average for the sector and not going too far from it unless there are compelling reasons to do so. This approach helps to take emotions out of the investment decision and put in on fundamentals while at the same time not being too far from the majority of investors. Investors who buy when the price of a stock is close to the average will find that they are not inclined to overpay for a stock.
 The ICInsider.com PE Ratio chart covers all ordinary shares listed on the Jamaica Stock Exchange. It shows companies grouped on an industry basis, allowing easy comparisons between the same sector companies and the overall market.
The net asset value of each company is reported as a guide to assess the value of stocks based on this measure quickly. The chart also shows daily changes in stock prices and the percentage year to date price movement based on the last traded prices. Dividends payable and yields for each company are shown in the Main and Junior Markets’ daily report charts that show closing volume for the bids and offers.
The EPS & PE ratios are based on 2021 and 2022 actual or projected earnings, excluding major one off items. The PE Ratio is the most popular measure used to determine the value of stocks.
Junior Market drops & recovery for Main Market
The Jamaica Stock Exchange ended trading on Wednesday with all three Main market gaining indices rising at the close, with the Combined Index climbing 2,582.90 points to close at 401,411.93, the All Jamaican Composite Index Jumped 4,746.65 points to close at 439,468.85 and the JSE Main Index 3,384.50 points to end at 389,024.39 while the Junior Market dived 65.96 points to 4,189.32.
The market’s PE ratio ended at 22.1 based on 2021-22 earnings and 12.7 times those for 2022-23 at the close of the Jamaica Stock Exchange.
Investors need a series of measures and pertinent information to successfully navigate the many investment choices in the local stock market. The ICInsider.com PE ratio chart and the more detailed daily report charts provide investors with regularly updated information to help with decision-making.
Investors should make use of the chart to help make rational investment decisions by investing in stocks that are close to the average for the sector and not going too far from it unless there are compelling reasons to do so. This approach helps to take emotions out of the investment decision and put in on fundamentals while at the same time not being too far from the majority of investors. Investors who buy when the price of a stock is close to the average will find that they are not inclined to overpay for a stock.
 The ICInsider.com PE Ratio chart covers all ordinary shares listed on the Jamaica Stock Exchange. It shows companies grouped on an industry basis, allowing easy comparisons between the same sector companies and the overall market.
The net asset value of each company is reported as a guide to assess the value of stocks based on this measure quickly. The chart also shows daily changes in stock prices and the percentage year to date price movement based on the last traded prices. Dividends payable and yields for each company are shown in the Main and Junior Markets’ daily report charts that show closing volume for the bids and offers.
The EPS & PE ratios are based on 2021 and 2022 actual or projected earnings, excluding major one off items. The PE Ratio is the most popular measure used to determine the value of stocks.
Junior Market hits record high as Main Market drops
The Jamaica Stock Exchange ended trading with the Junior Market closing at a new record high of 4,255.28 after it opened trading at a record high of 4,292.32 but drifted down from there to the record close.
The Main Market lost ground on Tuesday, after rising for two days and ended, with the Combined Index dropping 1,359.74 points to close at 398,829.03, the All Jamaican Composite Index dived 3,613.87 points to 434,722.20 and the JSE Main Index declined 1,925.82 points to end at 385,639.89.
The market’s PE ratio ended at 21.8 based on 2021-22 earnings and 12.6 times those for 2022-23 at the close of the Jamaica Stock Exchange.
Investors need a series of measures and pertinent information to successfully navigate the many investment choices in the local stock market. The ICInsider.com PE ratio chart and the more detailed daily report charts provide investors with regularly updated information to help with decision-making.
Investors should make use of the chart to help make rational investment decisions by investing in stocks that are close to the average for the sector and not going too far from it unless there are compelling reasons to do so. This approach helps to take emotions out of the investment decision and put in on fundamentals while at the same time not being too far from the majority of investors. Investors who buy when the price of a stock is close to the average will find that they are not inclined to overpay for a stock.
 The ICInsider.com PE Ratio chart covers all ordinary shares listed on the Jamaica Stock Exchange. It shows companies grouped on an industry basis, allowing easy comparisons between the same sector companies and the overall market.
The net asset value of each company is reported as a guide to assess the value of stocks based on this measure quickly. The chart also shows daily changes in stock prices and the percentage year to date price movement based on the last traded prices. Dividends payable and yields for each company are shown in the Main and Junior Markets’ daily report charts that show closing volume for the bids and offers.
The EPS & PE ratios are based on 2021 and 2022 actual or projected earnings, excluding major one off items. The PE Ratio is the most popular measure used to determine the value of stocks.
Junior Market record slips Main Market climbs
The Jamaica Stock Exchange ended with the Junior Market trading at a new record in the early morning session at 4,236.63 but failed to hold on to close at another record high after slipping 0.42 points to end at 4,205.36.
The Main Market continue to recover from last week’s loss, with, the Combined Index rose 1,215.01 points to close at 400,188.77, the All Jamaican Composite Index rallied 2,588.02 points to 438,336.07 and the JSE Main Index rose 1,301.75 to end at 387,565.71.
The market’s PE ratio ended at 21.9 based on 2021-22 earnings and 12.6 times those for 2022-23 at the close of the Jamaica Stock Exchange.
Investors need a series of measures and pertinent information to successfully navigate the many investment choices in the local stock market. The ICInsider.com PE ratio chart and the more detailed daily report charts provide investors with regularly updated information to help with decision-making.
 Investors should make use of the chart to help make rational investment decisions by investing in stocks that are close to the average for the sector and not going too far from it unless there are compelling reasons to do so. This approach helps to take emotions out of the investment decision and put in on fundamentals while at the same time not being too far from the majority of investors. Investors who buy when the price of a stock is close to the average will find that they are not inclined to overpay for a stock.
The ICInsider.com PE Ratio chart covers all ordinary shares listed on the Jamaica Stock Exchange. It shows companies grouped on an industry basis, allowing easy comparisons between the same sector companies and the overall market.
The net asset value of each company is reported as a guide to assess the value of stocks based on this measure quickly. The chart also shows daily changes in stock prices and the percentage year to date price movement based on the last traded prices. Dividends payable and yields for each company are shown in the Main and Junior Markets’ daily report charts that show closing volume for the bids and offers.
The EPS & PE ratios are based on 2021 and 2022 actual or projected earnings, excluding major one off items. The PE Ratio is the most popular measure used to determine the value of stocks.
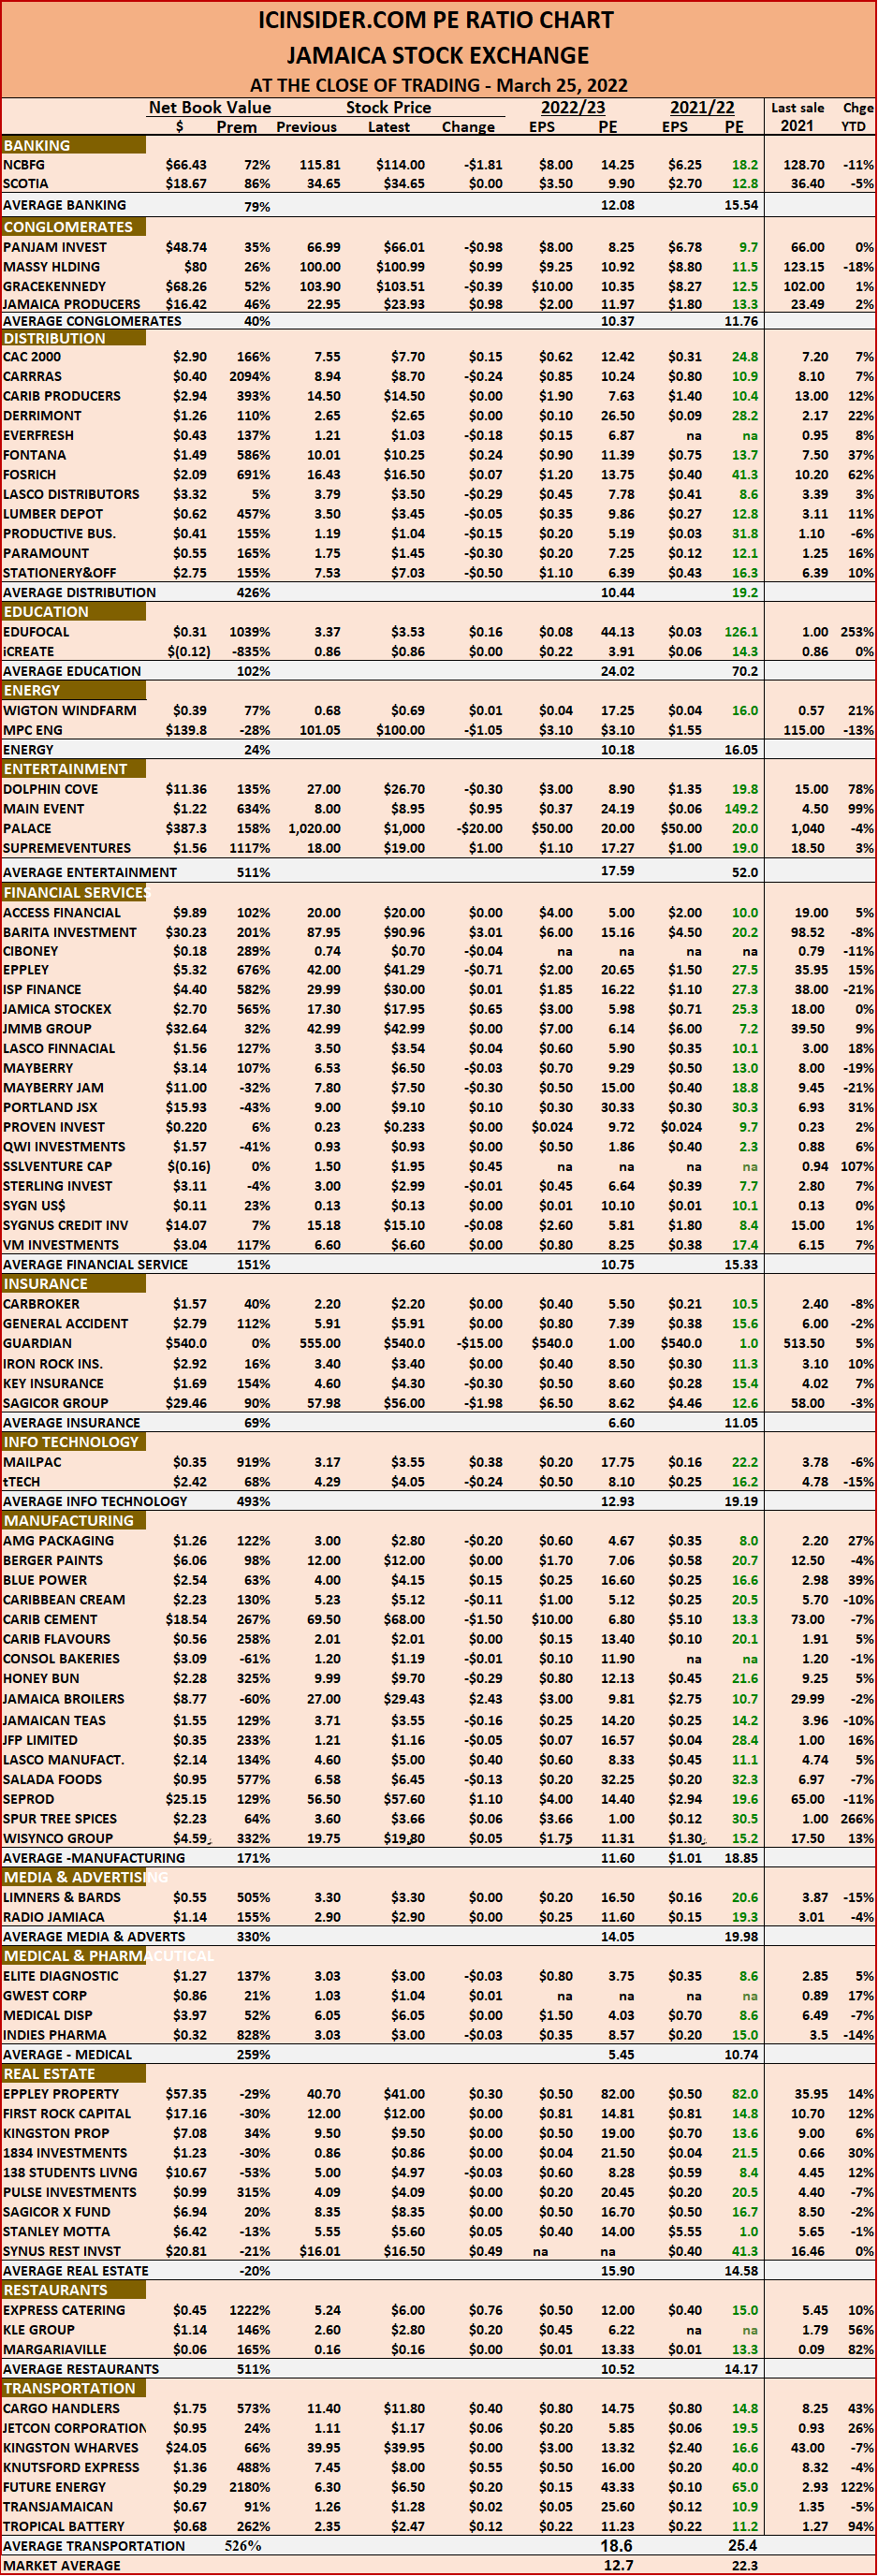
New Junior Market record as Majors rise
The Jamaica Stock Exchange ended the week, with the Junior Market ending at a new record close, having surged 101.72 points to close at 4,205.78 to be up over 22.4 percent for the year to date. At the same time, the Main Market eked out relatively modest gains as it struggles to break out of the consolidation zone it’s been in for months.
At the close of trading, the Combined Index rose 2,838.62 points to close at 398,973.76, the All Jamaican Composite Index rallied 3,161.89 points to 435,748.05, the JSE Main Index rose 2,067.22 to end at 386,263.96.
The market’s PE ratio ended at 22.3 based on 2021-22 earnings and 12.7 times those for 2022-23 at the close of the Jamaica Stock Exchange.
Investors need a series of measures and pertinent information to successfully navigate the many investment choices in the local stock market. The ICInsider.com PE ratio chart and the more detailed daily report charts provide investors with regularly updated information to help with decision-making.
 Investors should use the chart to help make rational investment decisions by investing in stocks that are close to the average for the sector and not going too far from it unless there are compelling reasons to do so. This approach helps to take emotions out of the investment decision and put in on fundamentals while at the same time not being too far from the majority of investors. Investors who buy when the price of a stock is close to the average will find that they are not inclined to overpay for a stock.
The ICInsider.com PE Ratio chart covers all ordinary shares listed on the Jamaica Stock Exchange. It shows companies grouped on an industry basis, allowing easy comparisons between the same sector companies and the overall market.
The net asset value of each company is reported as a guide to assess the value of stocks based on this measure quickly. The chart also shows daily changes in stock prices and the percentage year to date price movement based on the last traded prices. Dividends payable and yields for each company are shown in the Main and Junior Markets’ daily report charts that show closing volume for the bids and offers.
The EPS & PE ratios are based on 2021 and 2022 actual or projected earnings, excluding major one off items. The PE Ratio is the most popular measure used to determine the value of stocks.
Main Market drops, Junior Market rises
The Jamaica Stock Exchange market suffered losses on Thursday while the Junior Market indices recorded gains to close over the 4,100 points level yet again.
At the close of trading the Combined Index slipped 1,212.53 points to close at 396,135.14, the All Jamaican Composite Index dropped 2,001.01 points to 432,586.16, the JSE Main Index declined 1,679.51 to end at 384,196.7 and the Junior Market Index climbed 40.52 points to 4,104.06.
The market’s PE ratio ended at 21.7 based on 2021-22 earnings and 12.5 times those for 2022-23 at the close of the Jamaica Stock Exchange.
Investors need a series of measures and pertinent information to successfully navigate the many investment choices in the local stock market. The ICInsider.com PE ratio chart and the more detailed daily report charts provide investors with regularly updated information to help with decision-making.
Investors should make use of the chart to help make rational investment decisions by investing in stocks that are close to the average for the sector and not going too far from it unless there are compelling reasons to do so. This approach helps to take emotions out of the investment decision and put in on fundamentals while at the same time not being too far from the majority of investors. Investors who buy when the price of a stock is close to the average will find that they are not inclined to overpay for a stock.
 The ICInsider.com PE Ratio chart covers all ordinary shares listed on the Jamaica Stock Exchange. It shows companies grouped on an industry basis, allowing easy comparisons between the same sector companies and the overall market.
The net asset value of each company is reported as a guide to assess the value of stocks based on this measure quickly. The chart also shows daily changes in stock prices and the percentage year to date price movement based on the last traded prices. Dividends payable and yields for each company are shown in the Main and Junior Markets’ daily report charts that show closing volume for the bids and offers.
The EPS & PE ratios are based on 2021 and 2022 actual or projected earnings, excluding major one off items. The PE Ratio is the most popular measure used to determine the value of stocks.


