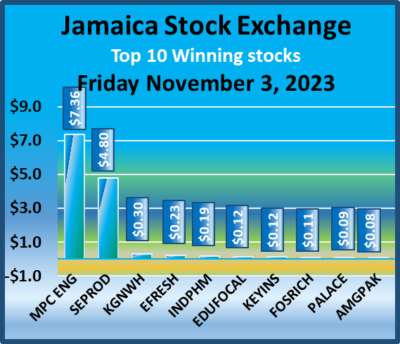
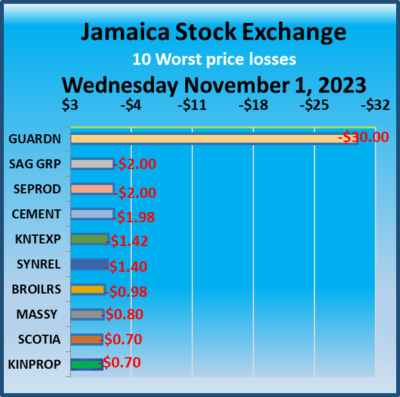
The Jamaica Stock Exchange Main Market closed trading on Friday lower with modest trading activity characterized trading, but the Junior Market and JSE USD Markets pushed higher to close the week positively.
 At close, the JSE Combined Market Index dropped 2,613.54 points to close at 327,354.97, while the All Jamaican Composite Index shed 1,366.63 points to end at 347,733.07, the JSE Main Index lost 3,039.14 points to settle at 312,866.71. The Junior Market Index popped 25.76 points to end at 3,873.18 and the JSE USD Market Index rallied 1.94 points to 230.99.
Investors traded 8,797,366 shares in all three markets, down from 10,303,204 stock units on Thursday. The value of stocks traded plunged on the Junior and Main markets to just $41.29 million from $114.36 million on Thursday. The JSE USD market closed after 50,369 shares were traded for US$10,547 compared to 191,624 units at US$7,484 on Friday.
In the preference segment, Eppley 7.50% preference share declined 90 cents to end at $5.07 and 138 Student Living preference share shed $17.73 and ended at $89.27.
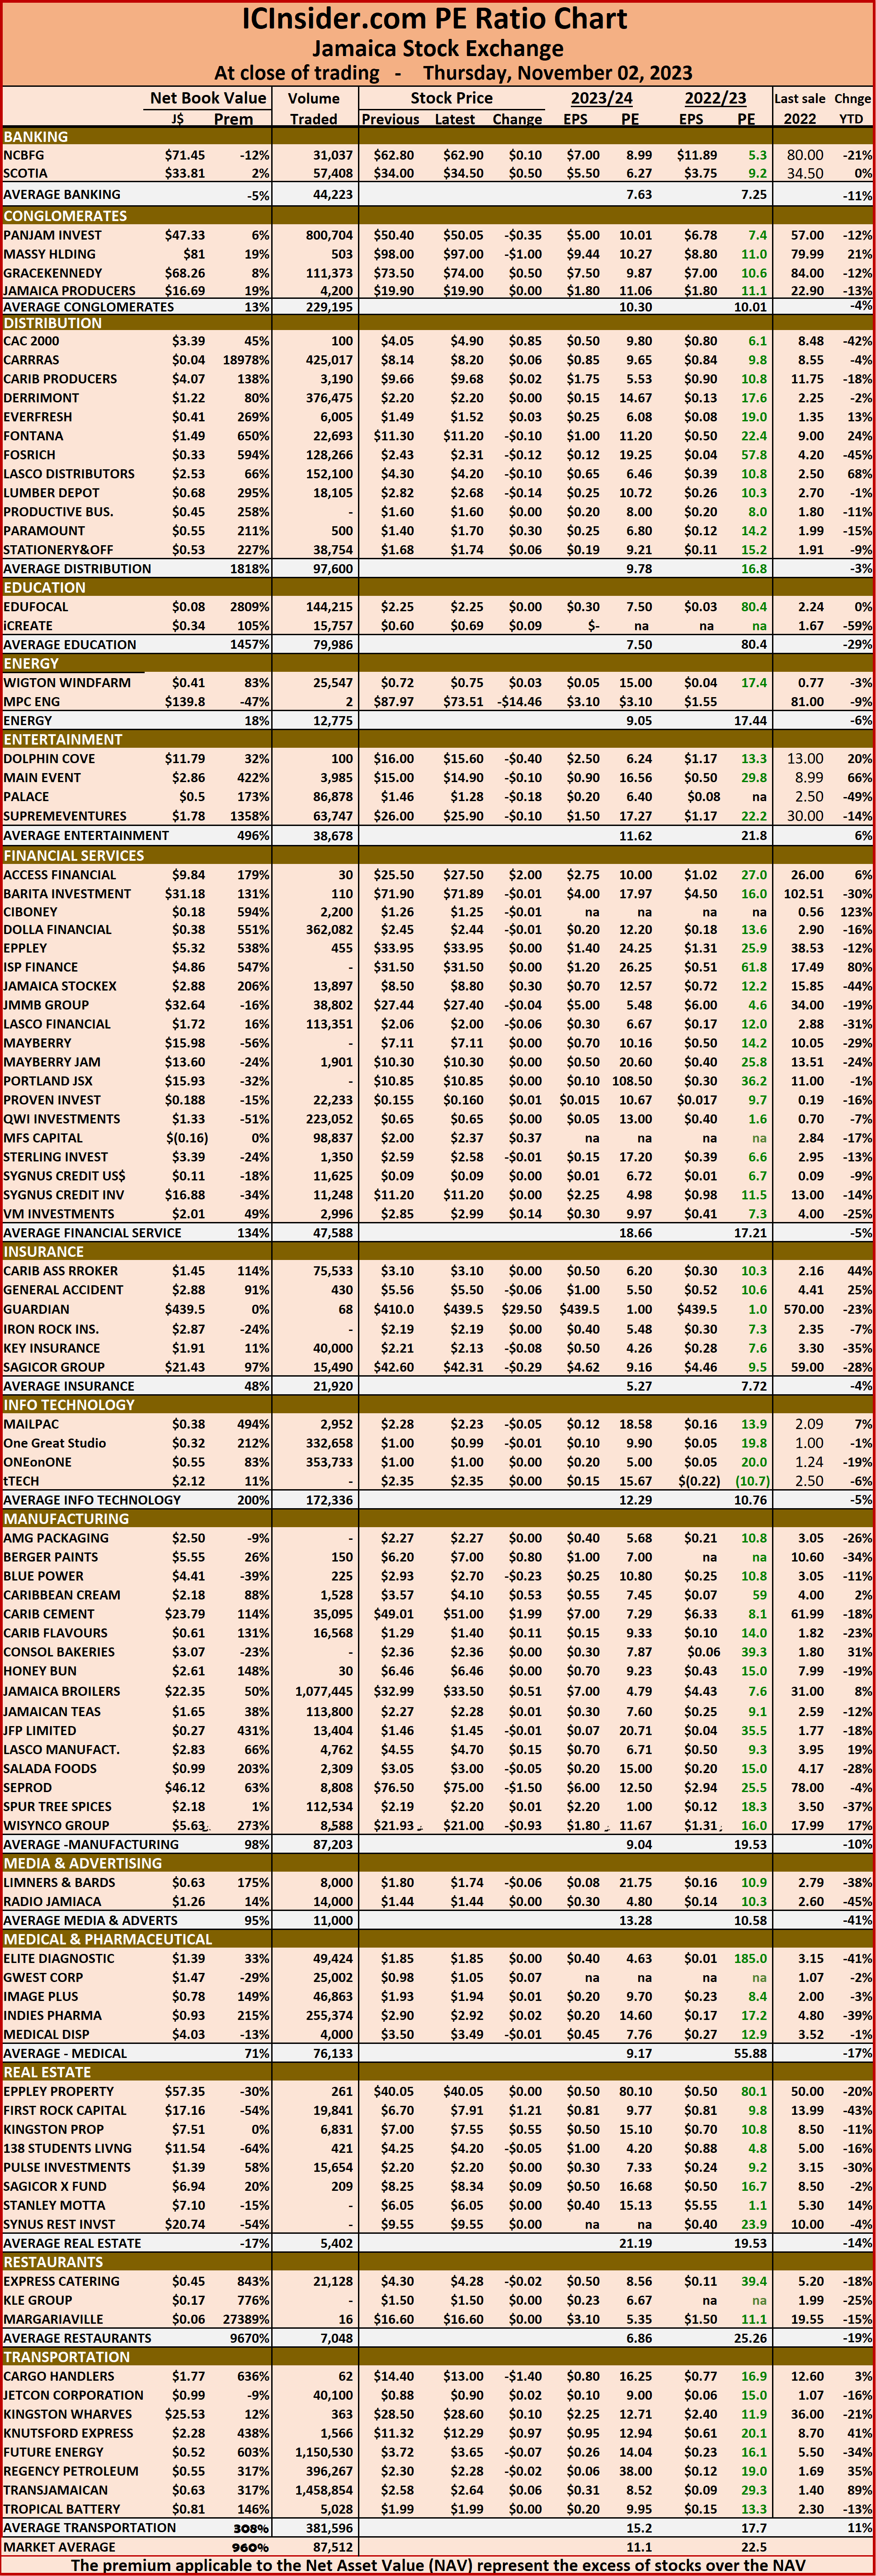
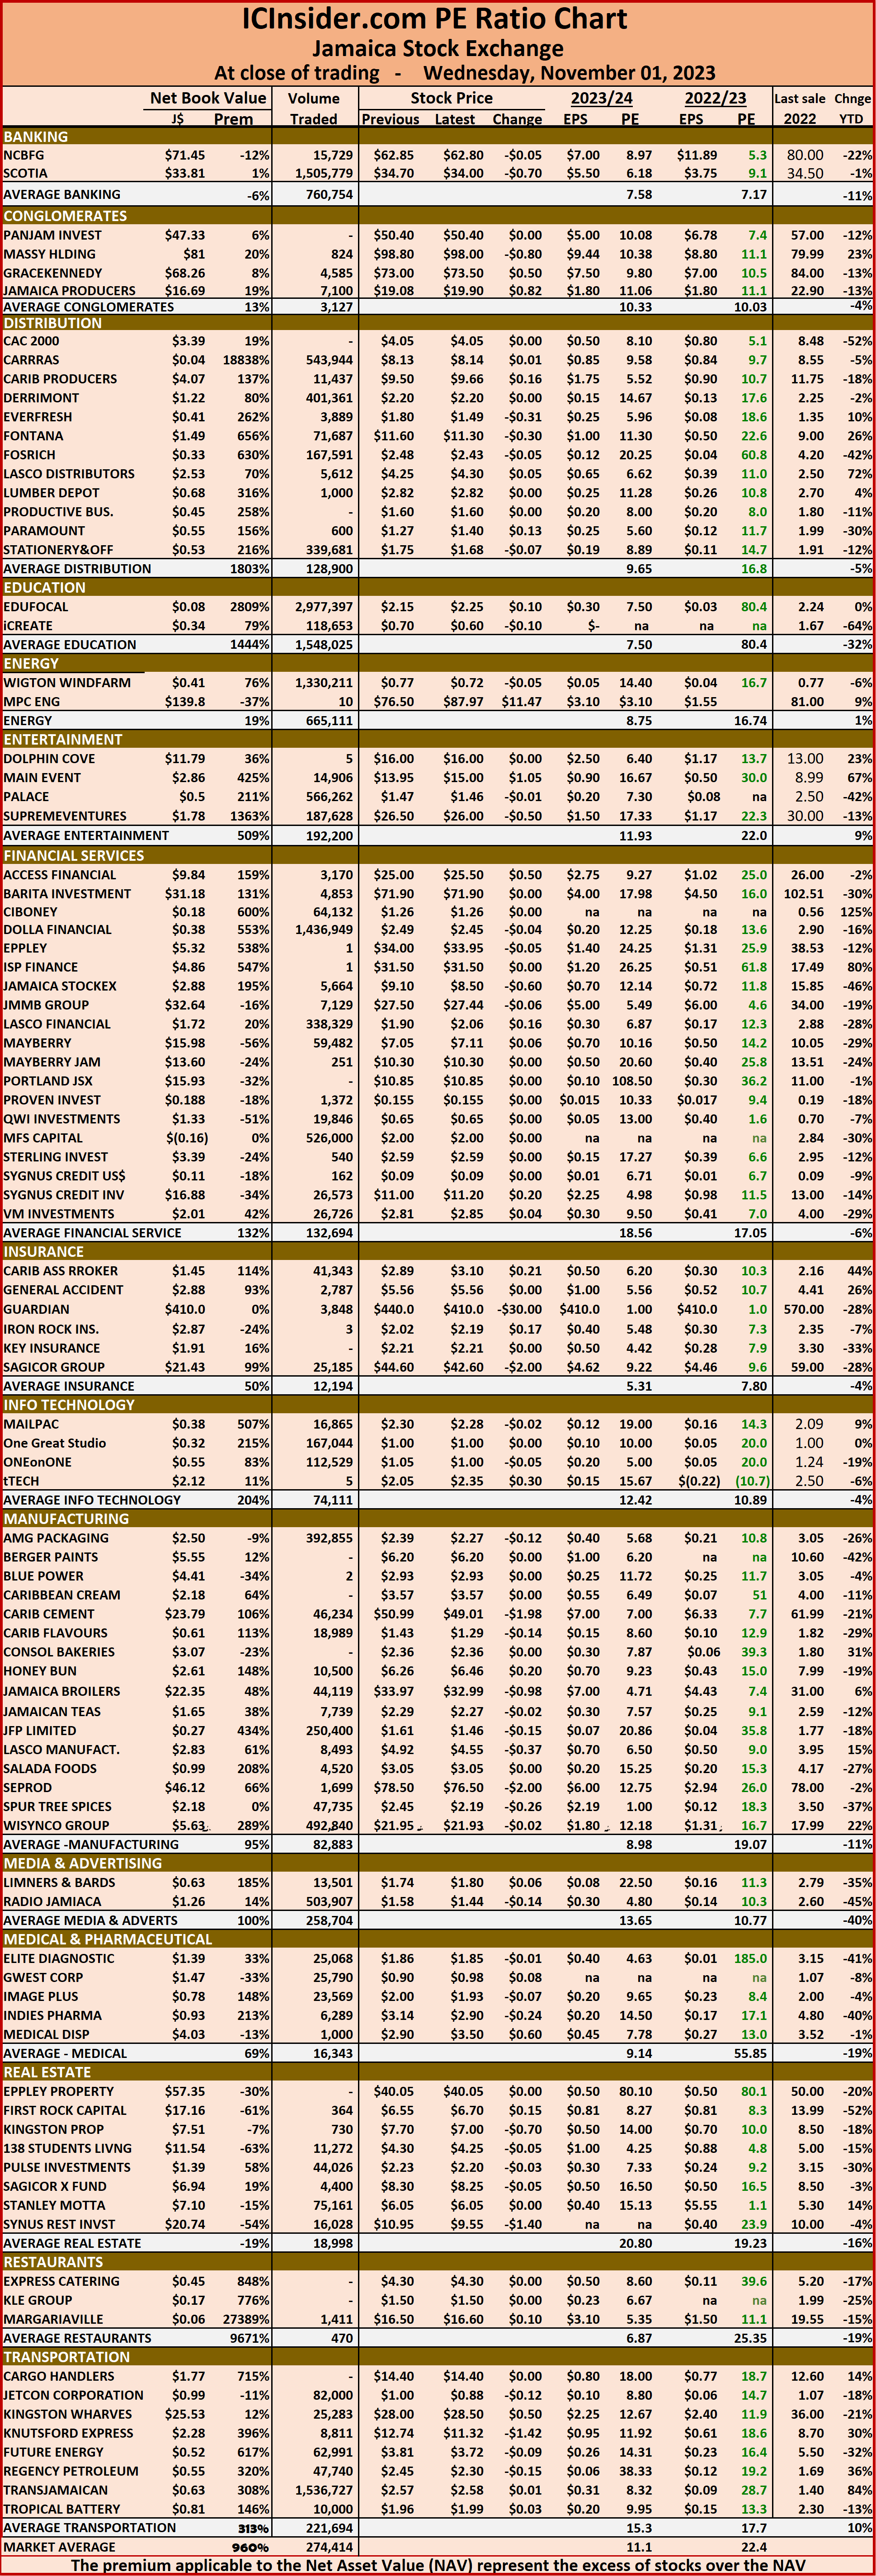
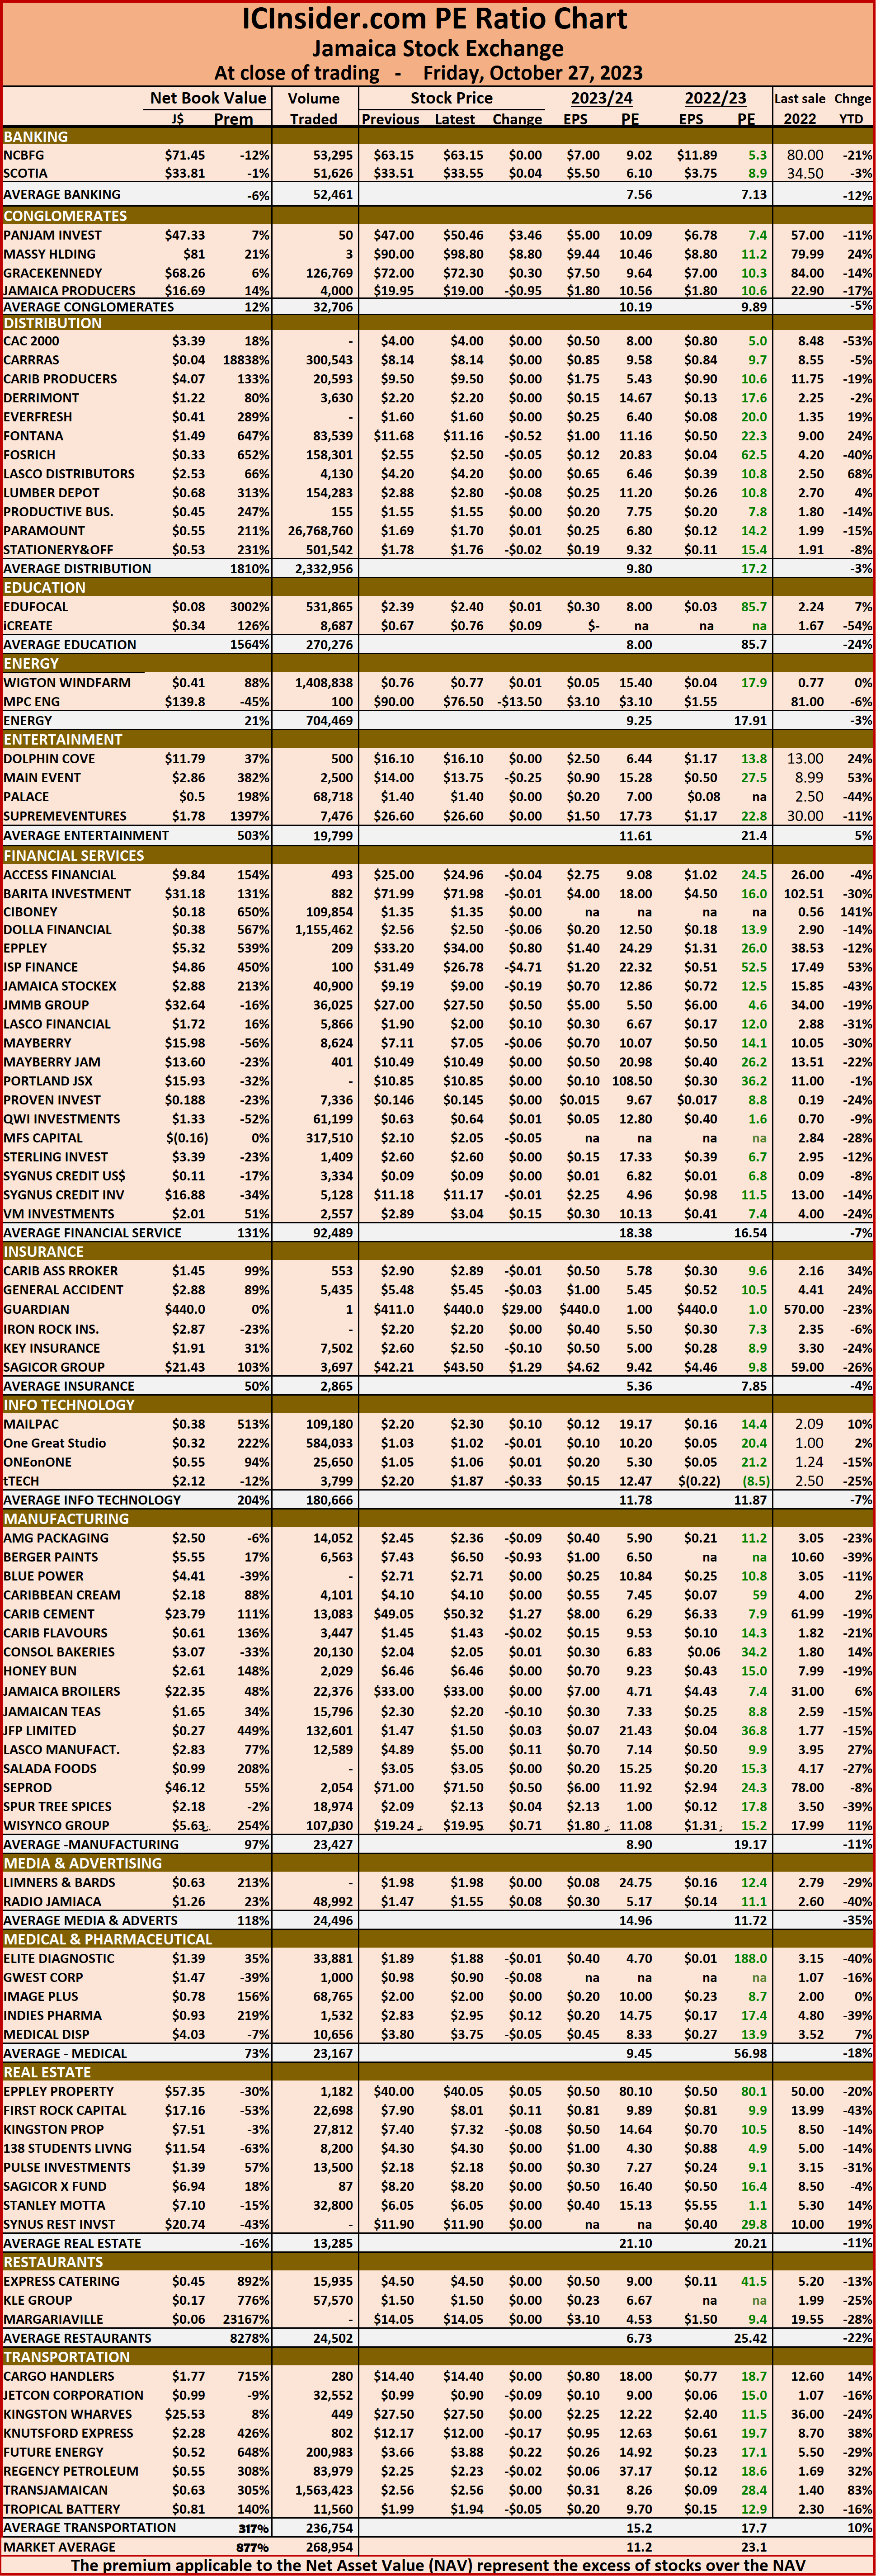
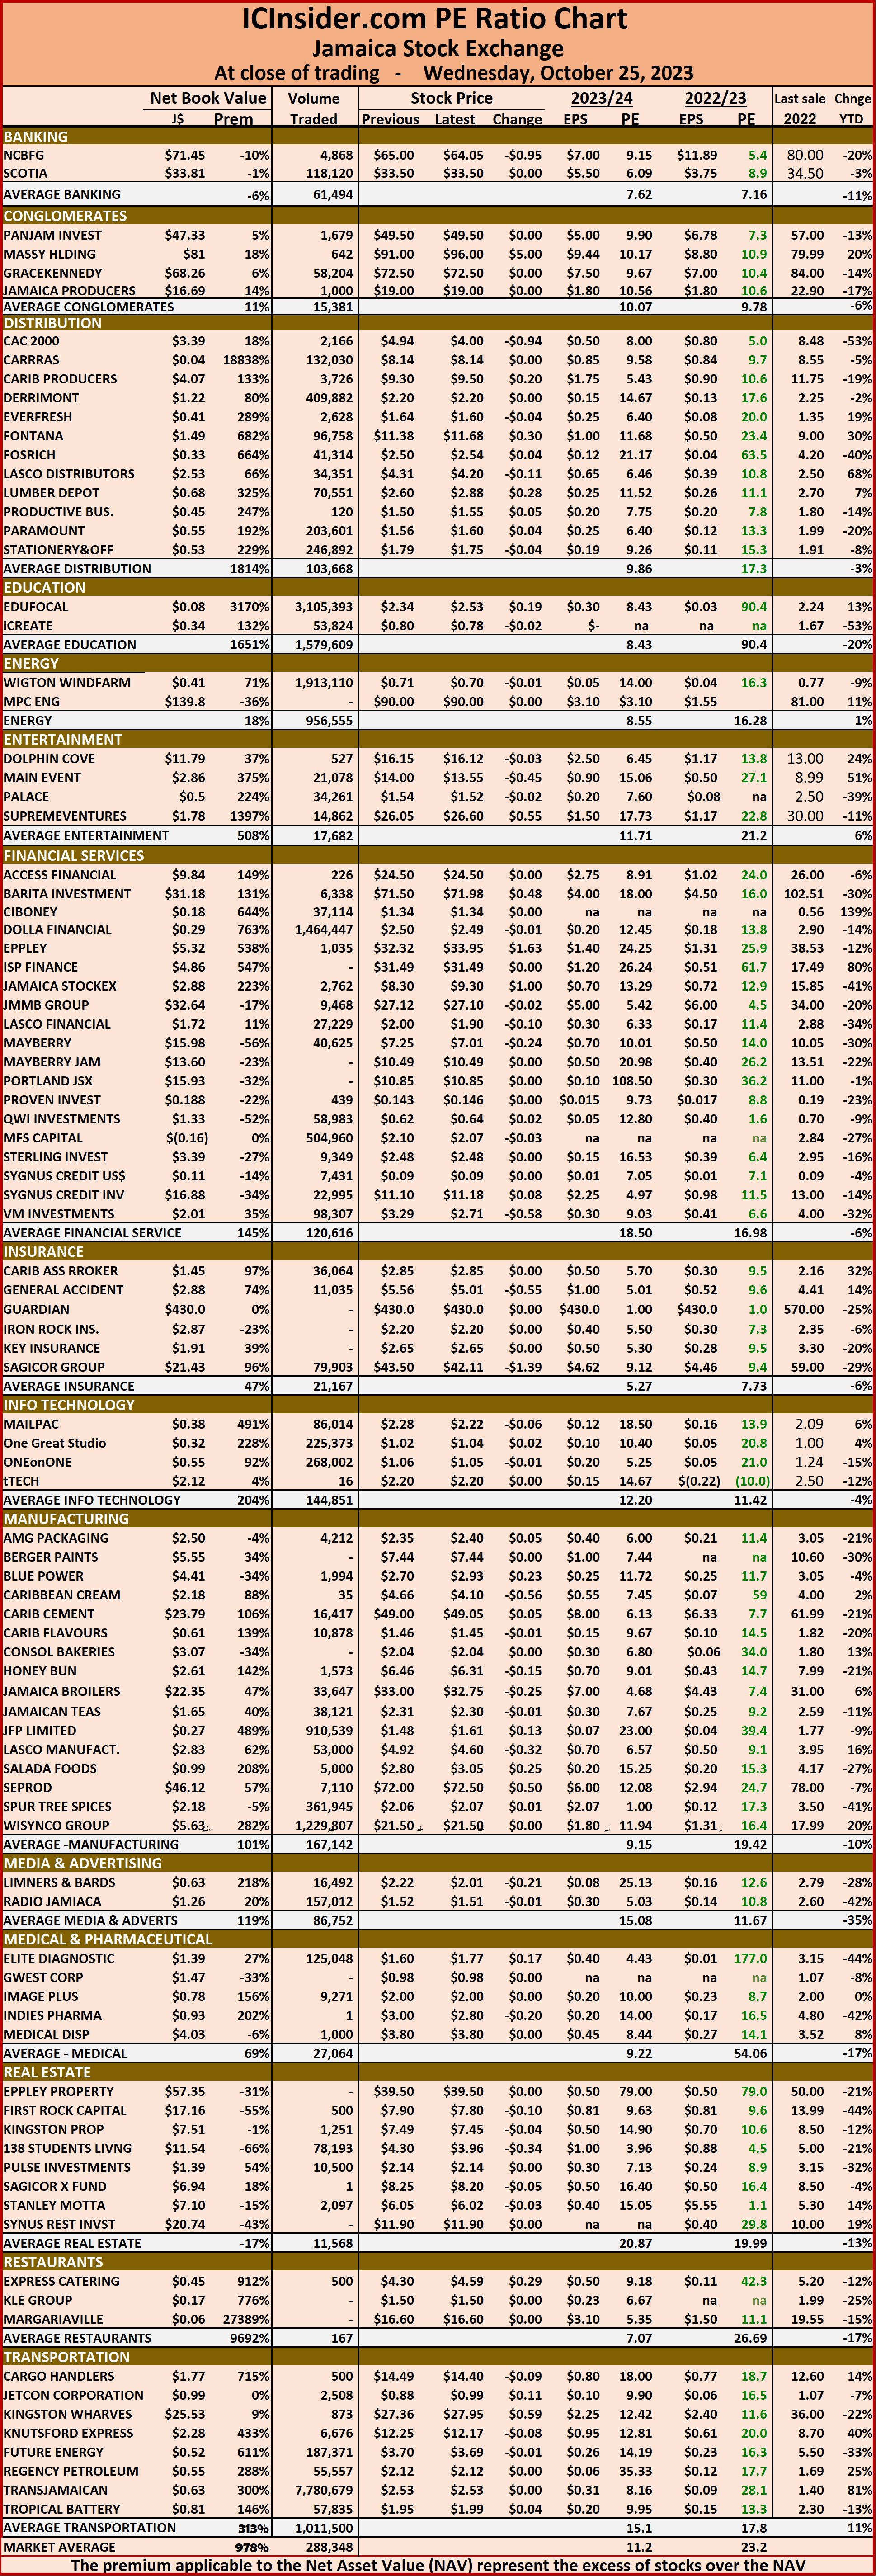
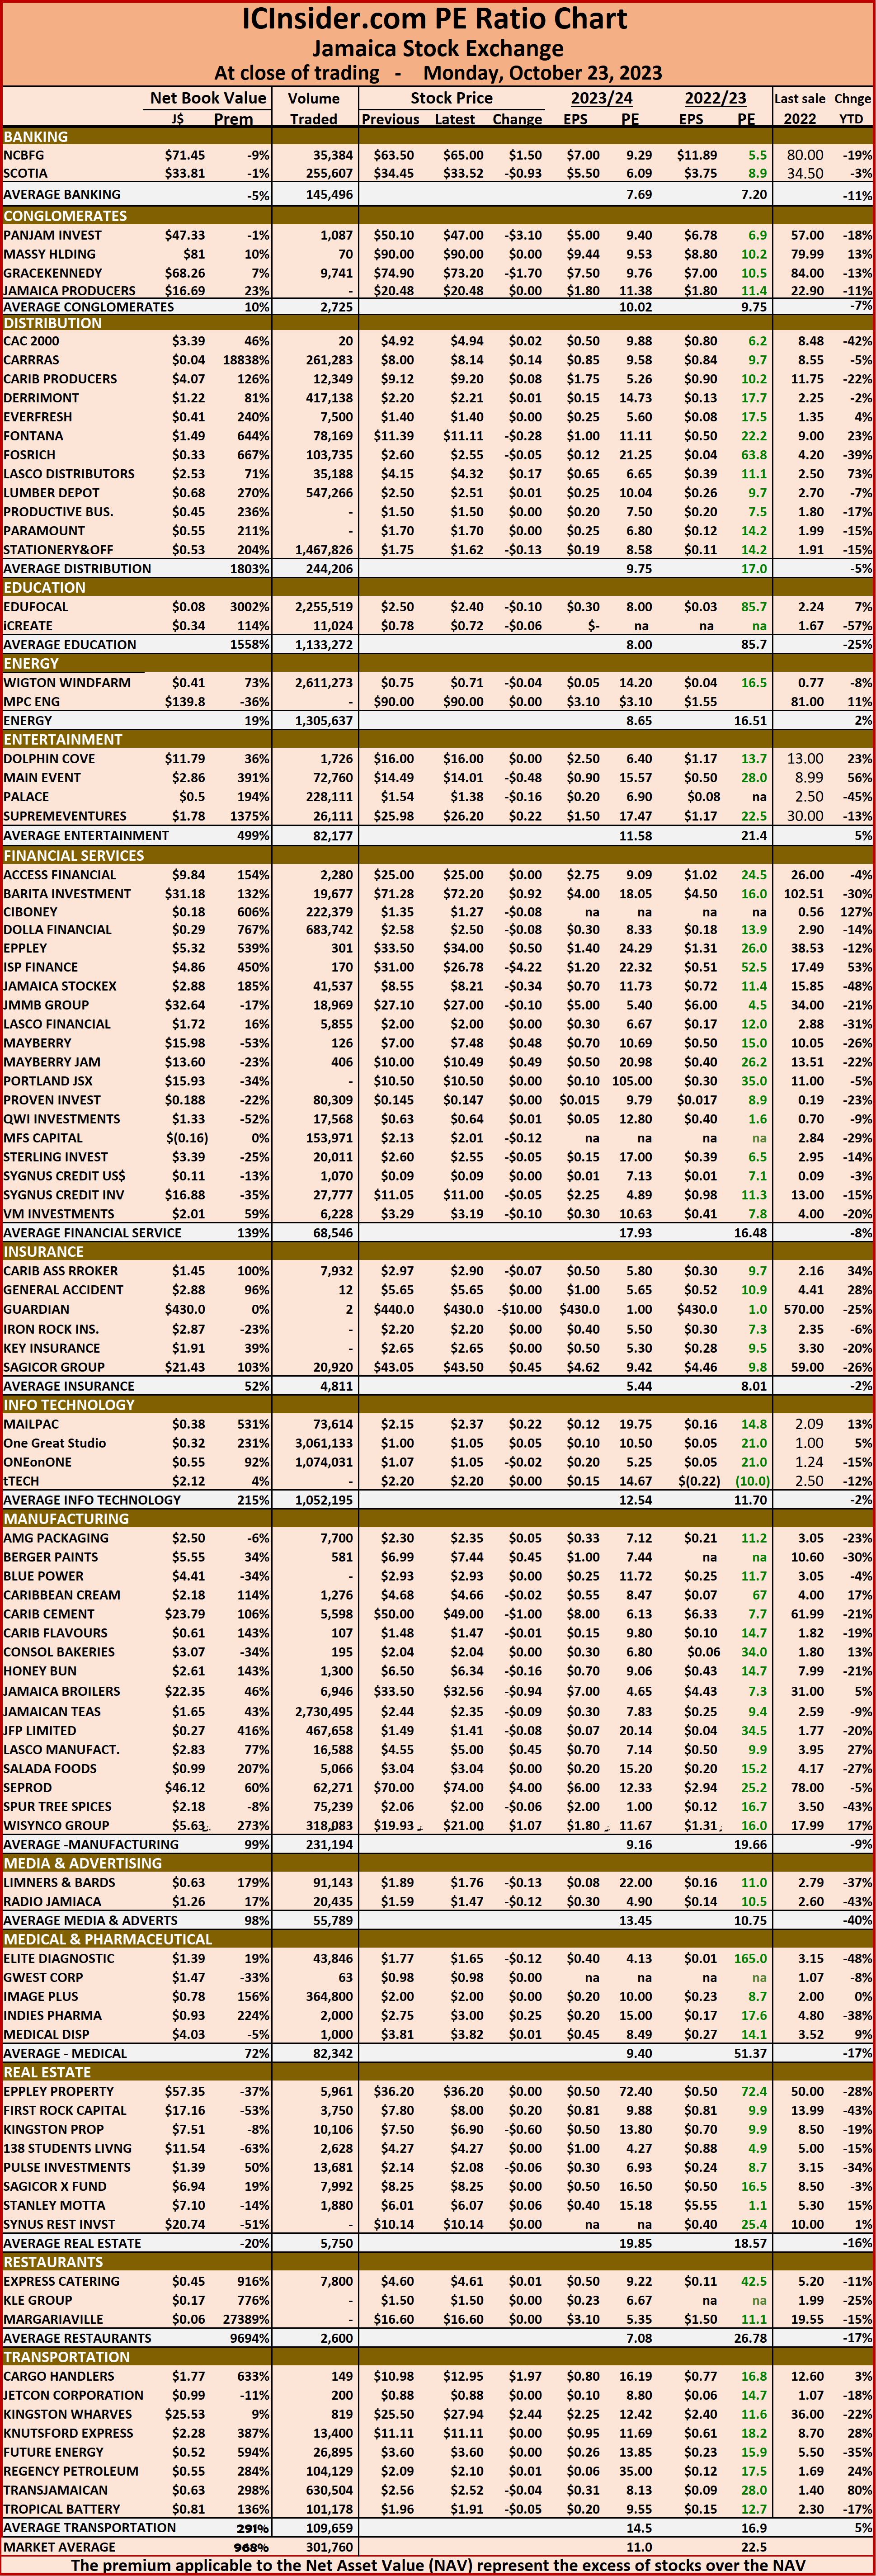
The market’s PE ratio, the most popular measure used to determine the value of stocks, ended at 22.6 on 2022-23 earnings and 11.1 times those for 2023-24 at the close of trading. 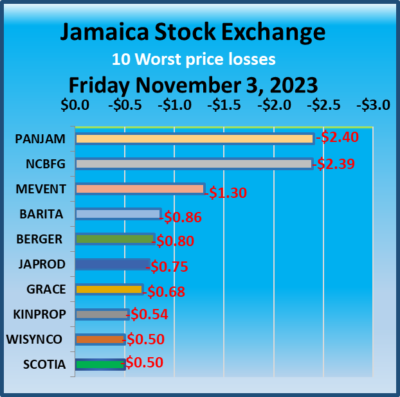 ICInsider.com PE ratio chart and the more detailed daily charts provide investors with regularly updated information to help decision-making.
The PE ratio chart covers all ordinary shares on the Jamaica Stock Exchange, grouped by industry, allowing for easy comparisons between the same sector companies and the overall market. The EPS & PE ratios are based on 2023 and 2024 actual or projected earnings, excluding major one off items.
Investors need pertinent information to successfully navigate numerous investment options in the local stock market. The ICInsider.com PE ratio chart and the more detailed daily report charts provide investors with regularly updated information to help decision-making.
Investors should use the chart to help make rational decisions when investing in stocks close to the average for the sector and not going too far from it unless there are compelling reasons to do so. This approach helps to remove emotions from investment decisions and place them on fundamentals while at the same time not being too far from the majority of investors. Investors who buy when the price of a stock is close to the average will find that they are not inclined to overpay for a stock.
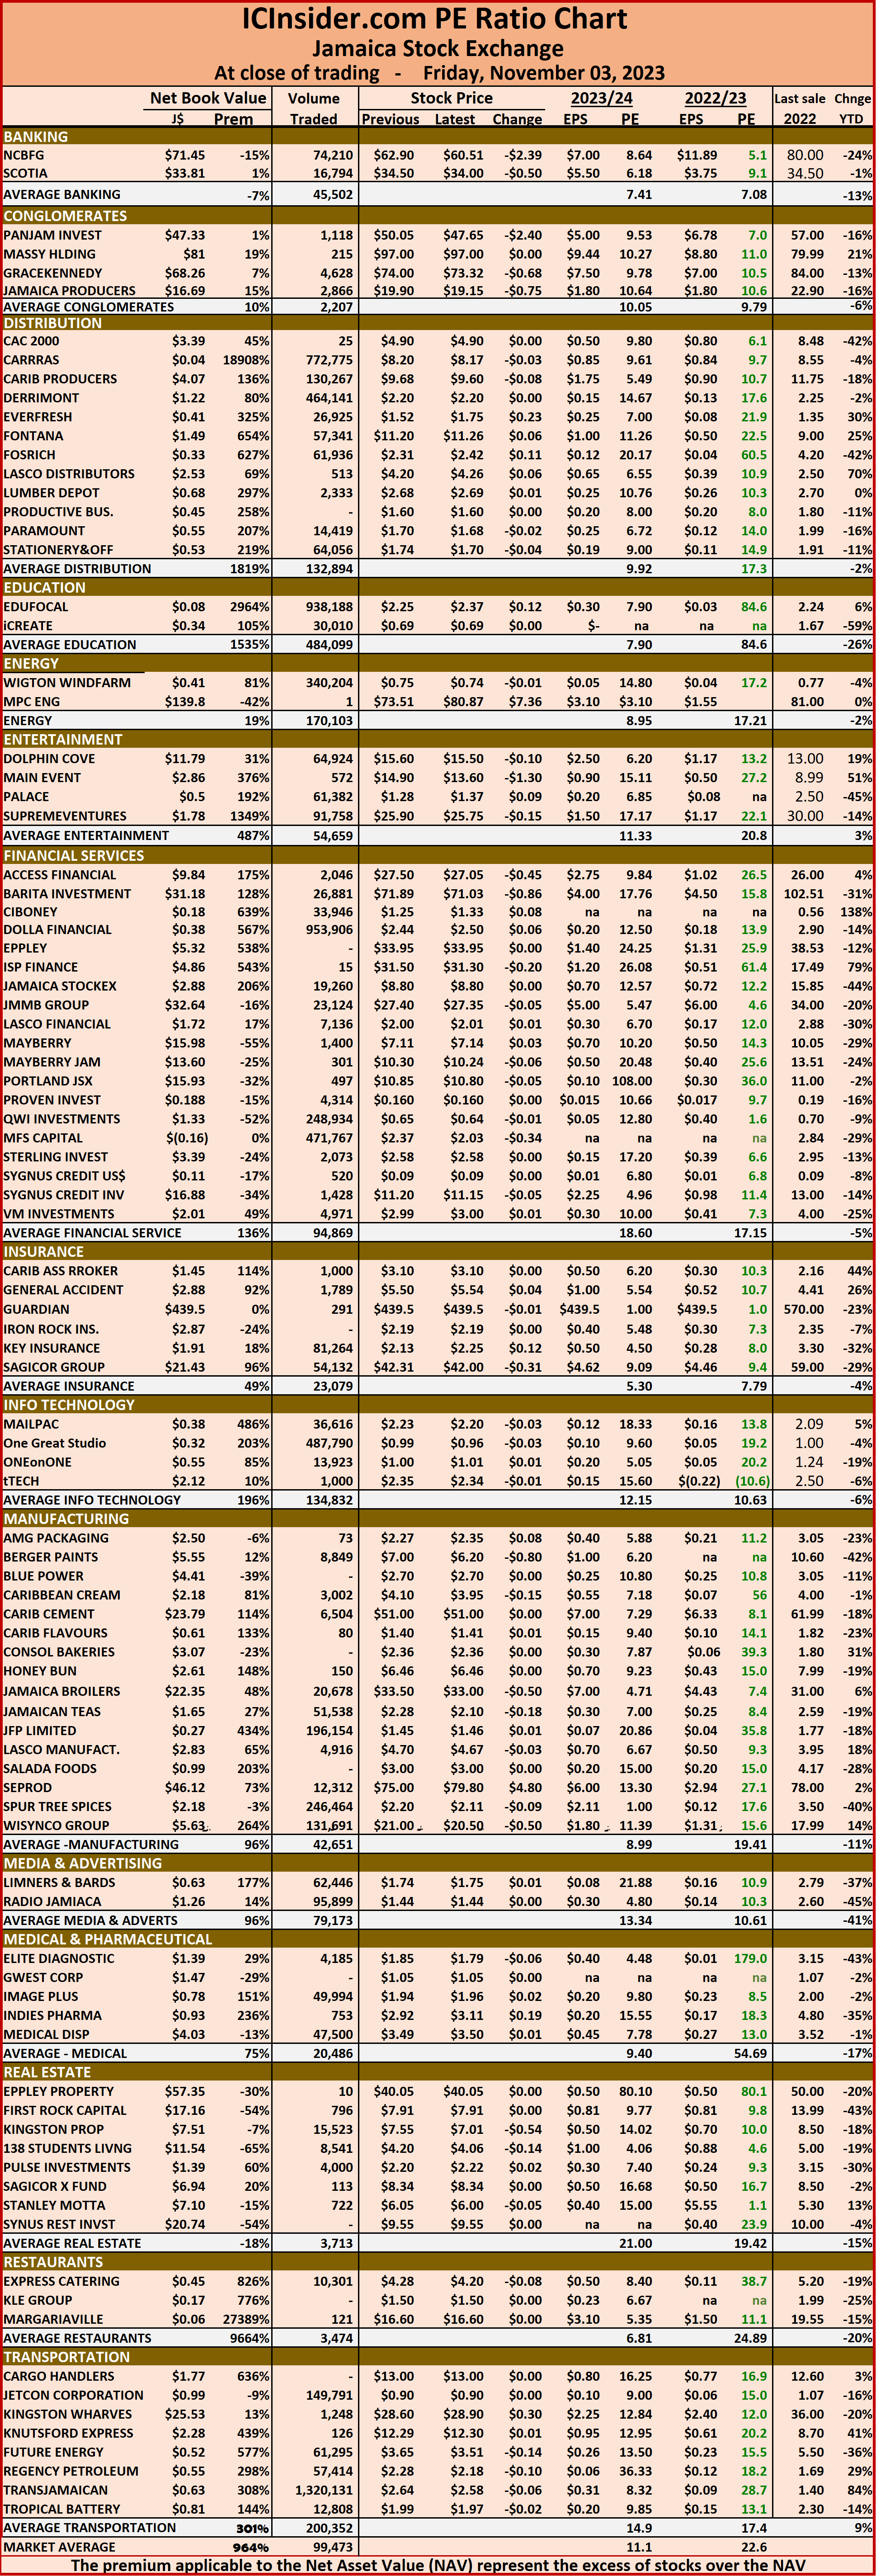 The net asset value of each company is reported as a guide to quickly assess the value of stocks based on this measure. The chart also shows daily changes in stock prices and the percentage year to date price movement based on the last traded prices.
Dividends paid or payable and yields for each company are shown in the Main and Junior Markets’ daily report charts, along with the closing volume pertaining to the highest bid and the lowest offer for each company.
JSE Main Market rises, Junior Market drops
The Jamaica Stock Exchange Main Market inched higher in trading on Thursday and the JSE USD Markets popped marginally higher but the Junior Market suffered a sold fall to close out the day, with a drop in volume of stocks traded but at a higher value than on Wednesday.
 At close, the JSE Combined Market Index rose 720.66 points to 329,968.51, the All Jamaican Composite Index popped 370.00 points to 349,099.70, the JSE Main Index climbed 1,202.56 points to close at 315,905.85. The Junior Market Index dropped 45.28 points to close at 3,847.42 and the JSE USD Market Index inched 0.03 points higher to end at 229.05.
Investors traded 10,303,204 shares in all markets, down from 16,178,017 stock units on Wednesday. The value of stocks traded rose on the Junior and Main markets to $114.36 million from $106.3 million on Wednesday. The JSE USD market closed after 191,624 shares were traded for US$7,484 compared to 73,498 units at US$5,221 on Wednesday.
In the preference segment, Jamaica Public Service 7% climbed $10 to end at $2,900.
The market’s PE ratio, the most popular measure used to determine the value of stocks, ended at 22.5 on 2022-23 earnings and 11.1 times those for 2023-24 at the close of trading. 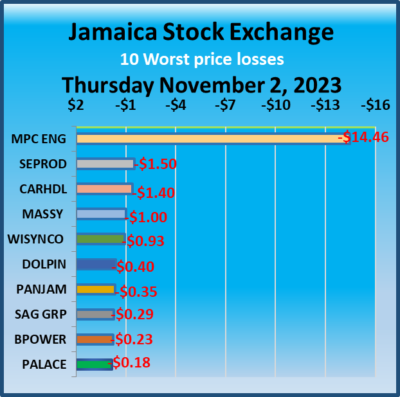 ICInsider.com PE ratio chart and the more detailed daily charts provide investors with regularly updated information to help decision-making.
The PE ratio chart covers all ordinary shares on the Jamaica Stock Exchange, grouped by industry, allowing for easy comparisons between the same sector companies and the overall market. The EPS & PE ratios are based on 2023 and 2024 actual or projected earnings, excluding major one off items.
Investors require pertinent information to successfully navigate investment options in the local stock market. The ICInsider.com PE ratio chart and the more detailed daily report charts provide investors with regularly updated information to help decision-making.
Investors should use the chart to help make rational decisions when investing in stocks close to the average for the sector and not going too far from it unless there are compelling reasons to do so. This approach helps to remove emotions from investment decisions and place them on fundamentals while at the same time not being too far from the majority of investors. Investors who buy when the price of a stock is close to the average will find that they are not inclined to overpay for a stock.
 The net asset value of each company is reported as a guide to quickly assess the value of stocks based on this measure. The chart also shows daily changes in stock prices and the percentage year to date price movement based on the last traded prices.
Dividends paid or payable and yields for each company are shown in the Main and Junior Markets’ daily report charts, along with the closing volume pertaining to the highest bid and the lowest offer for each company.
JSE Main Market drops, Juniors & JSEUSD markets rise
The Jamaica Stock Exchange Main Market closed to start the new month, with the leading indices dropping in trading on Wednesday. In contrast, JSE Junior and JSE USD Markets closed higher to start November positively, with a drop in the volume and value of stocks traded.
 At close, the JSE Combined Market Index dived 3,567.53 points to close at 329,247.85, while the All Jamaican Composite Index dropped 2,746.69 points to 348,729.70, the JSE Main Index sank 4,097.53 points to end trading at 314,703.29. The Junior Market Index rose 29.83 points to close at 3,892.70 and the JSE USD Market Index rallied 2.94 points to end at 229.02.
Investors traded only 16,178,017 shares in all three markets, down from 43,456,356 stock units on Tuesday. The value of stocks traded fell on the Junior and Main markets to $106.3 million from $162.09 million on Tuesday. The JSE USD market closed after 73,498 shares were traded for US$5,221 compared to 296,100 units at US$34,738 on Tuesday.
In the preference segment, Jamaica Public Service 7% gained $6.46 in closing at $48.46.
The market’s PE ratio, the most popular measure used to determine the value of stocks, ended at 22.4 on 2022-23 earnings and 11.1 times those for 2023-24 at the close of trading. ICInsider.com PE ratio chart and the more detailed daily charts provide investors with regularly updated information to help decision-making.
 The PE ratio chart covers all ordinary shares on the Jamaica Stock Exchange, grouped by industry, allowing for easy comparisons between the same sector companies and the overall market. The EPS & PE ratios are based on 2023 and 2024 actual or projected earnings, excluding major one off items.
Investors need pertinent information to navigate numerous investment options in the local stock market successfully. The ICInsider.com PE ratio chart and the more detailed daily report charts provide investors with regularly updated information to help decision-making.
Investors should use the chart to help make rational decisions when investing in stocks close to the average for the sector and not going too far from it unless there are compelling reasons to do so. This approach helps to remove emotions from investment decisions and place them on fundamentals while at the same time not being too far from the majority of investors. Investors who buy when the price of a stock is close to the average will find that they are not inclined to overpay for a stock.
 The net asset value of each company is reported as a guide to quickly assess the value of stocks based on this measure. The chart also shows daily changes in stock prices and the percentage year to date price movement based on the last traded prices.
Dividends paid or payable and yields for each company are shown in the Main and Junior Markets’ daily report charts, along with the closing volume pertaining to the highest bid and the lowest offer for each company.
Sizable gains for JSE Main Market on Tuesday
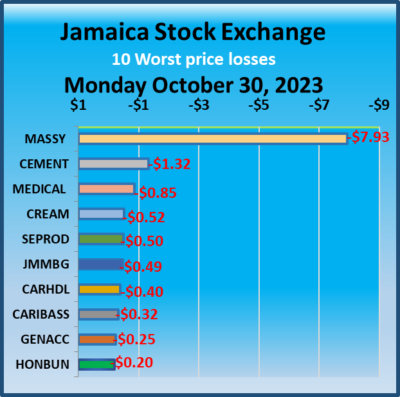
The Jamaica Stock Exchange Main market closed trading on Tuesday and October with big indices rally and JSE Junior and JSE USD Markets bounced at the close in ending higher than on Monday, with increased volume and value of stocks trading, with all Market Indices closing lower than the end of September.
 At close, the JSE Combined Market Index popped 4,618.54 points to close at 332,815.38, the All Jamaican Composite Index surged 4,665.94 points to 351,476.39, the JSE Main Index rallied 4,914.30 points to end October at 318,800.82. The Junior Market Index rose 2.26 points to close at 3,862.87 and the JSE USD Market Index climbed 12.75 points to close out October at 226.08.
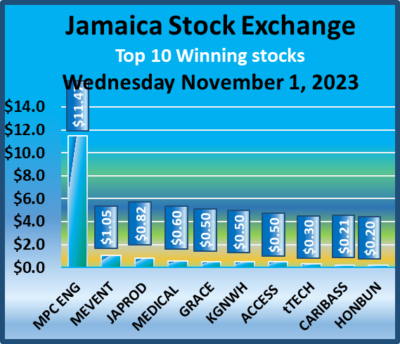
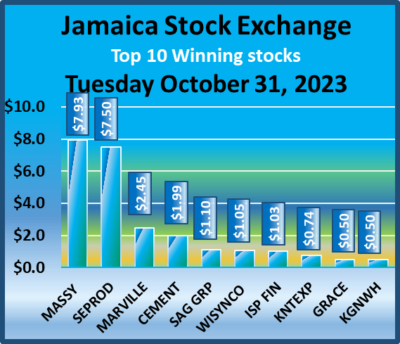
The significant increase in the Main Market indices was due to big price movements in Massy Holdings, up $7.93, followed by Seprod, with a gain of $7.50, Margaritaville with a rise of $2.47 Caribbean Cement $1.99 and Wisynco up $1.05.
Investors traded 43,456,356 shares in all three markets, down from 50,369,942 stock units on Monday. The value of stocks traded rose on the Junior and Main markets to $162.09 million from $158.25 million on Monday. The JSE USD market closed after 296,100 shares were sold for US$34,738 compared to 131,600 units at US$3,492 on Monday.
In the preference segment, Jamaica Public Service 7% skidded $3.22 to $42 and Productive Business Solutions 9.75% preference share dropped $1 to close at $122.
 The market’s PE ratio, the most popular measure used to determine the value of stocks, ended at 22.5 on 2022-23 earnings and 11.2 times those for 2023-24 at the close of trading. ICInsider.com PE ratio chart and the more detailed daily charts provide investors with regularly updated information to help decision-making.
The PE ratio chart covers all ordinary shares on the Jamaica Stock Exchange, grouped by industry, allowing for easy comparisons between the same sector companies and the overall market. The EPS & PE ratios are based on 2023 and 2024 actual or projected earnings, excluding major one off items.
Investors need pertinent information to successfully navigate numerous investment options in the local stock market. The ICInsider.com PE ratio chart and the more detailed daily report charts provide investors with regularly updated information to help decision-making.
Investors should use the chart to help make rational decisions when investing in stocks close to the average for the sector and not going too far from it unless there are compelling reasons to do so. This approach helps to remove emotions from investment decisions and place them on fundamentals while at the same time not being too far from the majority of investors. Investors who buy when the price of a stock is close to the average will find that they are not inclined to overpay for a stock.
 The net asset value of each company is reported as a guide to quickly assess the value of stocks based on this measure. The chart also shows daily changes in stock prices and the percentage year to date price movement based on the last traded prices.
Dividends paid or payable and yields for each company are shown in the Main and Junior Markets’ daily report charts, along with the closing volume pertaining to the highest bid and the lowest offer for each company.
Fall for all JSE Markets on Monday
Trading on the Jamaica Stock Exchange on Monday jumped sharply over Friday’s levels as the Junior Market activity dominated with trading of 44,475,233 shares for $142,291,683 and overshadowing trading in the JSE Main Market, but the markets ended trading with the JSE USD and the Junior Market index plunging and the JSE Market index slipping to close out the day.
 At close, the JSE Combined Market Index dropped 1,952.40 points to 328,196.84, while the All Jamaican Composite Index slipped 9.86 points to end at 346,810.45, the JSE Main Index dropped 1,512.64 points to 313,886.52. The Junior Market Index dived 60.10 points to 3,860.61 and the JSE USD Market Index declined 12.69 points to conclude trading at 213.33.
Investors traded 50,369,942 shares in all three markets, up from 36,643,282 stock units on Friday. The value of stocks traded rose on the Junior and Main markets to $158.25 million from $87 million on Friday. The JSE USD market closed after 131,600 shares were traded for US$3,492 compared to 31,673 units at US$7,572 on Friday.
In the preference segment, Jamaica Public Service 7% shed $4.68 to close at $45.22, 138 Student Living preference share advanced $12 and ended at $107 and Productive Business Solutions 9.75% preference share dipped $2 in closing at $123.
 The market’s PE ratio, the most popular measure used to determine the value of stocks, ended at 22.7 on 2022-23 earnings and 11.1 times those for 2023-24 at the close of trading. ICInsider.com PE ratio chart and the more detailed daily charts provide investors with regularly updated information to help decision-making.
The PE ratio chart covers all ordinary shares on the Jamaica Stock Exchange, grouped by industry, allowing for easy comparisons between the same sector companies and the overall market. The EPS & PE ratios are based on 2023 and 2024 actual or projected earnings, excluding major one off items.
Investors need pertinent information to successfully navigate numerous investment options in the local stock market. The ICInsider.com PE ratio chart and the more detailed daily report charts provide investors with regularly updated information to help decision-making.
Investors should use the chart to help make rational decisions when investing in stocks close to the average for the sector and not going too far from it unless there are compelling reasons to do so.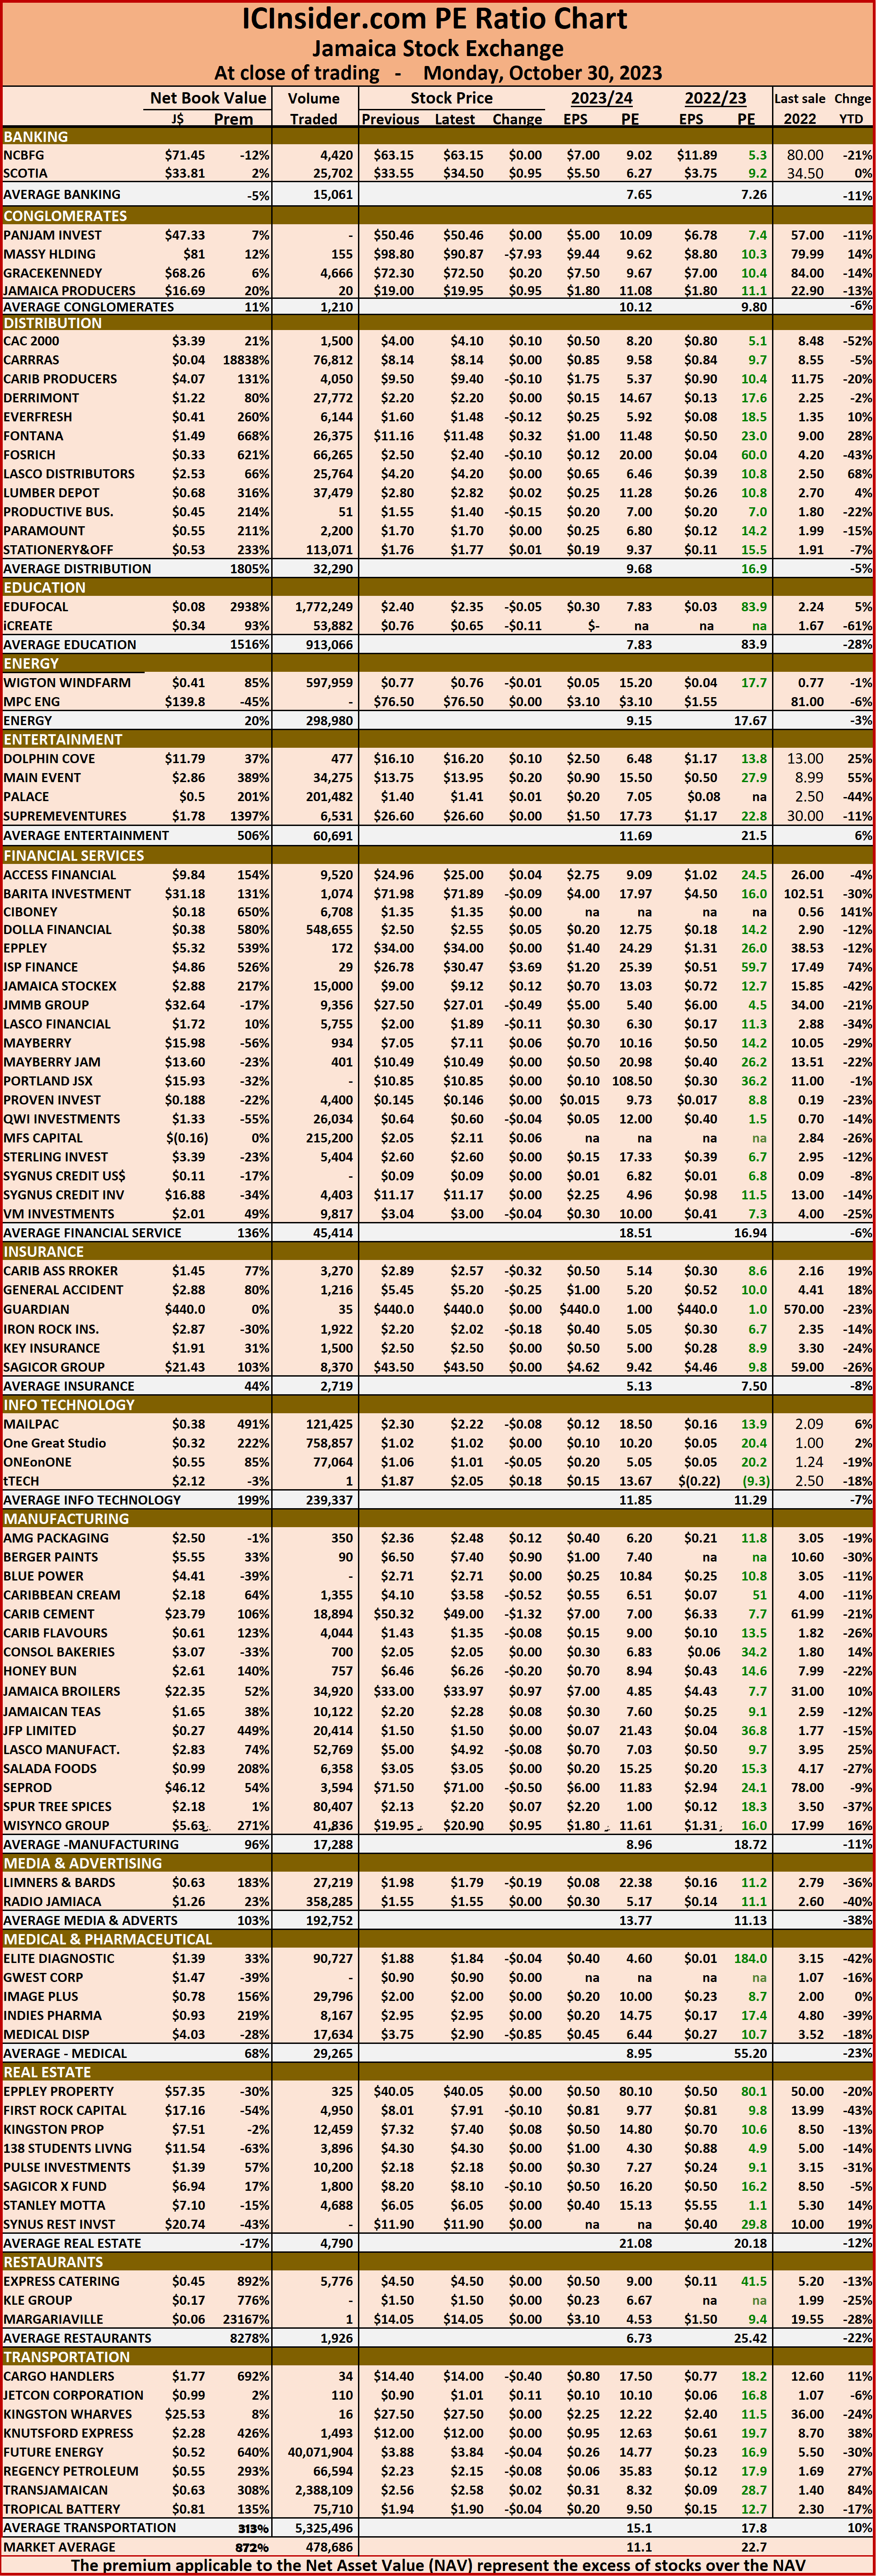 This approach helps to remove emotions from investment decisions and place them on fundamentals while at the same time not being too far from the majority of investors. Investors who buy when the price of a stock is close to the average will find that they are not inclined to overpay for a stock.
The net asset value of each company is reported as a guide to assess the value of stocks based on this measure quickly. The chart also shows daily changes in stock prices and the percentage year to date price movement based on the last traded prices.
Dividends paid or payable and yields for each company are shown in the Main and Junior Markets’ daily report charts, along with the closing volume pertaining to the highest bid and the lowest offer for each company.
Trading rises on the Jamaica Stock Exchange
The value of stocks traded declined on the Jamaica Stock Exchange on Friday, but the volume surged from the levels on Thursday and ended with the JSE Main Market and the JSE USD rising as the Junior Market index closed down but remained above the 3,900 points mark for a second day.
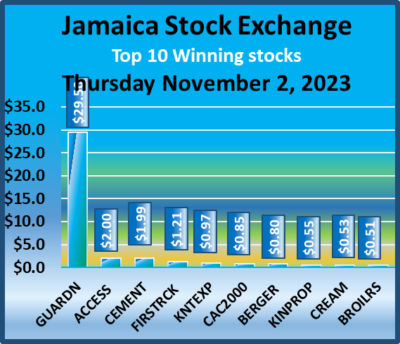
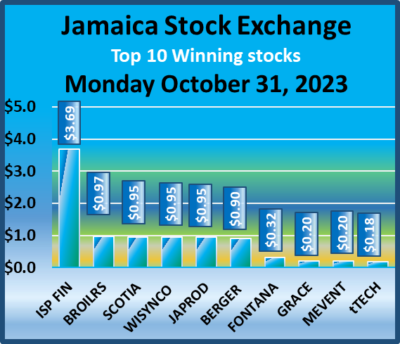
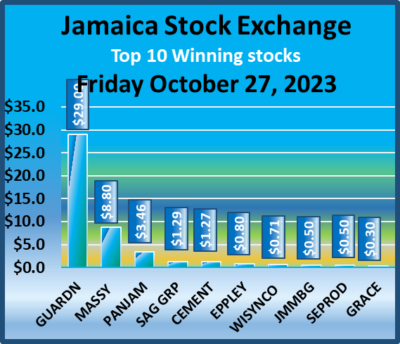
The rise of Main Market indices was pushed mainly by Guardian Holdings, up $29, Massy Holdings with the rise of $8.80, Pan Jamaica with $3.46, followed by Sagicor Group, adding $1.29 to Thursday‘s price and Caribbean Cement, up $1.27.
 At close, the JSE Combined Market Index added 3,257.76 points to close at 330,149.24, while the All Jamaican Composite Index popped 168.58 points to settle at 346,820.31, the JSE Main Index increased 3,589.20 points to 315,399.16. The Junior Market Index slipped 11.26 points to 3,920.71 and the JSE USD Market Index rose 0.42 points to settle at 226.02.
Investors traded 36,643,282 shares in all three markets, up from 22,006,435 stock units on Thursday. The value of stocks traded slipped on the Junior and Main markets to $87 million from $98 million on Thursday. The JSE USD market ended trading after 31,673 shares were traded, for US$7,572 compared to 218,678 units at US$7,411 on Thursday.
In the preference segment, Jamaica Public Service 9.5% dropped $9 to end at $2890 and Productive Business Solutions 9.75% preference share increased $4.25 to close at $125.
 The market’s PE ratio, the most popular measure used to determine the value of stocks, ended at 23.1 on 2022-23 earnings and 11.2 times those for 2023-24 at the close of trading. ICInsider.com PE ratio chart and the more detailed daily charts provide investors with regularly updated information to help decision-making.
The PE ratio chart covers all ordinary shares on the Jamaica Stock Exchange, grouped by industry, allowing for easy comparisons between the same sector companies and the overall market. The EPS & PE ratios are based on 2023 and 2024 actual or projected earnings, excluding major one off items.
Investors need pertinent information to navigate numerous investment options in the local stock market successfully. The ICInsider.com PE ratio chart and the more detailed daily report charts provide investors with regularly updated information to help decision-making.
Investors should use the chart to help make rational decisions when investing in stocks close to the average for the sector and not going too far from it unless there are compelling reasons to do so. This approach helps to remove emotions from investment decisions and place them on fundamentals while at the same time not being too far from the majority of investors. Investors who buy when the price of a stock is close to the average will find that they are not inclined to overpay for a stock.
 The net asset value of each company is reported as a guide to assess the value of stocks based on this measure quickly. The chart also shows daily changes in stock prices and the percentage year to date price movement based on the last traded prices.
Dividends paid or payable and yields for each company are shown in the Main and Junior Markets’ daily report charts, along with the closing volume pertaining to the highest bid and the lowest offer for each company.
Trading rises on the Jamaica Stock Exchange
The value of stocks traded rose on the Jamaica Stock Exchange on Thursday, but the volume slipped marginally from the levels on Wednesday but the market closed mixed on Thursday, with the JSE USD and the Junior markets closing higher, but the Main Market finished lower.
 At close, the JSE Combined Market Index shed 1,272.78 points higher to close at 326,891.48, the All Jamaican Composite Index dipped 951.42 points to settle at 346,651.73, the JSE Main Index lost 1,727.61 points to close at 311,809.96. The Junior Market Index rallied 38.47 points to 3,931.97 and the JSE USD Market Index rose 0.77 points to settle at 225.60.
Investors traded 22,006,435 shares in all three markets, marginally down on the 22,396,453 stocks on Wednesday. The value of stocks traded rose on the Junior and Main markets to $98 million from $88.4 million on Wednesday. The JSE USD market ended trading after 218,678 shares were traded, for US$7,411, compared to 194,347 units at US$314,203 on Wednesday.
In the preference, segment had no stocks with notable price changes.
The market’s PE ratio, the most popular measure used to determine the value of stocks, ended at 23.1 on 2022-23 earnings and 11.2 times those for 2023-24 at the close of trading. ICInsider.com PE ratio chart and the more detailed daily charts provide investors with regularly updated information to help decision-making.
The PE ratio chart covers all ordinary shares on the Jamaica Stock Exchange, grouped by industry, allowing for easy comparisons between the same sector companies and the overall market. The EPS & PE ratios are based on 2023 and 2024 actual or projected earnings, excluding major one off items.
Investors need pertinent information to navigate numerous investment options in the local stock market successfully. The ICInsider.com PE ratio chart and the more detailed daily report charts provide investors with regularly updated information to help decision-making.
Investors should use the chart to help make rational decisions when investing in stocks close to the average for the sector and not going too far from it unless there are compelling reasons to do so. This approach helps to remove emotions from investment decisions and place them on fundamentals while at the same time not being too far from the majority of investors.  Investors who buy when the price of a stock is close to the average will find that they are not inclined to overpay for a stock.
The net asset value of each company is reported as a guide to assess the value of stocks based on this measure quickly. The chart also shows daily changes in stock prices and the percentage year to date price movement based on the last traded prices.
Dividends paid or payable and yields for each company are shown in the Main and Junior Markets’ daily report charts, along with the closing volume pertaining to the highest bid and the lowest offer for each company.
Trading bounced on Jamaica Stock Exchange
Trading bounced on the Jamaica Stock Exchange on Wednesday from the depressed levels on Tuesday when just 13.3 million shares changed hands valued at a mere $30 million, but the market closed mixed on Wednesday, with the JSE USD Market inching higher and broke six consecutive days of decline with Main Market inching lower, while the Junior Market slipped to close just under the 3,900 mark.
 At close, the JSE Combined Market Index shed 740.51 points higher to close at 328,164.26, the All Jamaican Composite Index popped 309.44 points to 347,603.15, the JSE Main Index shed 524.74 points to conclude trading at 313,537.57. The Junior Market Index declined 27.93 points to conclude trading at 3,893.50 and the JSE USD Market Index, after falling for the sixth consecutive days, advanced 2.49 points to end trading at 224.83.
Investors traded 22,396,453 shares in all three markets, up from 13,288,537 stock units on Tuesday. The value of stocks traded fell on the Junior and Main markets to $88.4 million, up from $30.29 million on Tuesday. The JSE USD market ended trading after 194,347 shares were traded, for US$314,203, compared to 212,100 units at US$6,287 on Tuesday.
In the preference segment had no stocks with notable price changes.
 The market’s PE ratio, the most popular measure used to determine the value of stocks, ended at 23.2 on 2022-23 earnings and 11.2 times those for 2023-24 at the close of trading. ICInsider.com PE ratio chart and the more detailed daily charts provide investors with regularly updated information to help decision-making.
The PE ratio chart covers all ordinary shares on the Jamaica Stock Exchange, grouped by industry, allowing for easy comparisons between the same sector companies and the overall market. The EPS & PE ratios are based on 2023 and 2024 actual or projected earnings, excluding major one off items.
Investors need pertinent information to navigate numerous investment options in the local stock market successfully. The ICInsider.com PE ratio chart and the more detailed daily report charts provide investors with regularly updated information to help decision-making.
Investors should use the chart to help make rational decisions when investing in stocks close to the average for the sector and only going too far from it if there are compelling reasons to do so. This approach helps to remove emotions from investment decisions and place them on fundamentals while at the same time not being too far from the majority of investors. Investors who buy when the price of a stock is close to the average will find that they are not inclined to overpay for a stock.
 The net asset value of each company is reported as a guide to assess the value of stocks based on this measure quickly. The chart also shows daily changes in stock prices and the percentage year to date price movement based on the last traded prices.
Dividends paid or payable and yields for each company are shown in the Main and Junior Markets’ daily report charts, along with the closing volume pertaining to the highest bid and the lowest offer for each company.
JSE Main and Junior Market climb on Tuesday
Trading on the Jamaica Stock Exchange Is well down on trading on Tuesday with just 13.3 million shares changing hands valued at just over $30 million, but the market closed higher than the close on Monday, with the Main Market and the Junior Market climbing solidly but the JSE USD Market slipped for a 6th consecutive day.
 At close, the JSE Combined Market Index climbed 2,615.44 points higher to 328,904.77, while the All Jamaican Composite Index rose just 262.79 points to 347,293.71, the JSE Main Index jumped 2,426.08 points to close at 314,062.31. The Junior Market Index surged 38.66 points to settle at 3,921.43 and the JSE USD Market Index declined for a sixth consecutive day after dipping 0.75 points to 222.34.
Investors traded 13,288,537 shares in all three markets, up from 21,002,315 stock units on Monday. The value of stocks traded fell on the Junior and Main markets to $30.29 million from $62.5 million on Monday. The JSE USD market ended trading after 212,100 shares were traded, for US$6,287, down from 1,287,632 units at US$32,552 on Monday.
The preference segment had no stocks with a notable price change.
 The market’s PE ratio, the most popular measure used to determine the value of stocks, ended at 22.5 on 2022-23 earnings and 11.3 times those for 2023-24 at the close of trading. ICInsider.com PE ratio chart and the more detailed daily charts provide investors with regularly updated information to help decision-making.
The PE ratio chart covers all ordinary shares on the Jamaica Stock Exchange, grouped by industry, allowing for easy comparisons between the same sector companies and the overall market. The EPS & PE ratios are based on 2023 and 2024 actual or projected earnings, excluding major one off items.
Investors need pertinent information to successfully navigate numerous investment options in the local stock market. The ICInsider.com PE ratio chart and the more detailed daily report charts provide investors with regularly updated information to help decision-making.
Investors should use the chart to help make rational decisions when investing in stocks close to the average for the sector and only going too far from it if there are compelling reasons to do so. This approach helps to remove emotions from investment decisions and place them on fundamentals while at the same time not being too far from the majority of investors. Investors who buy when the price of a stock is close to the average will find that they are not inclined to overpay for a stock.
 The net asset value of each company is reported as a guide to assess the value of stocks based on this measure quickly. The chart also shows daily changes in stock prices and the percentage year to date price movement based on the last traded prices.
Dividends paid or payable and yields for each company are shown in the Main and Junior Markets’ daily report charts, along with the closing volume pertaining to the highest bid and the lowest offer for each company.
Jamaican stocks start week with mixed results
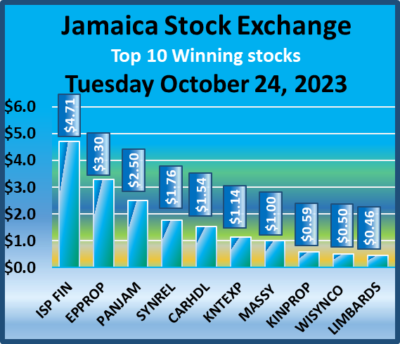
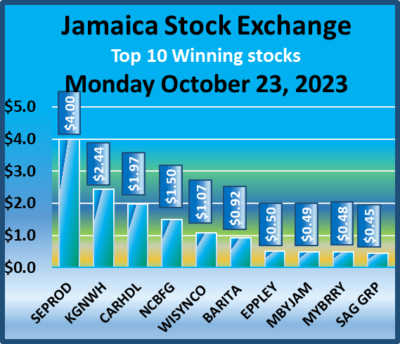
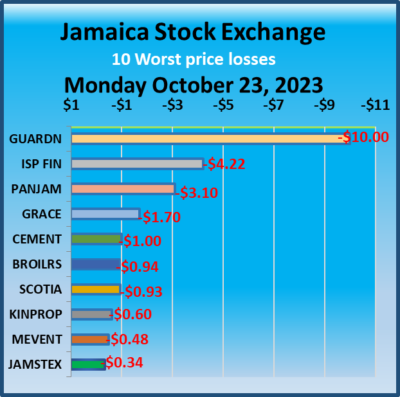
Seprod bounced $4 on the Main Market of the Jamaica Stock Exchange on Monday and was followed by Kingston Wharves with a gain of $2.44, NCB Financial Group up by $1.50 with Barita Investments coming in with the 92 cents gain in helping to lift the Main Market on Monday after Guardian Holdings fell $10, followed by Pan Jamaica $3.10, GraceKennedy down $1.70, Caribbean Cement skidded $1, Jamaica Broilers 94 cents and Scotia Group down 93 cents.
 The three markets closed mixed on Monday in trading on the Jamaica Stock Exchange, with more stocks trading than on Friday but valued slightly below Friday’s trades.
At close, the JSE Combined Market Index inched 67.56 points higher to 326,289.33, while the All Jamaican Composite Index popped 813.68 points to finish at 347,030.92, the JSE Main Index rallied 136.65 points to close at 311,636.23. The Junior Market Index shed 6.75 points to settle at 3,882.77 and the JSE USD Market Index declined for a fifth consecutive day after skidding 1.23 points to close at 223.09.
Investors exchanged 21,002,315 shares in all three markets, up from 17,117,345 stock units on Friday. The value of stocks traded fell on the Junior and Main markets to $62.5 million from $66.9 million on Friday. The JSE USD market ended trading with 1,287,632 shares at US$32,552 compared to 390,785 units at US$54,548 on Friday.
 In the preference segment, Jamaica Public Service 7% added $7.88 to close at $49.90.
The market’s PE ratio, the most popular measure used to determine the value of stocks, ended at 22.5 on 2022-23 earnings and 11 times those for 2023-24 at the close of trading. ICInsider.com PE ratio chart and the more detailed daily charts provide investors with regularly updated information to help decision-making.
The PE ratio chart covers all ordinary shares on the Jamaica Stock Exchange, grouped by industry, allowing for easy comparisons between the same sector companies and the overall market. The EPS & PE ratios are based on 2023 and 2024 actual or projected earnings, excluding major one off items.
Investors need pertinent information to successfully navigate numerous investment options in the local stock market. The ICInsider.com PE ratio chart and the more detailed daily report charts provide investors with regularly updated information to help decision-making.
Investors should use the chart to help make rational decisions when investing in stocks close to the average for the sector and not going too far from it unless there are compelling reasons to do so. This approach helps to remove emotions from investment decisions and place them on fundamentals while at the same time not being too far from the majority of investors. Investors who buy when the price of a stock is close to the average will find that they are not inclined to overpay for a stock.
 The net asset value of each company is reported as a guide to assess the value of stocks based on this measure quickly. The chart also shows daily changes in stock prices and the percentage year to date price movement based on the last traded prices.
Dividends paid or payable and yields for each company are shown in the Main and Junior Markets’ daily report charts along with the closing volume pertaining to the highest bid and the lowest offer for each company.


