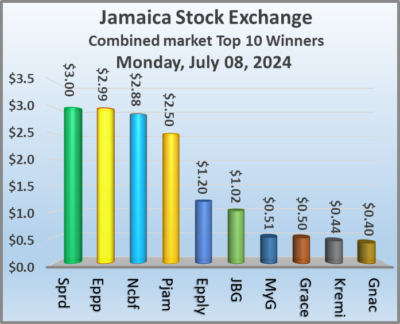
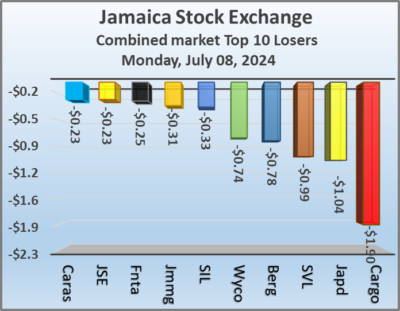
The volume of stocks traded on the Jamaica Stock Exchange declined on Monday but with a higher value compared with Friday as trading on the Junior Market dropped but rose in the Main market resulting in moderate slippage in both markets. JSE USD market closed moderately higher as trading picked up from Friday, with trading in the overall market resulting in prices of 29 stocks rising and 32 declining.
 At the close of trading on Monday, the JSE Combined Market Index rose 754.50 points to 331,757.81, the All Jamaican Composite Index dipped 103.99 points to close at 357,293.42, the JSE Main Index fell 670.12 points to end trading at 318,586.42. The Junior Market Index fell 15.95 points to 3,779.84 and the JSE USD Market Index rallied 3.93 points to end the day at 238.48.
At the close of trading, 7,306,298 shares were exchanged in all three markets, down from 15,522,492 units on Friday, with the value of stocks traded on the Junior and Main markets amounted to $38.49 million, worth more than the mere $27.85 million on the previous trading day and the JSE USD market closed with an exchange of 250,977 shares for US$20,236 compared to 52,744 units at US$1,293 on Friday.
In Main Market activity, Transjamaican Highway led trading with 2.51 million shares followed by Sagicor Select Manufacturing & Distribution Fund with 500,799 units and Wigton Windfarm after an exchange of 316,910 stocks.
In Junior Market trading, iCreate led trading with 302,647 shares followed by One Great Studio with an exchange of 293,060 units and Regency Petroleum with 266,994 stocks.
In the preference segment, no stock traded with a notable price change.
 The market’s PE ratio, the most popular measure used to value stocks, ended at 20.4 on 2023-24 earnings and 13.9 times those for 2024-25 at the close of trading. ICInsider.com PE ratio chart and more detailed daily charts provide investors with regularly updated information to help decision-making.
The PE ratio chart covers all ordinary shares on the Jamaica Stock Exchange, grouped by industry, allowing for easy comparisons within a sector and the overall market. The EPS & PE ratios are based on 2023 and 2024 actual or projected earnings, excluding major one off items.
Pertinent information is required to navigate numerous investment options successfully in the stock market. The ICInsider.com PE ratio chart and more detailed daily charts provide investors with regularly updated information to help decision-making.
The chart should be used in making rational decisions when investing in stocks close to the average for the sector, not going too far from it unless there are compelling reasons to do so. This approach helps to remove emotions from investment decisions and place them on fundamentals while at the same time not being too far from the majority of investors. 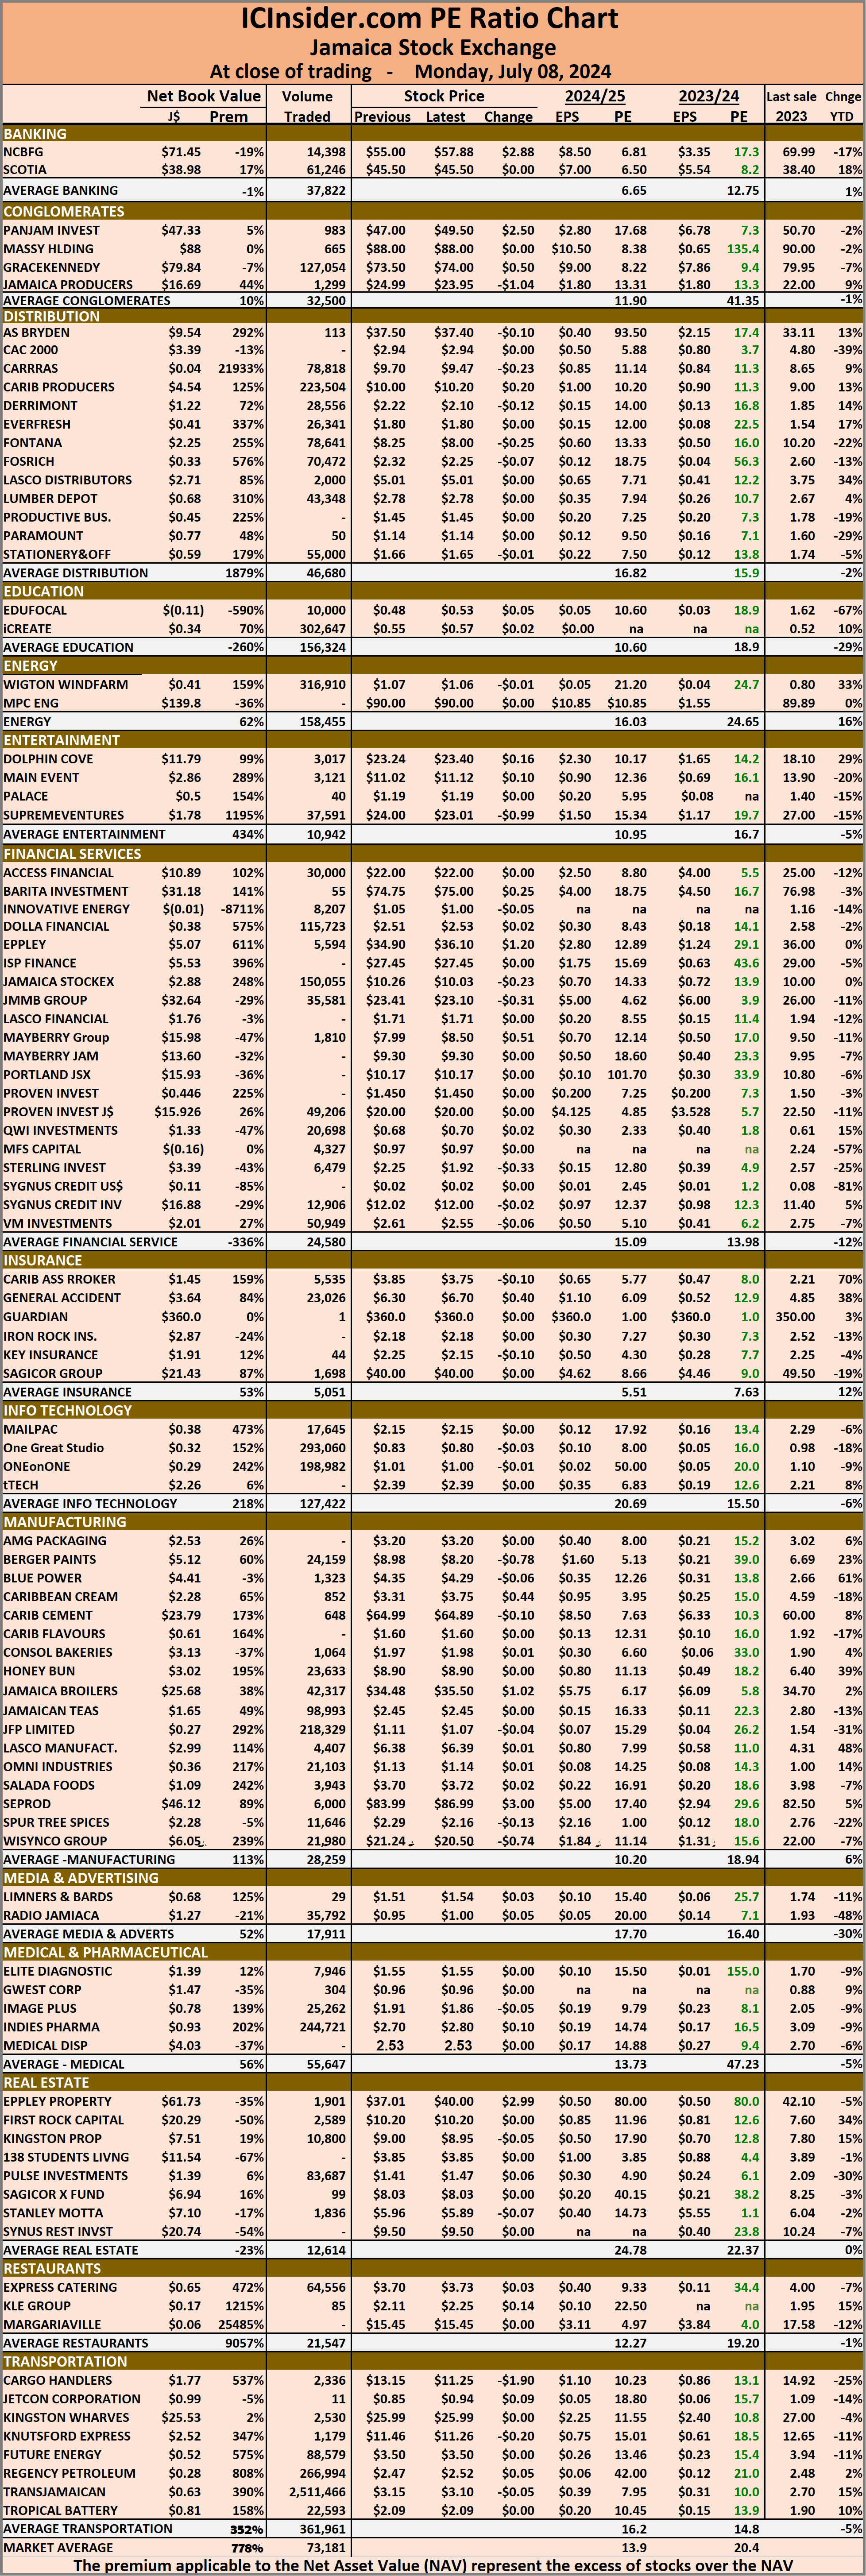 Investors who buy when the price of a stock is close to the average will find that they are not inclined to overpay for a stock.
The net asset value of each company is reported as a guide for investors to quickly assess the value of stocks based on this measure. The chart also shows daily changes in stock prices and the percentage year to date price movement based on the last traded prices.
Dividends paid or payable and yields for each company are shown in the Main and Junior Markets’ daily report charts, along with the closing volume of the highest bid and the lowest offer for each company.
Slow post-Beryl trading recovery
July 8, 2024 by IC Insider.com
Filed Under: Feature Stories, JSE Combined, Stock Market Tagged With: 138 Student Living, Caribbean Cement, Daily Trading, Emerging market, Eppley, Jamaica Producers, Jamaica Stock Exchange, Jamaica Stock Exchange Combined Index, Jamaican stocks, JSE Main Index, junior market, Junior Market index, NCB Financial, Net asset Value of Jamaican stocks, Pan Jam, PE Ratio of Jamaican stocks, Productive Business Solutions, Scotia Group, Seprod, Trading Activity, Transjamaican Highway, Wigton Windfarm
About IC Insider.com