Trading remained robust on Monday on the Jamaica Stock Exchange but dropped sharply following the heavy trading on Friday, with the Main Market accounting for much of the increased trading on Monday resulting in the Main Market’s major indices rising solidly at the close. The JSE USD market moved higher and the Junior Market closed moderately lower with trading resulting in prices of 38 shares rising and 41 declining.
 At the close of trading on Monday, the JSE Combined Market Index rose 2,519.69 points to 321,298.18, the All Jamaican Composite Index popped 1,764.89 points to 350,128.30 and the JSE Main Index gained 2,750.13 points to finish at 308,467.04. The Junior Market Index dipped 15.29 points to finish at 3,670.01 and the JSE USD Market Index climbed 3.61 points to cease trading at 232.04.
At the close, just 25,096,434 shares were exchanged in all three markets, up from 141,279,099 units on Friday, with the value of stocks traded on the Junior and Main markets amounted to $303.10 million, well below the $861.57 million on the previous trading day and the JSE USD market closed with an exchange of 46,461 shares for US$5,650 compared to 52,878 units at US$20,354 on Friday.
In Main Market activity, Transjamaican Highway led trading with 7.50 million shares followed by Kingston Wharves with 1.72 million stock units, Jamaica Broilers with 1.72 million units, GraceKennedy with 1.09 million shares, Wigton Windfarm with 1.05 million stock units and Mayberry Group with 1.01 million units.
In Junior Market trading, Dolla Financial led trading with 2.76 million shares followed by RA Williams with 742,093 units and One Great Studio with 707,697 stock units.
 In the preference segment, Eppley 7.75% preference share popped 99 cents to finish at $19.99, 138 Student Living preference share gained $37 and ended at $181 and Sygnus Credit Investments C10.5% rose $2.11 to $103.50.
The market’s PE ratio, the most popular measure used to value stocks, ended at 19.8 on 2023-24 earnings and 13.4 times those for 2024-25 at the close of trading. ICInsider.com PE ratio chart and more detailed daily charts provide investors with regularly updated information to help decision-making.
The PE ratio chart covers all ordinary shares on the Jamaica Stock Exchange, grouped by industry, allowing for easy comparisons within a sector and the overall market. The EPS & PE ratios are based on 2023 and 2024 actual or projected earnings, excluding major one off items.
Pertinent information is required to navigate numerous investment options successfully in the stock market. The ICInsider.com PE ratio chart and more detailed daily charts provide investors with regularly updated information to help decision-making.
The chart should be used in making rational decisions when investing in stocks close to the average for the sector, not going too far from it unless there are compelling reasons to do so. This approach helps to remove emotions from investment decisions and place them on fundamentals while at the same time not being too far from the majority of investors. Investors who buy when the price of a stock is close to the average will find that they are not inclined to overpay for a stock.
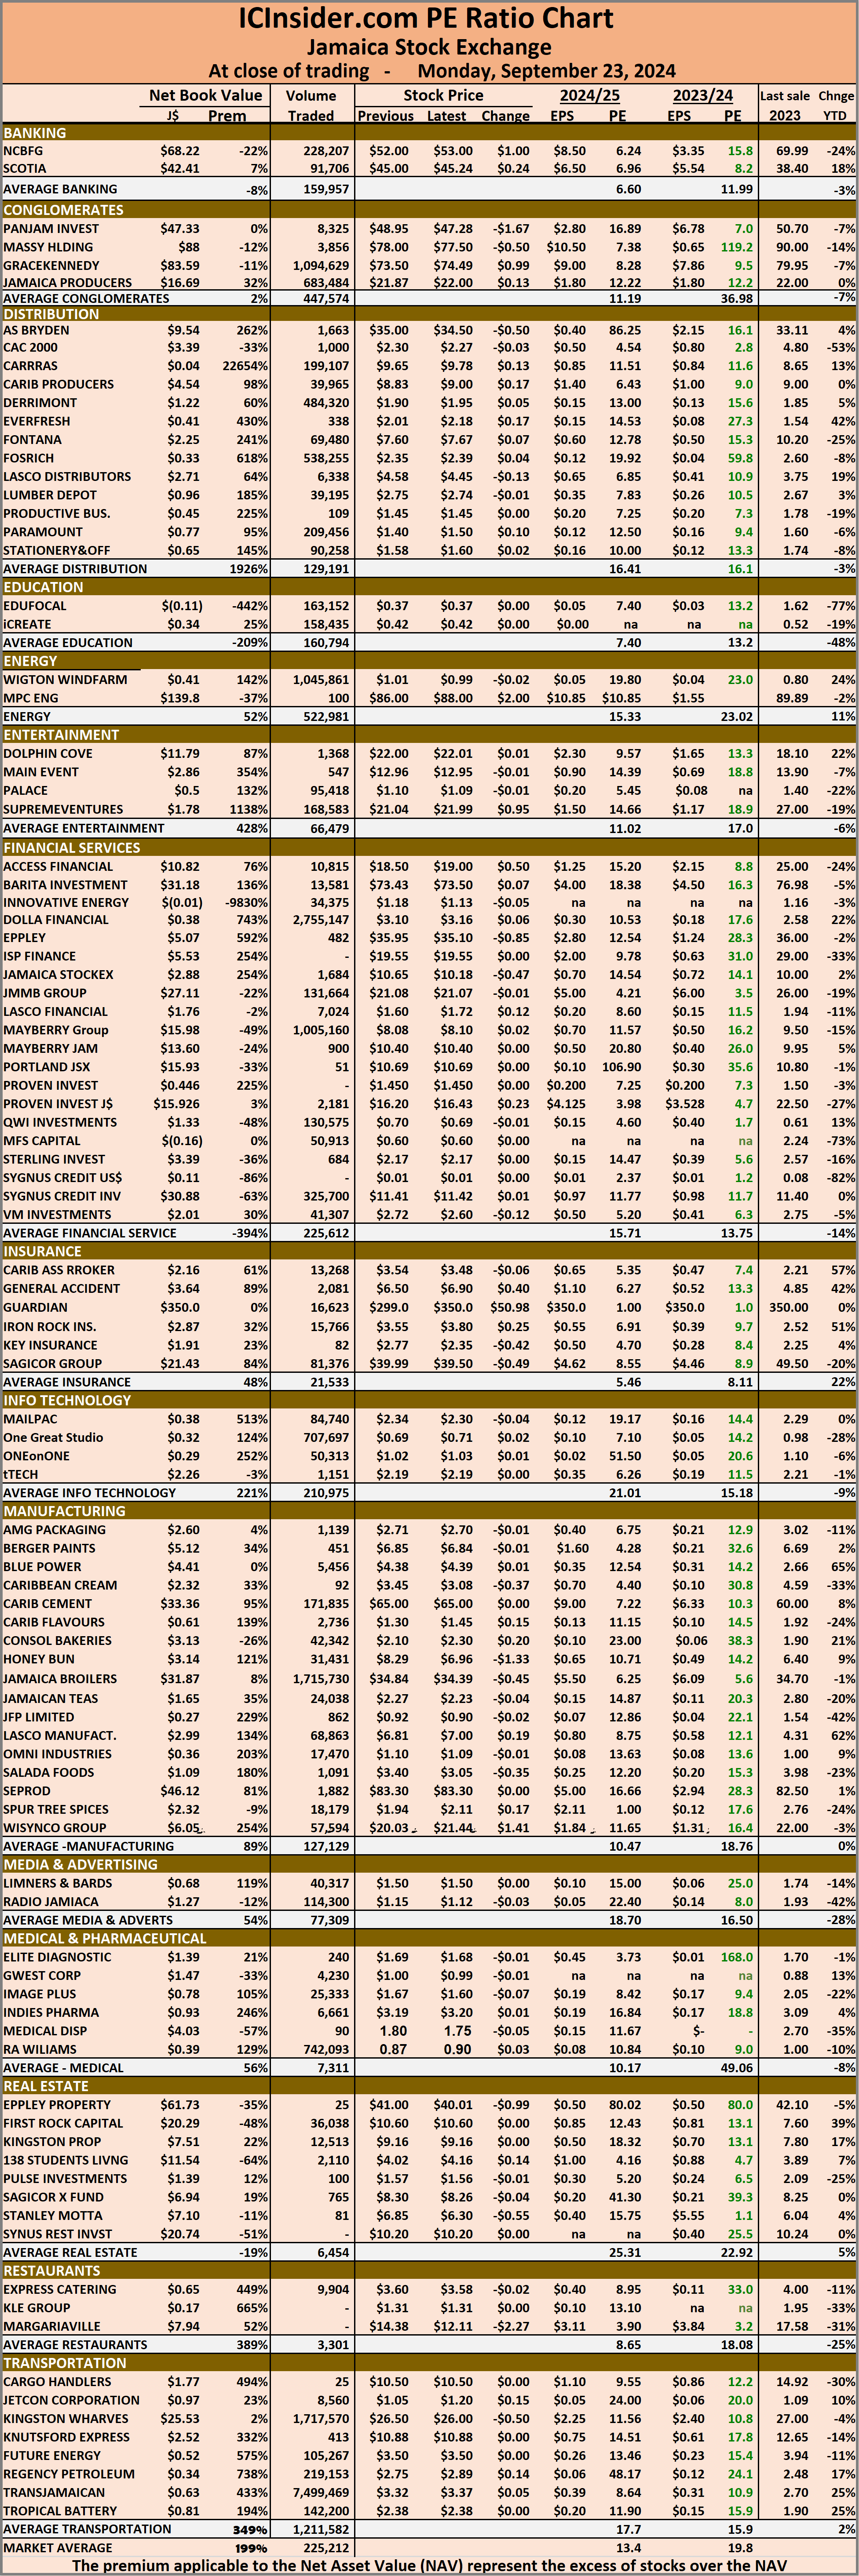 The net asset value of each company is incorporated into the chart. Investors can use this measure in assessing stock values. The chart also shows daily changes in stock prices and the percentage year to date price movement based on the last traded prices.
Dividends that are paid or are due to be paid and yields for each company are shown in the Main and Junior Markets’ daily report charts, along with the closing volume of the highest bid and the lowest offer for each company.
Robust trading on JSE Markets on Monday
Filed Under: Feature Stories, JSE Combined, Stock Market Tagged With: 138 Student Living, Caribbean Cement, Daily Trading, Emerging market, Eppley, Jamaica Producers, Jamaica Stock Exchange, Jamaica Stock Exchange Combined Index, Jamaican stocks, JPS, JSE Main Index, junior market, Junior Market index, NCB Financial, Net asset Value of Jamaican stocks, Pan Jam, PE Ratio of Jamaican stocks, Productive Business Solutions, RA Williams, Scotia Group, Seprod, Trading Activity, Transjamaican Highway, Wigton Windfarm
About IC Insider.com


Speak Your Mind
You must be logged in to post a comment.