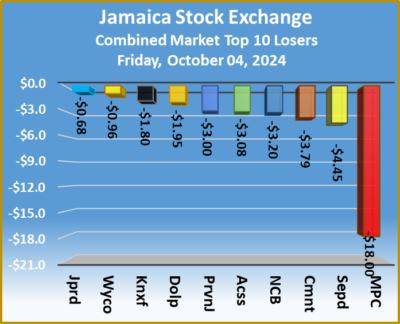
The Jamaica Stock Exchange suffered declines in all markets at the end of trading on Friday, following an increase trading with the number and value of stocks changing hands climbed above trading on Thursday, resulting in prices of 37 shares rising and 35 declining.
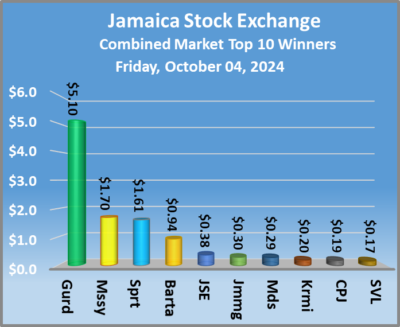 At the close of trading, the JSE Combined Market Index declined 2,747.67 points to 326,807.16, the All Jamaican Composite Index dropped 3,124.21 points to finish at 355,999.71 and the JSE Main Index fell 2,402.51 points to close at 313,414.53. The Junior Market Index skidded 62.72 points to cease trading at 3,778.39 and the JSE USD Market Index slipped 0.55 points to conclude trading at 222.50.
At the close of trading, 24,902,509 shares were exchanged in all three markets, up from 19,477,144 units on Thursday, with the value of stocks traded on the Junior and Main markets amounted to $132.26 million, above the $108.65 million on the previous trading day and the JSE USD market closed with an exchange of 1,373,440 shares for US$127,152 compared to 501,008 units at US$10,466 on Thursday.
In Main Market activity, Sagicor Select Financial Fund led trading with 13.36 million shares followed by Transjamaican Highway with 1.27 million stocks for 6.6 percent of the day’s trade and NCB Financial with 1.03 million units.
In Junior Market trading, MFS Capital Partners led trading with 708,105 shares followed by Dolla Financial with 643,699 units and Indies Pharma with 401,789 stocks.
 In the preference segment, Jamaica Public Service 9.5% climbed $51 to $2,750.
The market’s PE ratio, the most popular measure used to value stocks, ended at 20.2 on 2023-24 earnings and 13.5 times those for 2024-25 at the close of trading. ICInsider.com PE ratio chart and more detailed daily charts provide investors with regularly updated information to help decision-making.
The PE ratio chart covers all ordinary shares on the Jamaica Stock Exchange, grouped by industry, allowing for easy comparisons within a sector and the overall market. The EPS & PE ratios are based on 2023 and 2024 actual or projected earnings, excluding major one off items.
Pertinent information is required to navigate numerous investment options successfully in the stock market. The ICInsider.com PE ratio chart and more detailed daily charts provide investors with regularly updated information to help decision-making.
The chart should be used in making rational decisions when investing in stocks close to the average for the sector, not going too far from it unless there are compelling reasons to do so. This approach helps to remove emotions from investment decisions and place them on fundamentals while at the same time not being too far from the majority of investors. Investors who buy when the price of a stock is close to the average will find that they are not inclined to overpay for a stock.
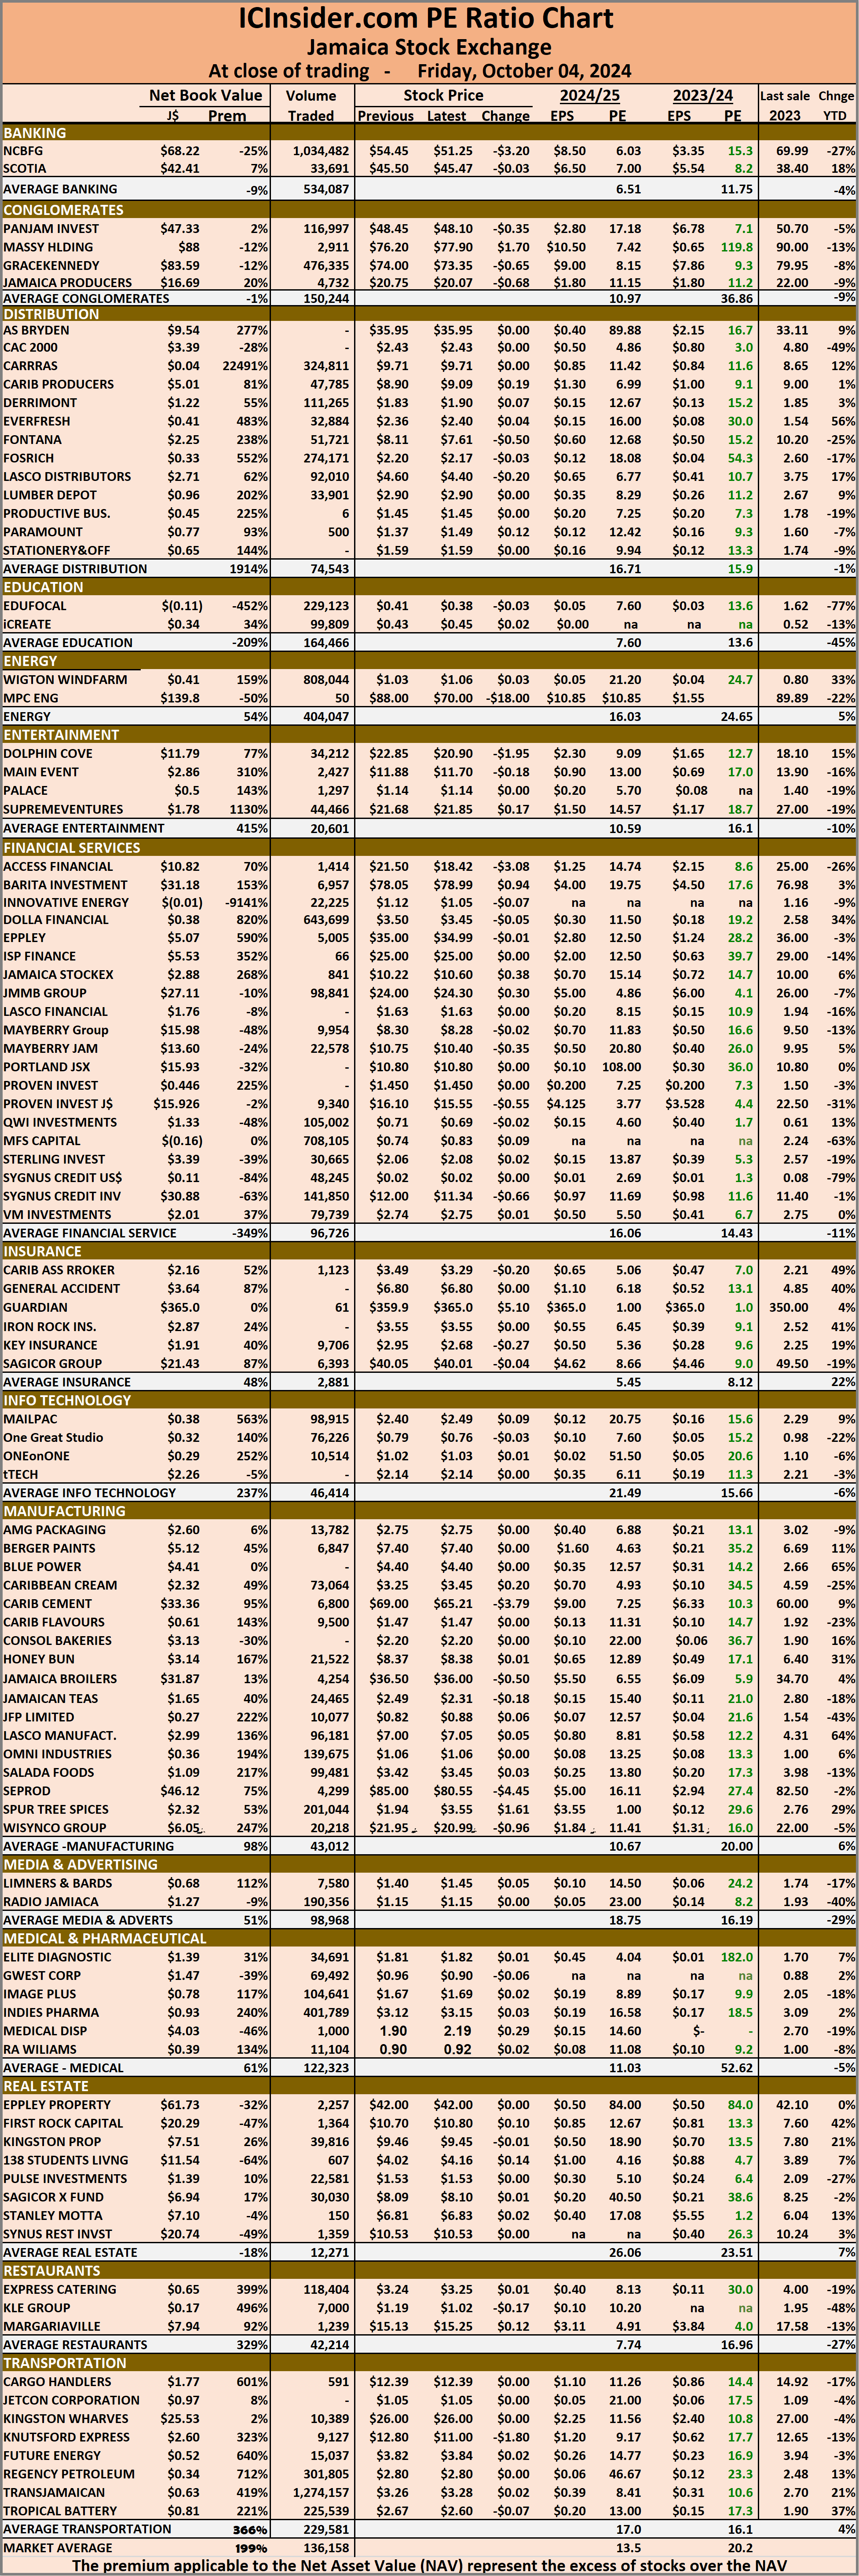 The net asset value of each company is incorporated into the chart. Investors can use this measure in assessing stock values. The chart also shows daily changes in stock prices and the percentage year to date price movement based on the last traded prices.
Dividends that are paid or are due to be paid and yields for each company are shown in the Main and Junior Markets’ daily report charts, along with the closing volume of the highest bid and the lowest offer for each company.
Red letter day for the Jamaica stock market
Filed Under: Feature Stories, JSE Combined, Stock Market Tagged With: 138 Student Living, Caribbean Cement, Daily Trading, Emerging market, Eppley, Jamaica Producers, Jamaica Stock Exchange, Jamaica Stock Exchange Combined Index, Jamaican stocks, JPS, JSE Main Index, junior market, Junior Market index, NCB Financial, Net asset Value of Jamaican stocks, Pan Jam, PE Ratio of Jamaican stocks, Productive Business Solutions, RA Williams, Scotia Group, Seprod, Trading Activity, Transjamaican Highway, Wigton Windfarm
About IC Insider.com


Speak Your Mind
You must be logged in to post a comment.