Trading picked up on the Jamaica Stock Exchange on Tuesday, with the volume of stocks changing hands climbing, with the value of stocks traded jumping sharply over the previous day and resulting in prices of just 18 shares rising and 44 declining, with the Main Market closing higher and the Junior and JSE USD markets closing lower.
 At the close of trading, the JSE Combined Market Index climbed 108.87 points to 326,312.91, the All Jamaican Composite Index rallied 1,008.75 points to 354,761.14, the JSE Main Index popped 338.01 points to close at 313,928.05. The Junior Market Index sank 30.30 points to close trading at 3,640.76 and the JSE USD Market Index slipped 0.44 points to 226.35.
At the close of trading, 22,053,861 shares were exchanged in all three markets, similar to 22,027,669 units on Monday, with the value of stocks traded on the Junior and Main markets amounted to $86.67 million, well over the $34.8 million on the previous trading day and the JSE USD market closed with an exchange of 484,869 shares for US$42,958 compared to 36,773 units at US$4,077 on Monday.
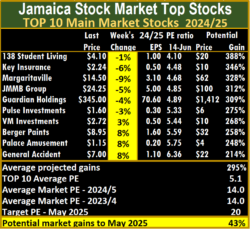
In Main Market activity, 138 Student Living led trading with 4.95 million shares followed by Wigton Windfarm with 2.52 million stock units and Transjamaican Highway with 850,644 units.
In Junior Market trading, JFP Ltd led trading with 2.40 million shares followed by EduFocal with 2.26 million stock units, Fontana ended with 1.72 million units and Dolla Financial with 1.03 million shares.
 In the preference segment, Sygnus Credit Investments C10.5% sank $16.04 and ended at $90.96.
The market’s PE ratio, the most popular measure used to value stocks, ended at 19.9 on 2023-24 earnings and 13.5 times those for 2024-25 at the close of trading. ICInsider.com PE ratio chart and more detailed daily charts provide investors with regularly updated information to help decision-making.
The PE ratio chart covers all ordinary shares on the Jamaica Stock Exchange, grouped by industry, allowing for easy comparisons within a sector and the overall market. The EPS & PE ratios are based on 2023 and 2024 actual or projected earnings, excluding major one off items.
Pertinent information is required to navigate numerous investment options successfully in the stock market. The ICInsider.com PE ratio chart and more detailed daily charts provide investors with regularly updated information to help decision-making.
The chart should be used in making rational decisions when investing in stocks close to the average for the sector, not going too far from it unless there are compelling reasons to do so. This approach helps to remove emotions from investment decisions and place them on fundamentals while at the same time not being too far from the majority of investors.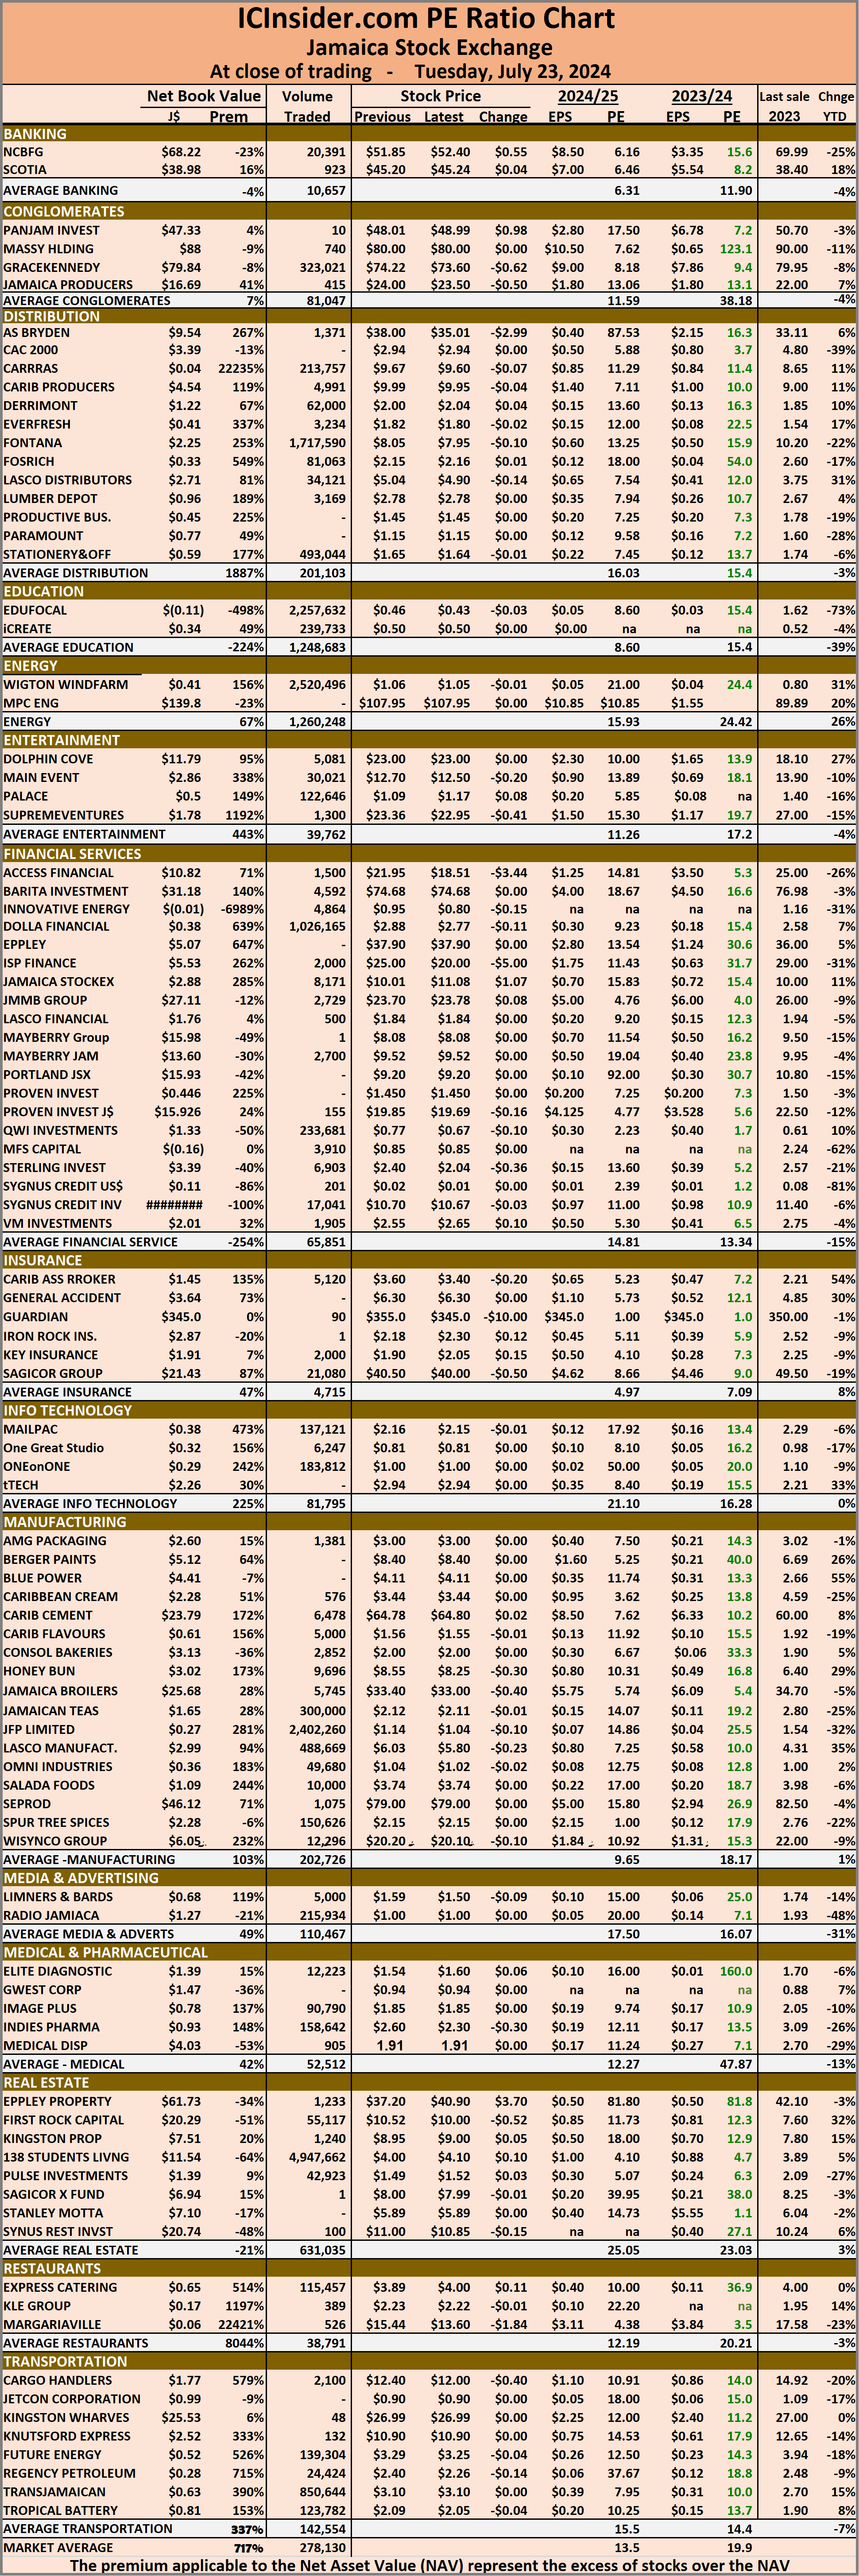 Investors who buy when the price of a stock is close to the average will find that they are not inclined to overpay for a stock.
The net asset value of each company is incorporated into the chart. Investors can use this measure in assessing stock values. The chart also shows daily changes in stock prices and the percentage year to date price movement based on the last traded prices.
Dividends that are paid or are due to be paid and yields for each company are shown in the Main and Junior Markets’ daily report charts, along with the closing volume of the highest bid and the lowest offer for each company.
Main Market rises Junior & USD Markets fall
July 23, 2024 by IC Insider.com
Filed Under: Feature Stories, JSE Combined, Stock Market Tagged With: 138 Student Living, Caribbean Cement, Daily Trading, Emerging market, Eppley, Jamaica Producers, Jamaica Stock Exchange, Jamaica Stock Exchange Combined Index, Jamaican stocks, JSE Main Index, junior market, Junior Market index, NCB Financial, Net asset Value of Jamaican stocks, Pan Jam, PE Ratio of Jamaican stocks, Productive Business Solutions, Scotia Group, Seprod, Trading Activity, Transjamaican Highway, Wigton Windfarm
About IC Insider.com