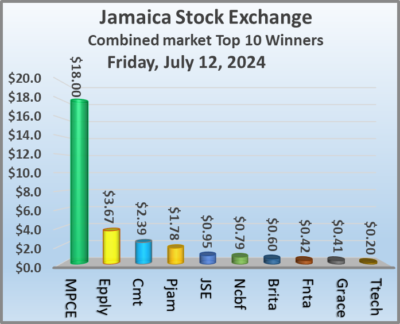
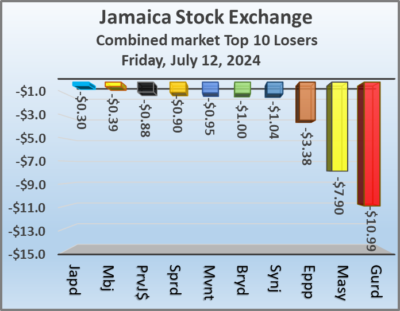
The Main and Junior markets of the Jamaica Stock Exchange declined in trading on Friday with the JSE USD market closing moderately higher as trading ended with the number and value of stocks changing hands falling, from the previous trading day, resulting in prices of 25 shares rising and 31 declining.
 At the close of trading, the JSE Combined Market Index climbed 892.58 points to 331,646.99, the All Jamaican Composite Index slipped 439.53 points to end at 357,690.12, the JSE Main Index dipped 675.66 points to end at 318,897.75. The Junior Market Index dropped 34.68 points to 3,722.15 and the JSE USD Market Index rallied 0.37 points to close trading at 224.94.
At the close of trading, 33,157,102 shares were exchanged in all three markets, down from 66,615,941 units on Thursday, with the value of stocks traded on the Junior and Main markets amounted to just $63.58 million, well below the $168.55 million on the previous trading day and the JSE USD market closed with an exchange of 269,334 shares for US$34,981 compared to 222,252 units at US$66,982 on Thursday.
In Main Market activity, Wigton Windfarm led trading with 11.73 million shares followed by Palace Amusement with 10.10 million units and Sagicor Select Manufacturing & Distribution Fund with 1.63 million stocks.
In Junior Market trading, Dolla Financial led trading with 2.49 million shares followed by Stationery and Office Supplies with 1.34 million units and Omni Industries with 1.05 million stocks.
In the preference segment, Jamaica Public Service 9.5% lost $1 in closing at $2,699 and Sygnus Credit Investments C10.5% dipped $2 and ended at $108.
 The market’s PE ratio, the most popular measure used to value stocks, ended at 20.3 on 2023-24 earnings and 13.8 times those for 2024-25 at the close of trading. ICInsider.com PE ratio chart and more detailed daily charts provide investors with regularly updated information to help decision-making.
The PE ratio chart covers all ordinary shares on the Jamaica Stock Exchange, grouped by industry, allowing for easy comparisons within a sector and the overall market. The EPS & PE ratios are based on 2023 and 2024 actual or projected earnings, excluding major one off items.
Pertinent information is required to navigate numerous investment options successfully in the stock market. The ICInsider.com PE ratio chart and more detailed daily charts provide investors with regularly updated information to help decision-making.
The chart should be used in making rational decisions when investing in stocks close to the average for the sector, not going too far from it unless there are compelling reasons to do so. This approach helps to remove emotions from investment decisions and place them on fundamentals while at the same time not being too far from the majority of investors. Investors who buy when the price of a stock is close to the average will find that they are not inclined to overpay for a stock.
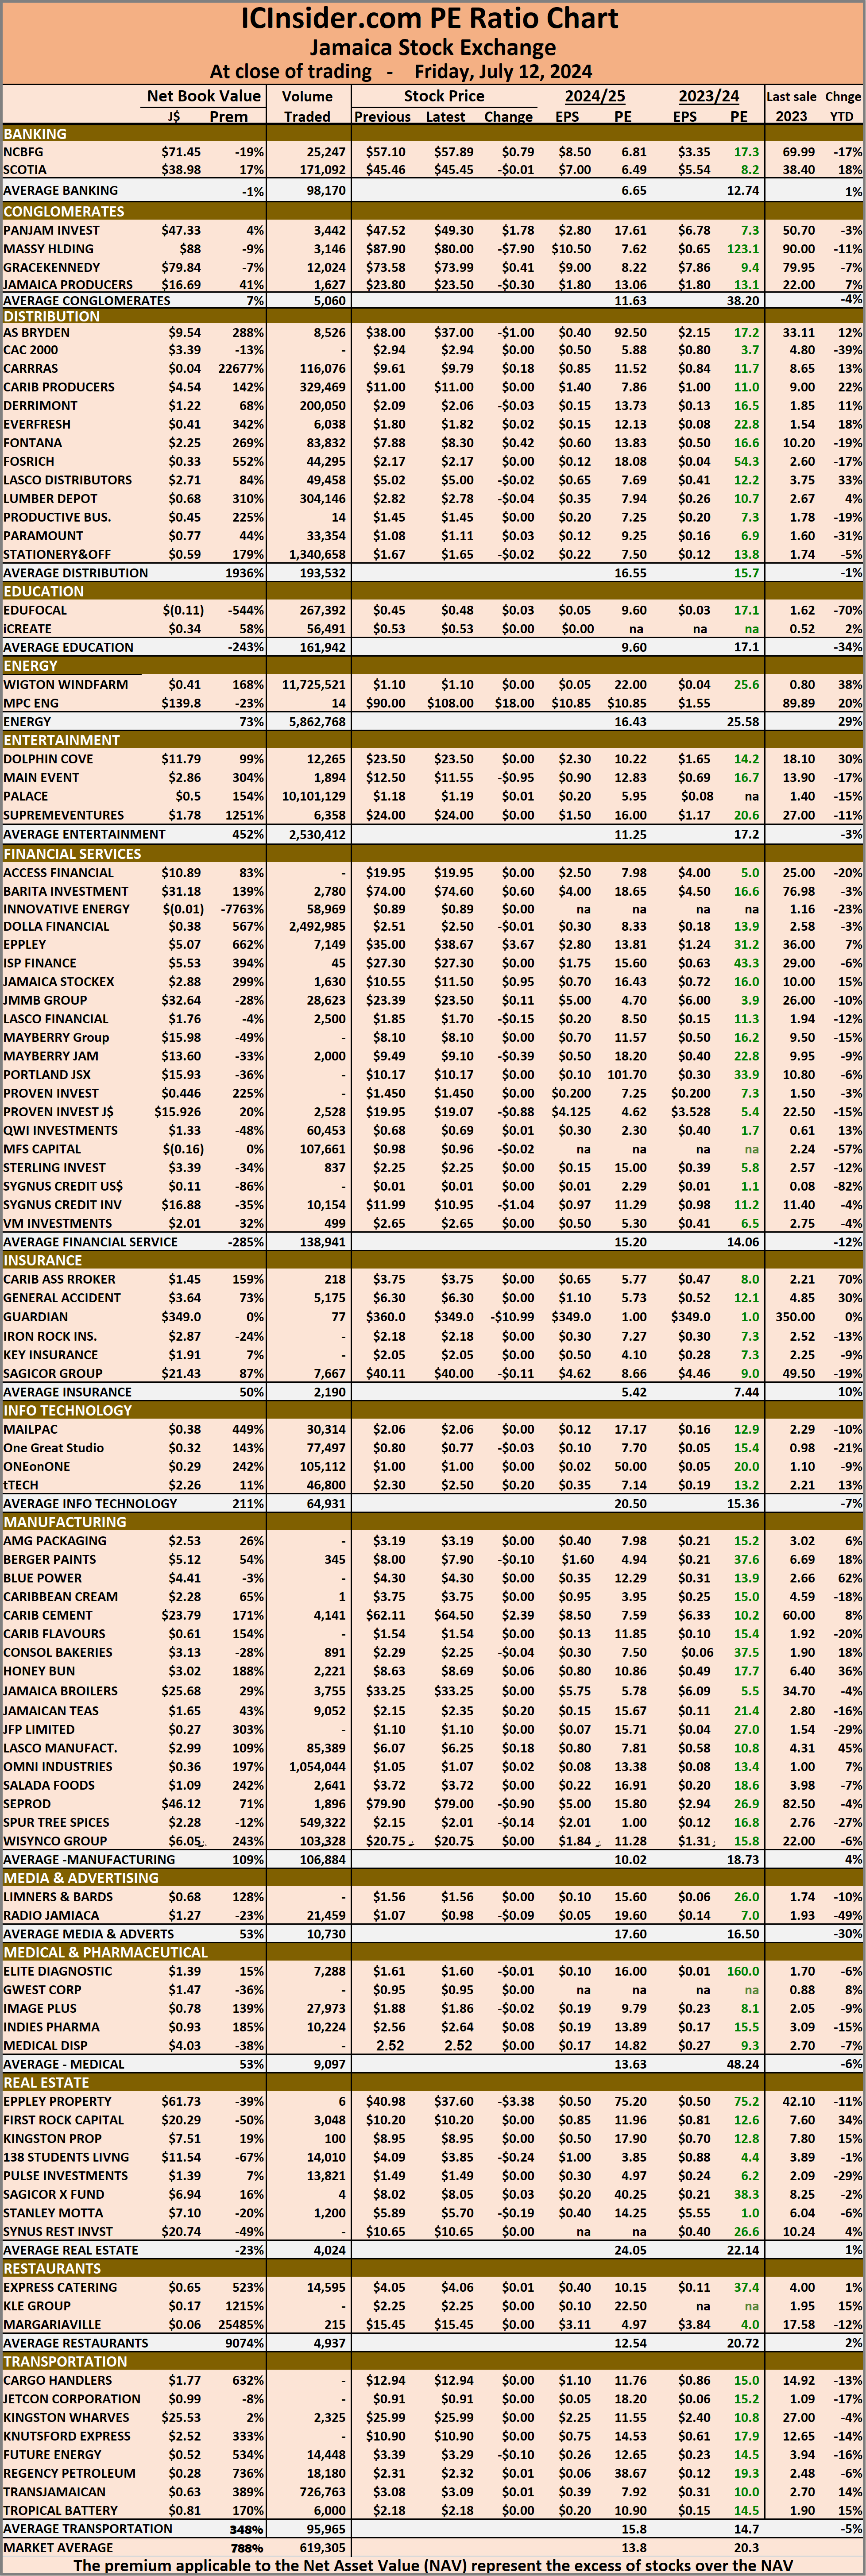 The net asset value of each company is reported as a guide for investors to quickly assess the value of stocks based on this measure. The chart also shows daily changes in stock prices and the percentage year to date price movement based on the last traded prices.
Dividends paid or payable and yields for each company are shown in the Main and Junior Markets’ daily report charts, along with the closing volume of the highest bid and the lowest offer for each company.
Main & Junior Market fall USD market rises
July 12, 2024 by IC Insider.com
Filed Under: Feature Stories, JSE Combined, Stock Market Tagged With: 138 Student Living, Caribbean Cement, Daily Trading, Emerging market, Eppley, Jamaica Producers, Jamaica Stock Exchange, Jamaica Stock Exchange Combined Index, Jamaican stocks, JPS, JSE Main Index, junior market, Junior Market index, NCB Financial, Net asset Value of Jamaican stocks, Pan Jam, PE Ratio of Jamaican stocks, Productive Business Solutions, Scotia Group, Seprod, Trading Activity, Transjamaican Highway, Wigton Windfarm
About IC Insider.com