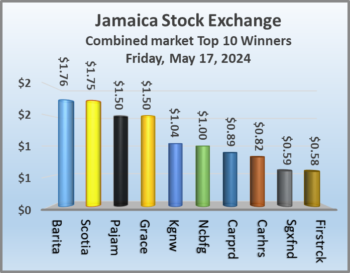
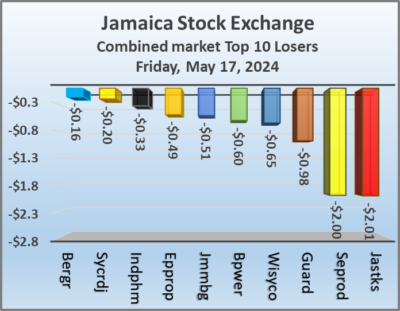
Trading jumped sharply on the Jamaica Stock Exchange on Friday with nearly twice the volume of stocks changing hands with the value surging well above that on Thursday and resulting in prices of 38 shares rising and 27 declining and ending with the Junior Market jumping sharply while the Main Market rallied higher at the close while the JSE USD market closed marginally higher.
 At the close of trading, the JSE Combined Market Index climbed 1,251.08 points to 333,992.93, the All Jamaican Composite Index jumped 1,282.66 points to 358,400.25, the JSE Main Index rose 854.69 points to wrap-up trading at 321,317.22. The Junior Market Index surged 61.95 points to conclude trading at 3,726.59 and the JSE USD Market Index popped 0.06 points to finish at 237.05.
At the close of trading, 32,255,498 shares were exchanged in all three markets, up from 17,302,070 units on Thursday, with the value of stocks traded on the Junior and Main markets amounted to $497.67 million, well above the $57.3 million on the previous trading day and the JSE USD market closed with an exchange of 280,988 shares for US$32,878 compared to 102,017 units at US$10,991 on Thursday.
In Main Market activity, JMMB Group 7.25% preference share due 2024 led trading with 13.0 million shares followed by GraceKennedy with 5.27 million stocks, Wigton Windfarm with 3.31 million units, Carreras with 1.87 million units and Transjamaican Highway with 1.47 million stock units.
 In the Junior Market, Dolla Financial led trading with 2.10 million shares followed by Fosrich with 1.03 million stocks and Derrimon Trading with 525,307 units.
The market’s PE ratio, the most popular measure used to determine the value of stocks, ended at 21.5 on 2023-24 earnings and 13. times those for 2024-25 at the close of trading. ICInsider.com PE ratio chart and the more detailed daily charts provide investors with regularly updated information to help decision-making.
The PE ratio chart covers all ordinary shares on the Jamaica Stock Exchange, grouped by industry, allowing for easy comparisons within a sector and the overall market. The EPS & PE ratios are based on 2023 and 2024 actual or projected earnings, excluding major one off items.
Pertinent information is required to navigate numerous investment options successfully in the stock market. The ICInsider.com PE ratio chart and the more detailed daily report charts provide investors with regularly updated information to help decision-making.
The chart should be used in making rational decisions when investing in stocks close to the average for the sector, not going too far from it unless there are compelling reasons to do so. This approach helps to remove emotions from investment decisions and place them on fundamentals while at the same time not being too far from the majority of investors. 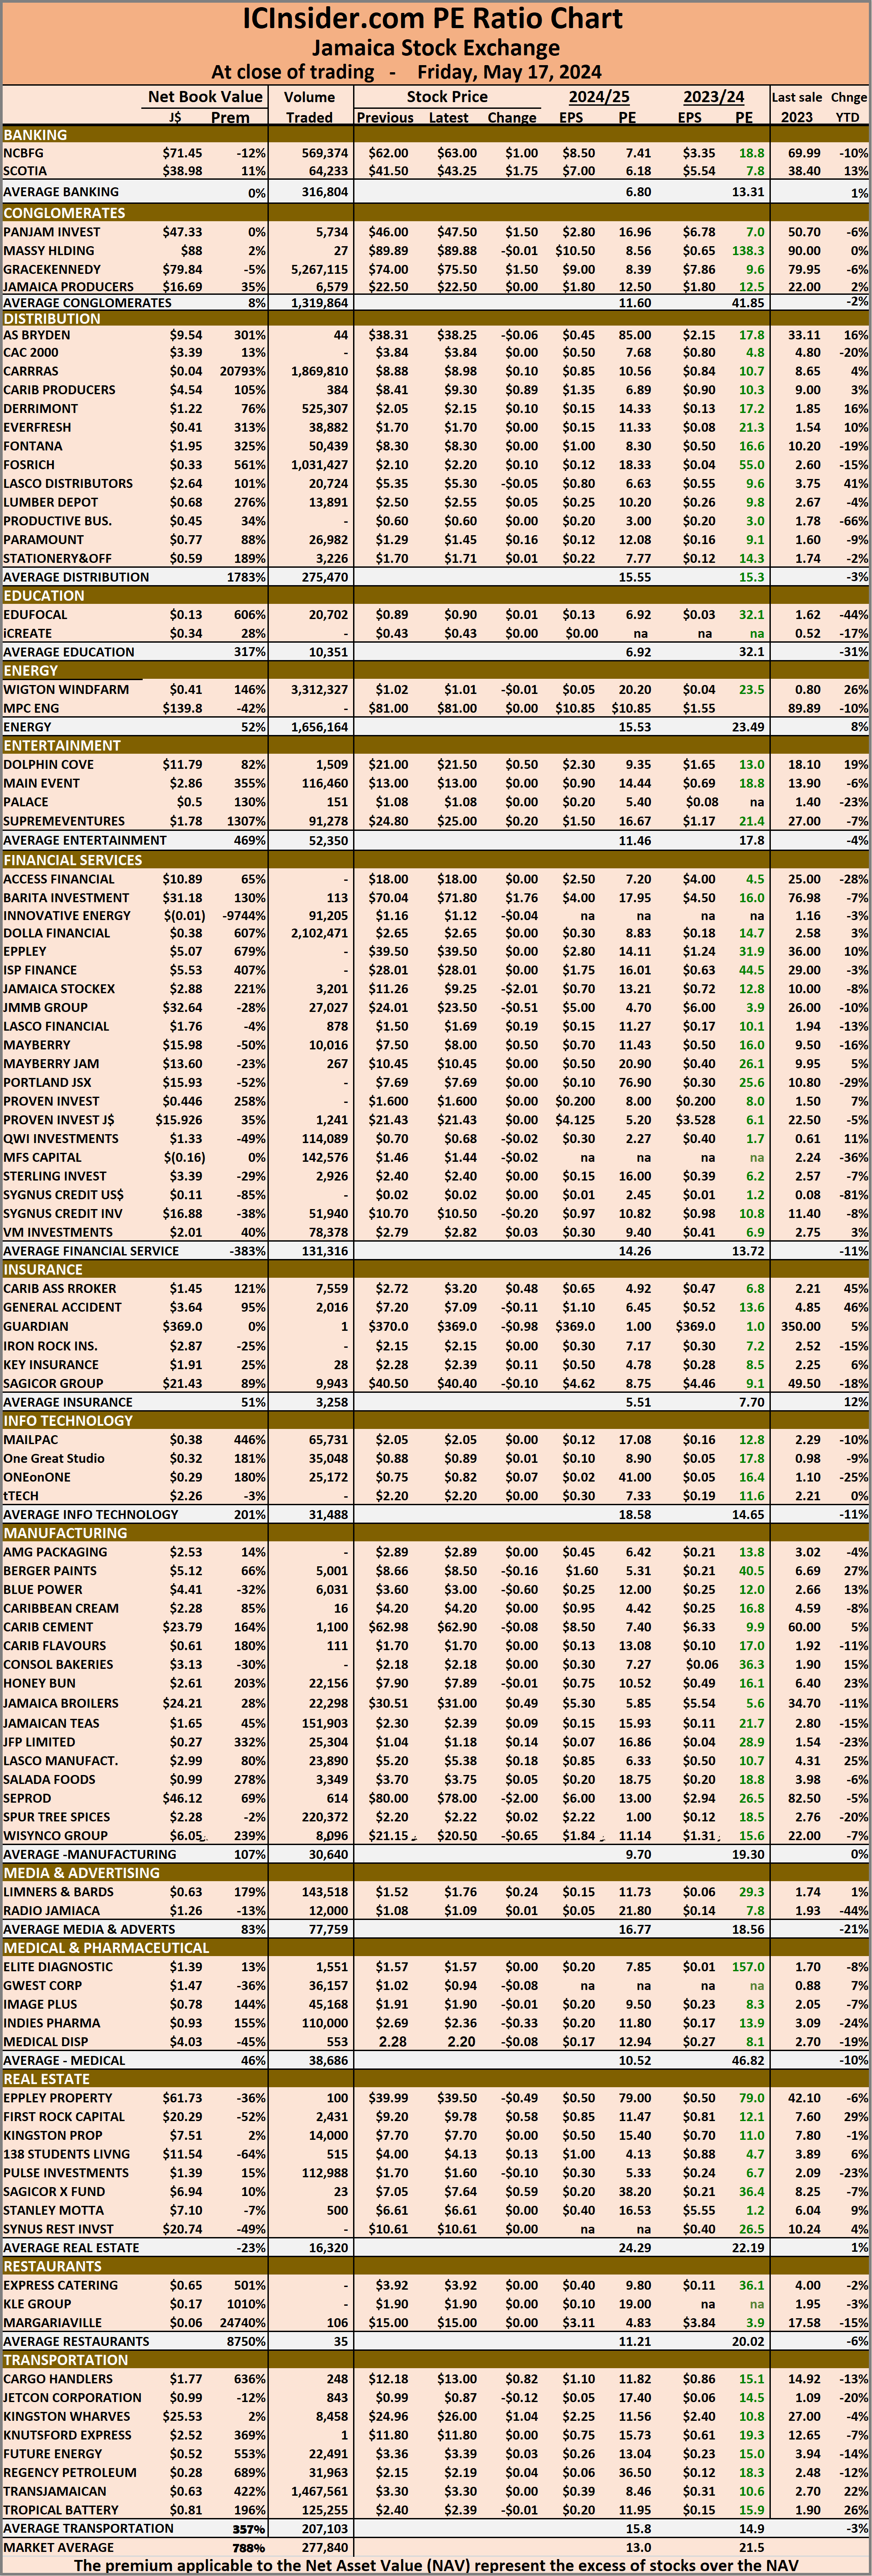 Investors who buy when the price of a stock is close to the average will find that they are not inclined to overpay for a stock.
The net asset value of each company is reported as a guide for investors to quickly assess the value of stocks based on this measure. The chart also shows daily changes in stock prices and the percentage year to date price movement based on the last traded prices.
Dividends paid or payable and yields for each company are shown in the Main and Junior Markets’ daily report charts, along with the closing volume of the highest bid and the lowest offer for each company.
Jamaican stocks rally on Friday
May 17, 2024 by IC Insider.com
Filed Under: Feature Stories, JSE Combined, Stock Market Tagged With: 138 Student Living, Caribbean Cement, Daily Trading, Emerging market, Eppley, Jamaica Producers, Jamaica Stock Exchange, Jamaica Stock Exchange Combined Index, Jamaican stocks, JPS, JSE Main Index, junior market, Junior Market index, NCB Financial, Net asset Value of Jamaican stocks, Pan Jam, PE Ratio of Jamaican stocks, Productive Business Solutions, Scotia Group, Seprod, Trading Activity, Transjamaican Highway, Wigton Windfarm
About IC Insider.com