The Junior Market of the Jamaica Stock Exchange continues to scale new heights with the market index surging to a record high of 4,543.70 just short of an hour of trading but failed to hold on to the 4,500 points handle, and closing with a loss of 33.10 points to close at 4,452.22. Main Market stocks finished down for the day with the JSE Combined Index slipping 533.83 points to close at 413,828.96.
 The All Jamaican Composite Index fell 305.19 points to 456,528.96, the JSE Main Index declined 256.15 points to end at 399,793.50 and the JSE USD market index lost 0.40 points to 224.76.
Trading ended with an exchange of 27,094,524 shares in all markets. The value of stocks traded in the Main and Junior Markets totalled $240.5 million and the JSE USD market amounts to US$35,454.
The market’s PE ratio ended at 25.4 based on 2021-22 earnings and 14.1 times those for 2022-23 at the close of the Jamaica Stock Exchange.
Investors need a series of measures and pertinent information to successfully navigate the many investment choices in the local stock market. The ICInsider.com PE ratio chart and the more detailed daily report charts provide investors with regularly updated information to help with decision-making.
Investors should make use of the chart to help make rational investment decisions by investing in stocks that are close to the average for the sector and not going too far from it unless there are compelling reasons to do so. This approach helps to take emotions out of the investment decision and put in on fundamentals while at the same time not being too far from the majority of investors. Investors who buy when the price of a stock is close to the average will find that they are not inclined to overpay for a stock.
The ICInsider.com PE Ratio chart covers all ordinary shares listed on the Jamaica Stock Exchange.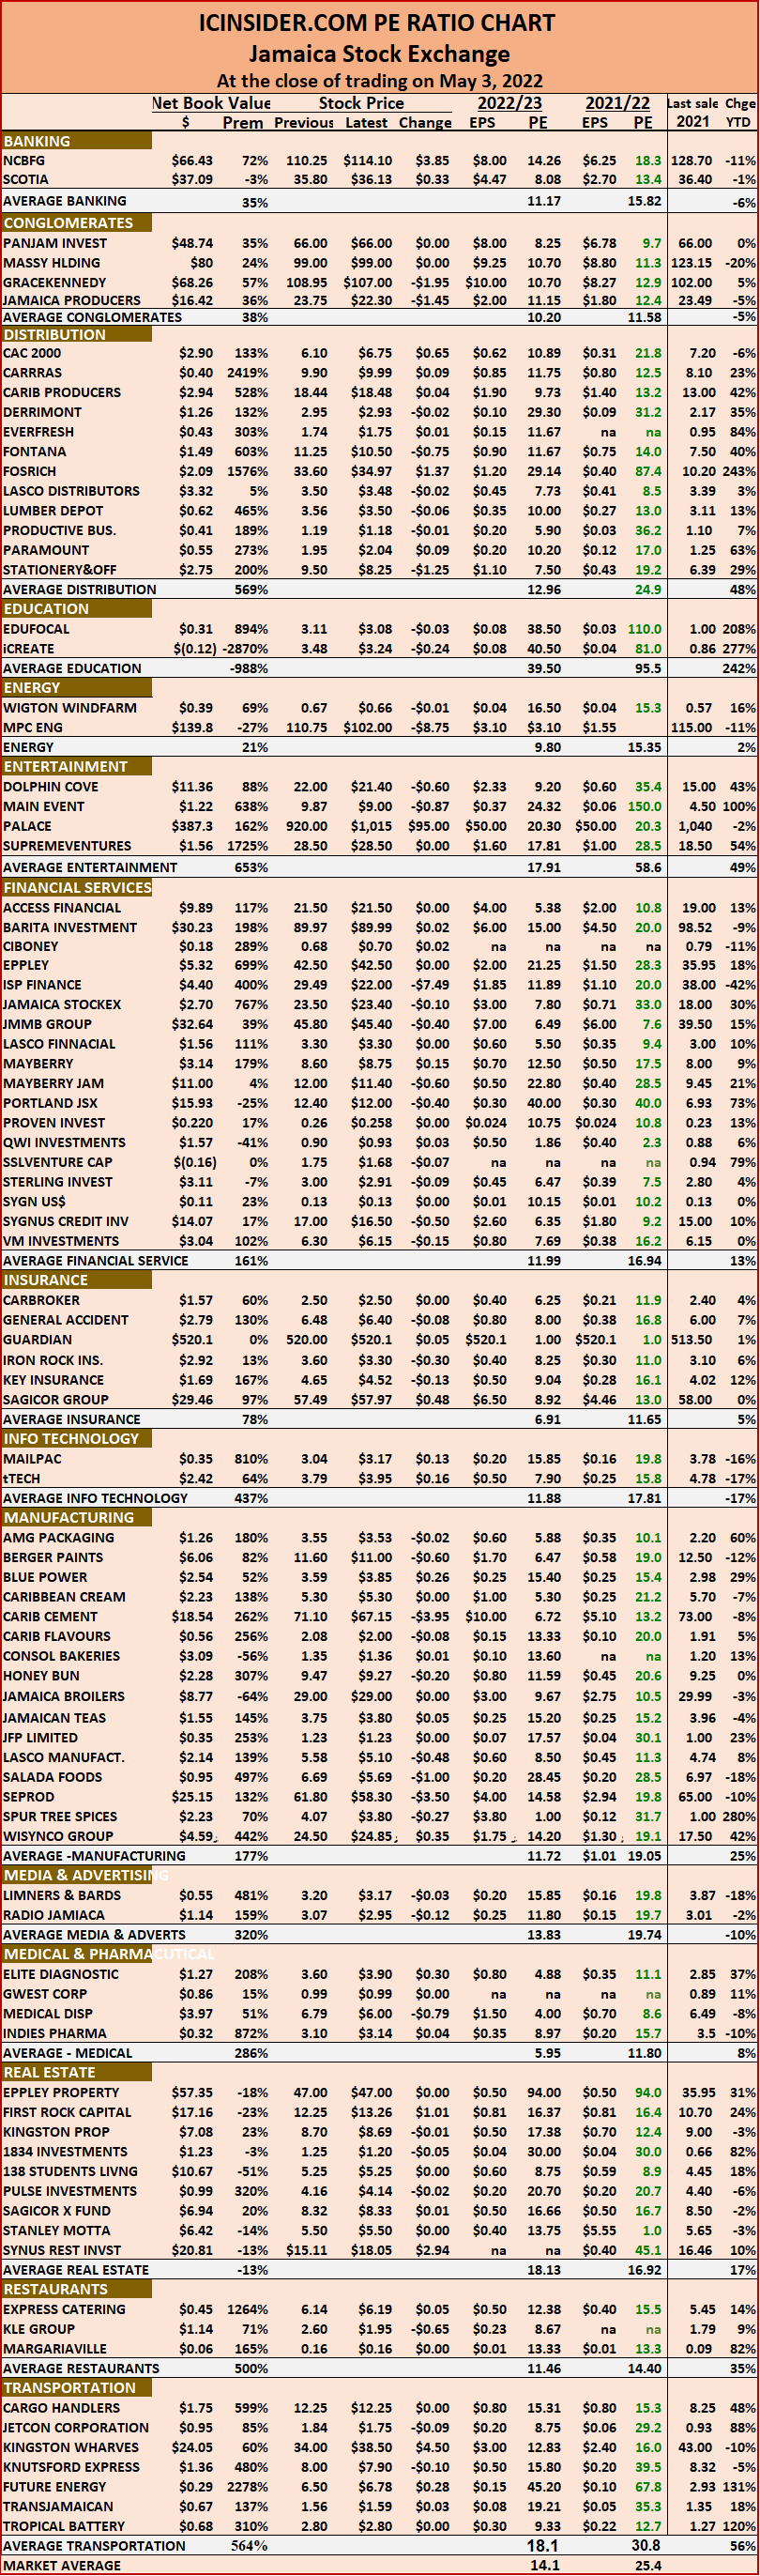 It shows companies grouped on an industry basis, allowing easy comparisons between the same sector companies and the overall market.
The net asset value of each company is reported as a guide to assess the value of stocks based on this measure quickly. The chart also shows daily changes in stock prices and the percentage year to date price movement based on the last traded prices. Dividends payable and yields for each company are shown in the Main and Junior Markets’ daily report charts that show the closing volume for the bids and offers.
The EPS & PE ratios are based on 2021 and 2022 actual or projected earnings, excluding major one off items. The PE Ratio is the most popular measure used to determine the value of stocks.