The Main Market listed Caribbean Producers dominated trading of the Jamaica Stock Exchange with 492.77 million shares valued at $5.17 billion with AS Bryan announcing an acquisition of 44.8 percent of the company, with the intention in the future to acquire majority control. Tuesday’s acquisition makes them the largest shareholders of the company and helped to push the Main market slightly lower at the close on Tuesday as the Junior Market JSE USD market closed moderately higher as trading ended with the number and value of stocks changing hands jumping sharply over the previous trading day, resulting in prices of 29 shares rising and 30 declining.
 At the close of trading, the JSE Combined Market Index slipped 98.55 points to close at 331,659.26, the All Jamaican Composite Index popped 58.72 points to end at 357,352.14, the JSE Main Index declined 315.16 points to 318,271.26. The Junior Market Index rallied 28.67 points to 3,808.51 and the JSE USD Market Index rose 0.15 points to 238.63.
At the close of trading, 505,129,200 shares were exchanged in all three markets, up from 7,306,298 units on Monday, with the value of stocks traded on the Junior and Main markets amounted to $5.2 billion, well over the $38.49 million on the previous trading day and the JSE USD market closed with an exchange of 331,393 shares for US$15,388 compared to 250,977 units at US$20,236 on Monday.
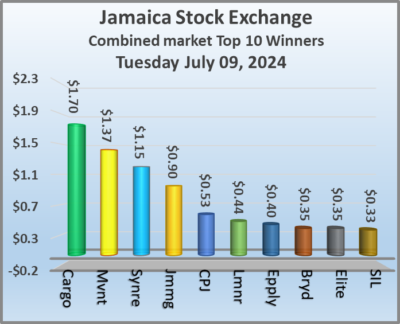
In Main Market activity, Caribbean Producers led trading with 492.77 million shares followed by Transjamaican Highway with 1.49 million stocks sand Wigton Windfarm with 798,214 units.
In Junior Market trading, EduFocal led trading with 5.21 million shares followed by Derrimon Trading with 741,995 stocks and the recently listed Omni Industries with 512,520 units.
 In the preference segment, Sygnus Credit Investments C10.5% rose $2 to close at $110.
The market’s PE ratio, the most popular measure used to value stocks, ended at 21.1 on 2023-24 earnings and 14.1 times those for 2024-25 at the close of trading. ICInsider.com PE ratio chart and more detailed daily charts provide investors with regularly updated information to help decision-making.
The PE ratio chart covers all ordinary shares on the Jamaica Stock Exchange, grouped by industry, allowing for easy comparisons within a sector and the overall market. The EPS & PE ratios are based on 2023 and 2024 actual or projected earnings, excluding major one off items.
Pertinent information is required to navigate numerous investment options successfully in the stock market. The ICInsider.com PE ratio chart and more detailed daily charts provide investors with regularly updated information to help decision-making.
The chart should be used in making rational decisions when investing in stocks close to the average for the sector, not going too far from it unless there are compelling reasons to do so. This approach helps to remove emotions from investment decisions and place them on fundamentals while at the same time not being too far from the majority of investors. 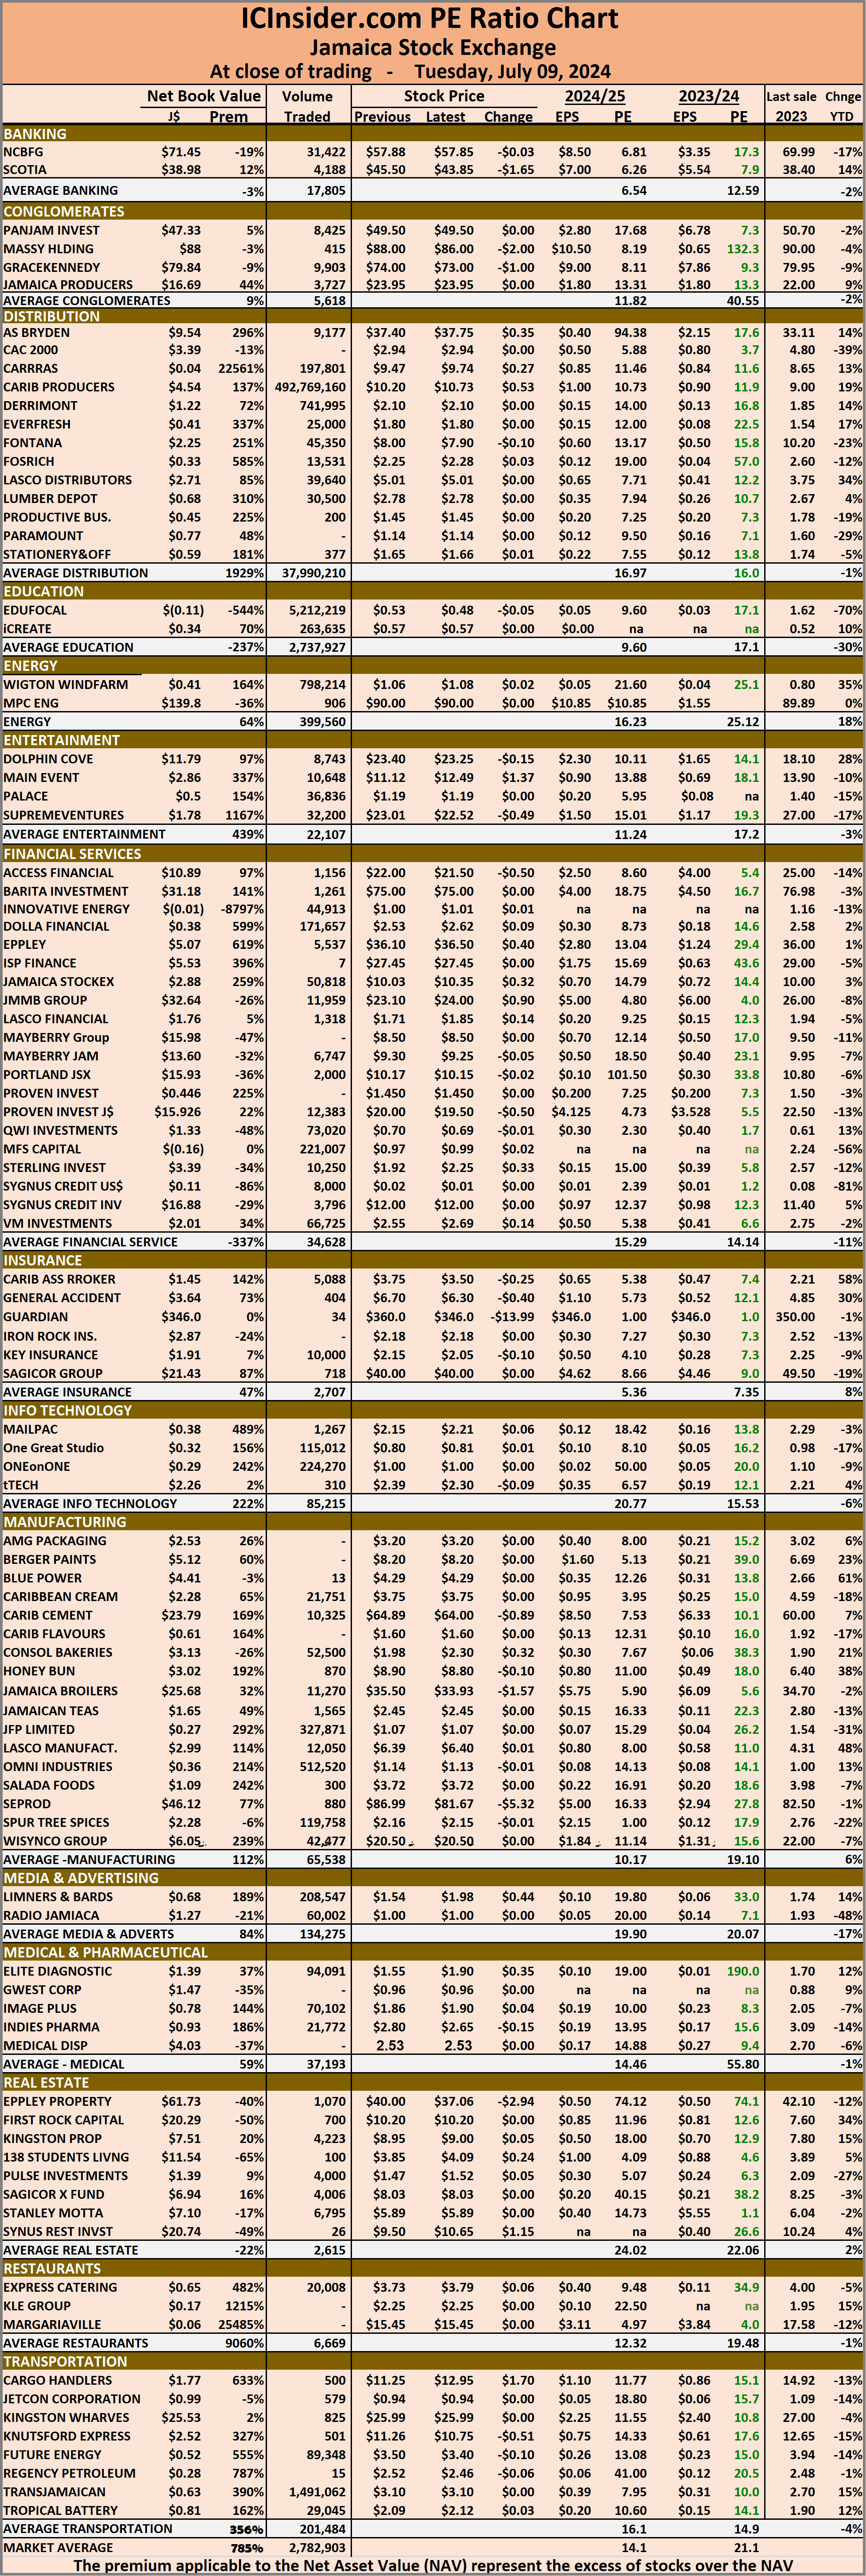 Investors who buy when the price of a stock is close to the average will find that they are not inclined to overpay for a stock.
The net asset value of each company is reported as a guide for investors to quickly assess the value of stocks based on this measure. The chart also shows daily changes in stock prices and the percentage year to date price movement based on the last traded prices.
Dividends paid or payable and yields for each company are shown in the Main and Junior Markets’ daily report charts, along with the closing volume of the highest bid and the lowest offer for each company.
CPJ pushes Jamaica Stock Exchange trading
July 9, 2024 by IC Insider.com
Filed Under: Feature Stories, JSE Combined, Stock Market Tagged With: 138 Student Living, Caribbean Cement, Daily Trading, Emerging market, Eppley, Jamaica Producers, Jamaica Stock Exchange, Jamaica Stock Exchange Combined Index, Jamaican stocks, JPS, JSE Main Index, junior market, Junior Market index, NCB Financial, Net asset Value of Jamaican stocks, Pan Jam, PE Ratio of Jamaican stocks, Productive Business Solutions, Scotia Group, Seprod, Trading Activity, Transjamaican Highway, Wigton Windfarm
About IC Insider.com