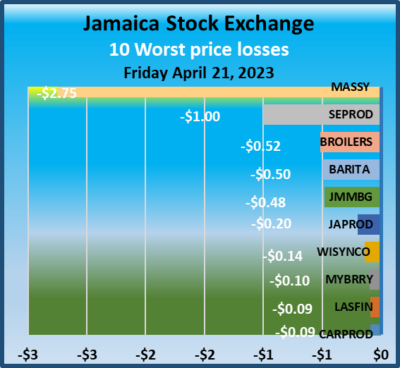
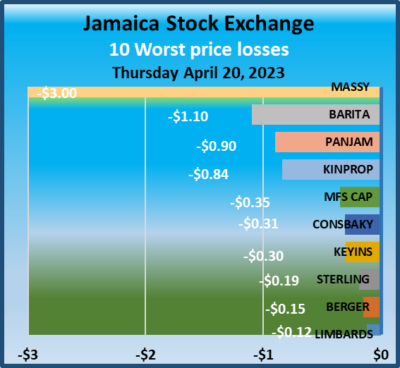
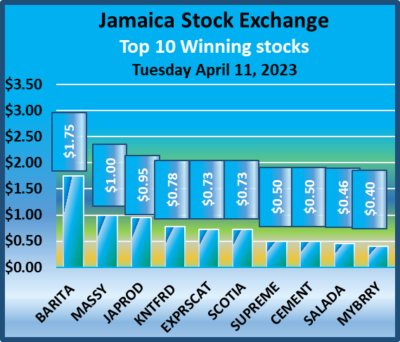
All three markets and the Jamaica Stock Exchange recorded gains to close out the week on Friday of trading on Thursday, with a fall in the volume and value of stocks changing hands compared to Thursday but with a higher value as trading in the JSE USD surged sharply over Thursday’s levels.
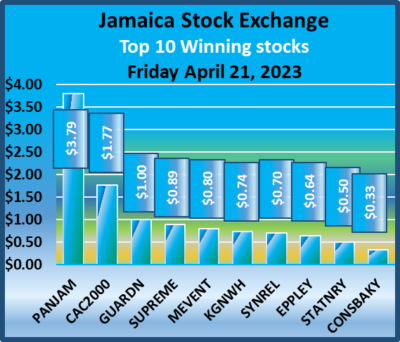 Trading ended with the JSE Combined Market Index rallying 448.42 points to 344,198.94. The All Jamaican Composite Index rose 1,723.12 points to 374,094.82, the JSE Main Index gained 275.40 points to conclude trading at 331,860.65, while the Junior Market Index climbed 20.92 points to 3,774.36 and the JSE USD Market Index popped 3.79 points to finish at 243.29. Shares in the preference segment of the Main Market that are not included in the TOP10 graphs had JPS 9.5 percent plummeting $150 to $2,850 while the JPS 7 percent rose $3.35 to $39.
At the close, investors exchanged 14,514,651 shares in all three markets, down from 27,419,909 units on Thursday, with the value of stocks trading amounting to $135 million up from $110.57 million on Thursday. Trading on the JSE USD market resulted in investors exchanging 1,282,434 shares for US$220.084, up sharply from 131,288 units at US$26,722 on Thursday.
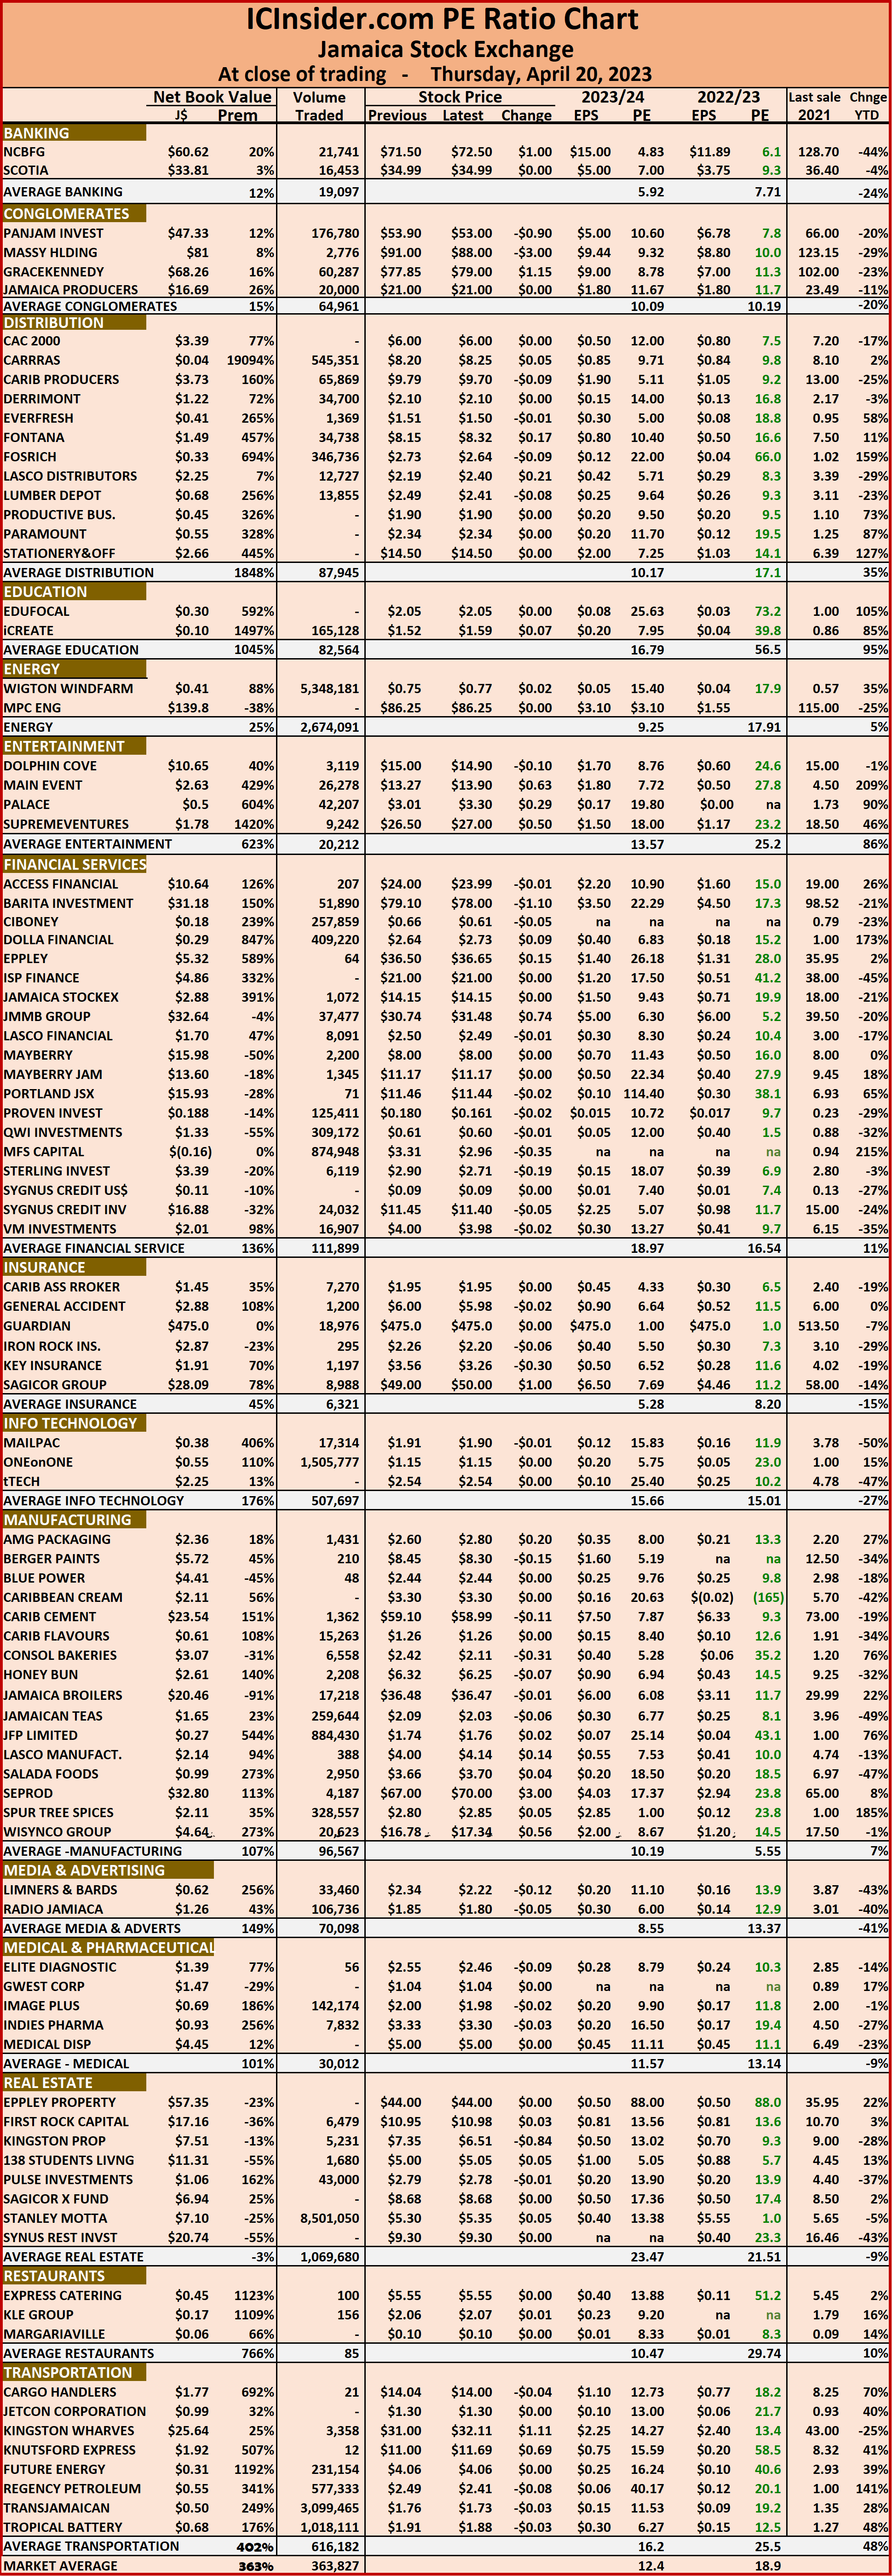
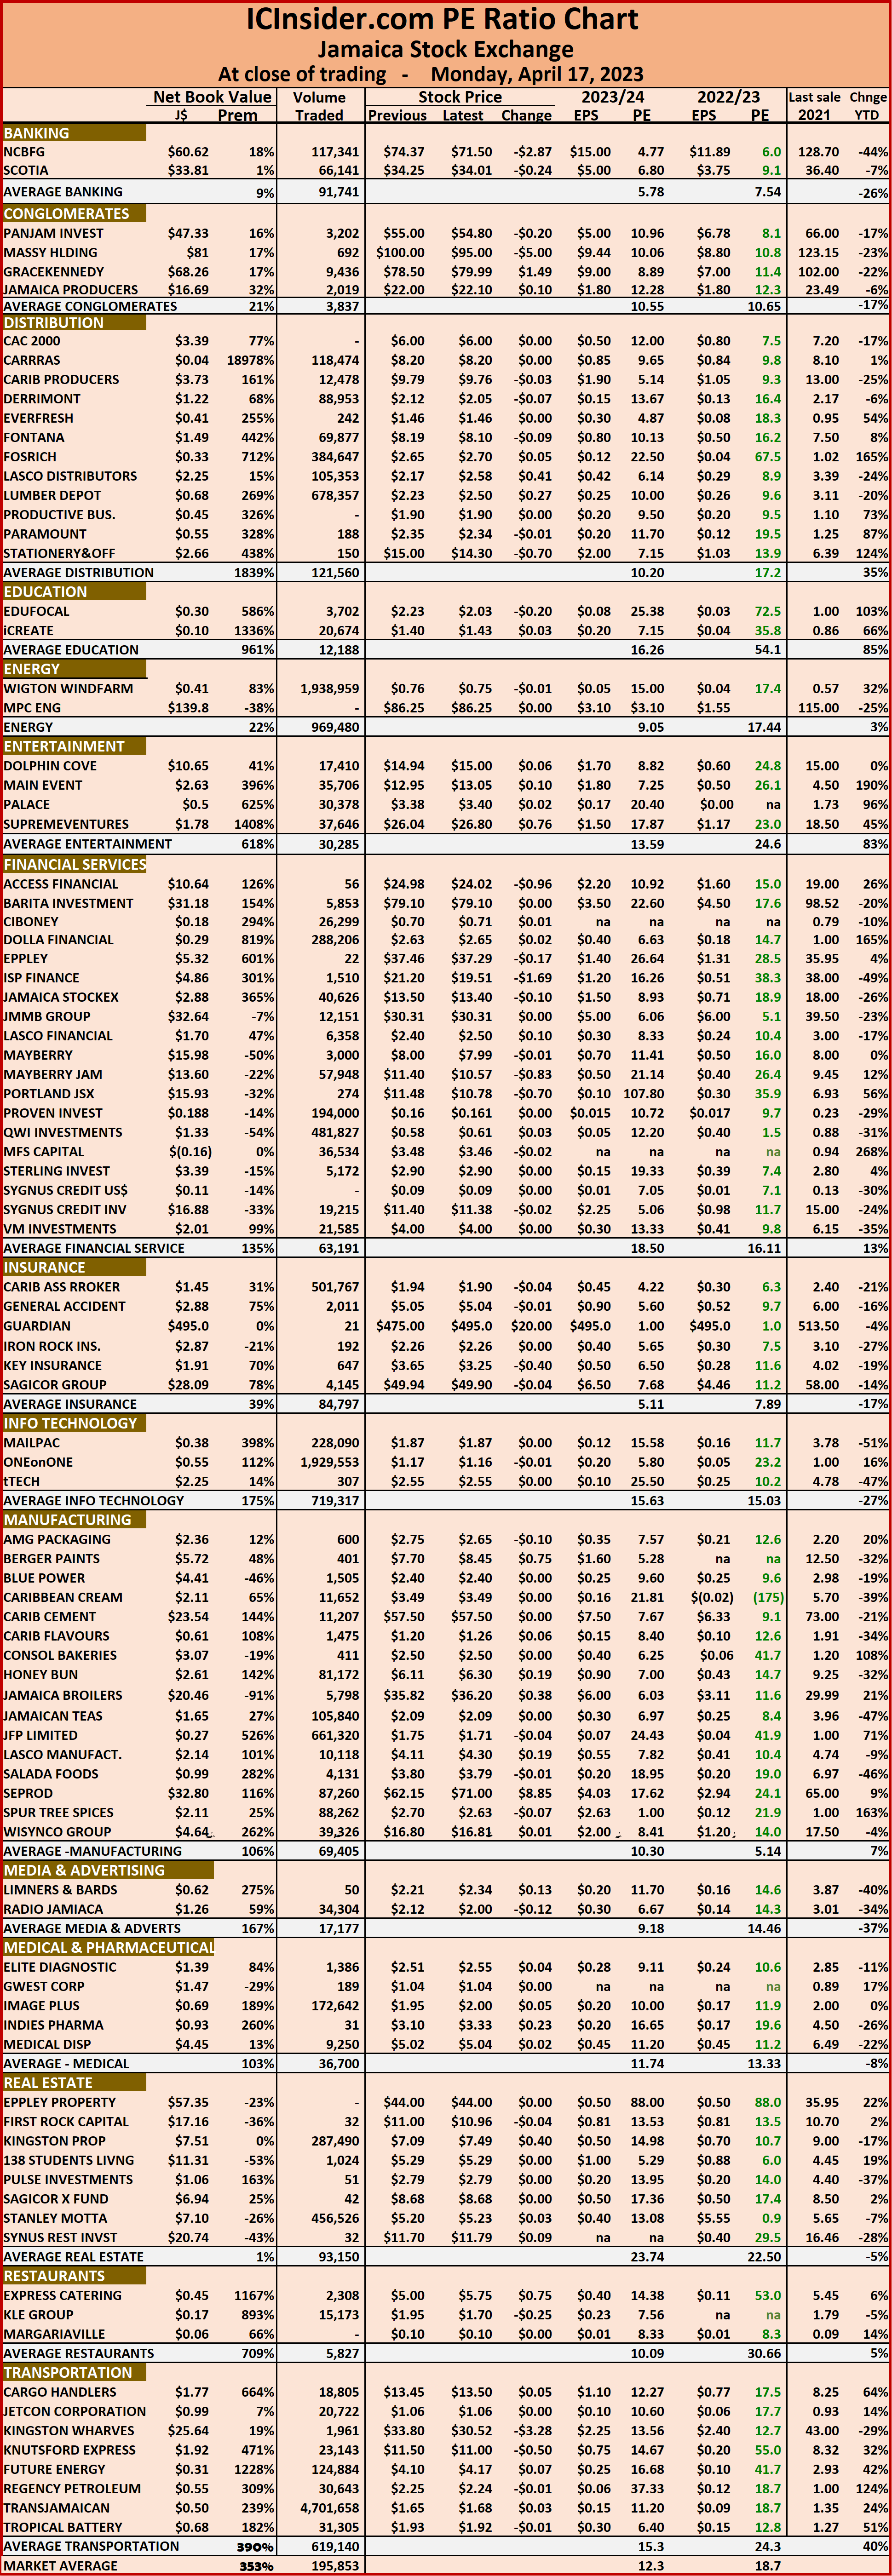
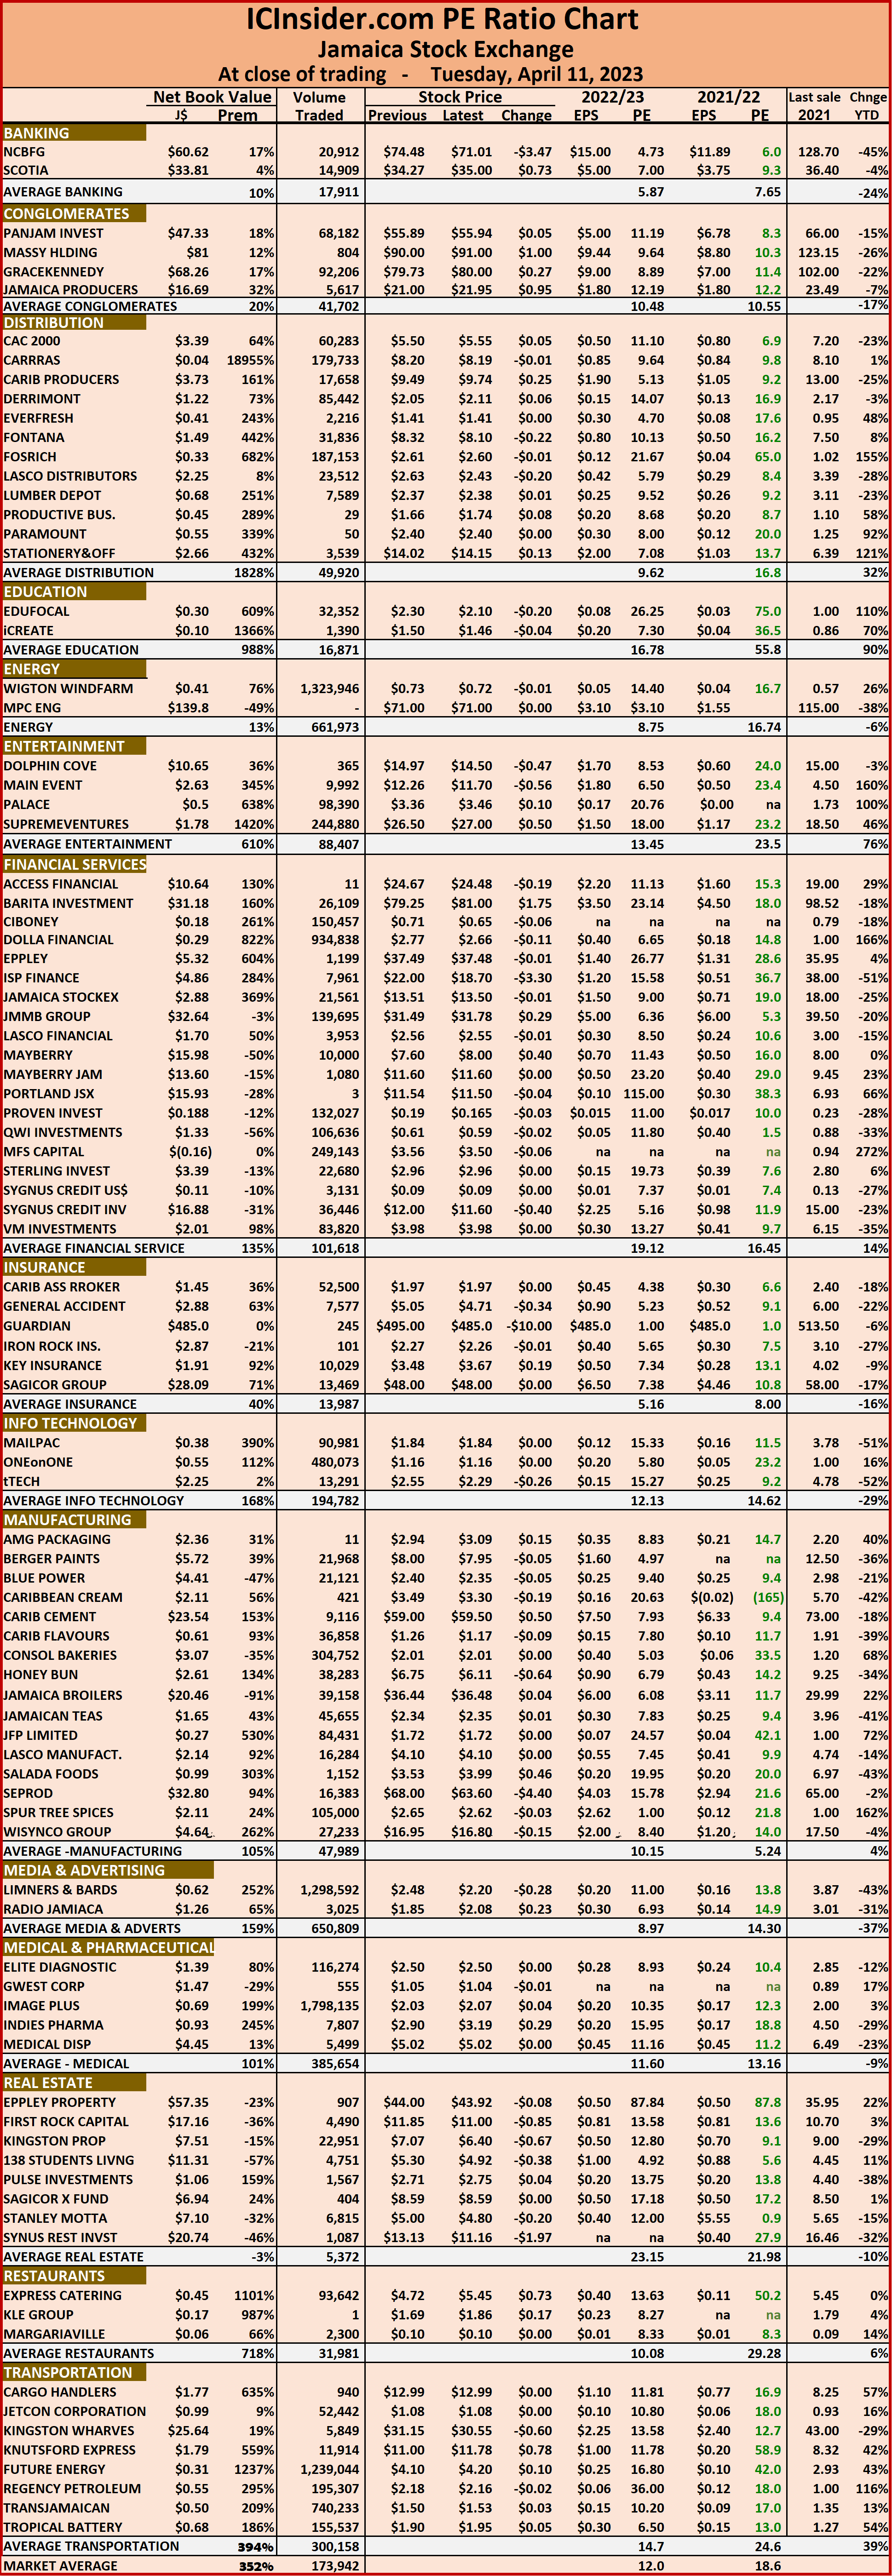
 The market’s PE ratio ended at 19.2 on 2022-23 earnings and 12.6 times those for 2023-24 at the close of trading.
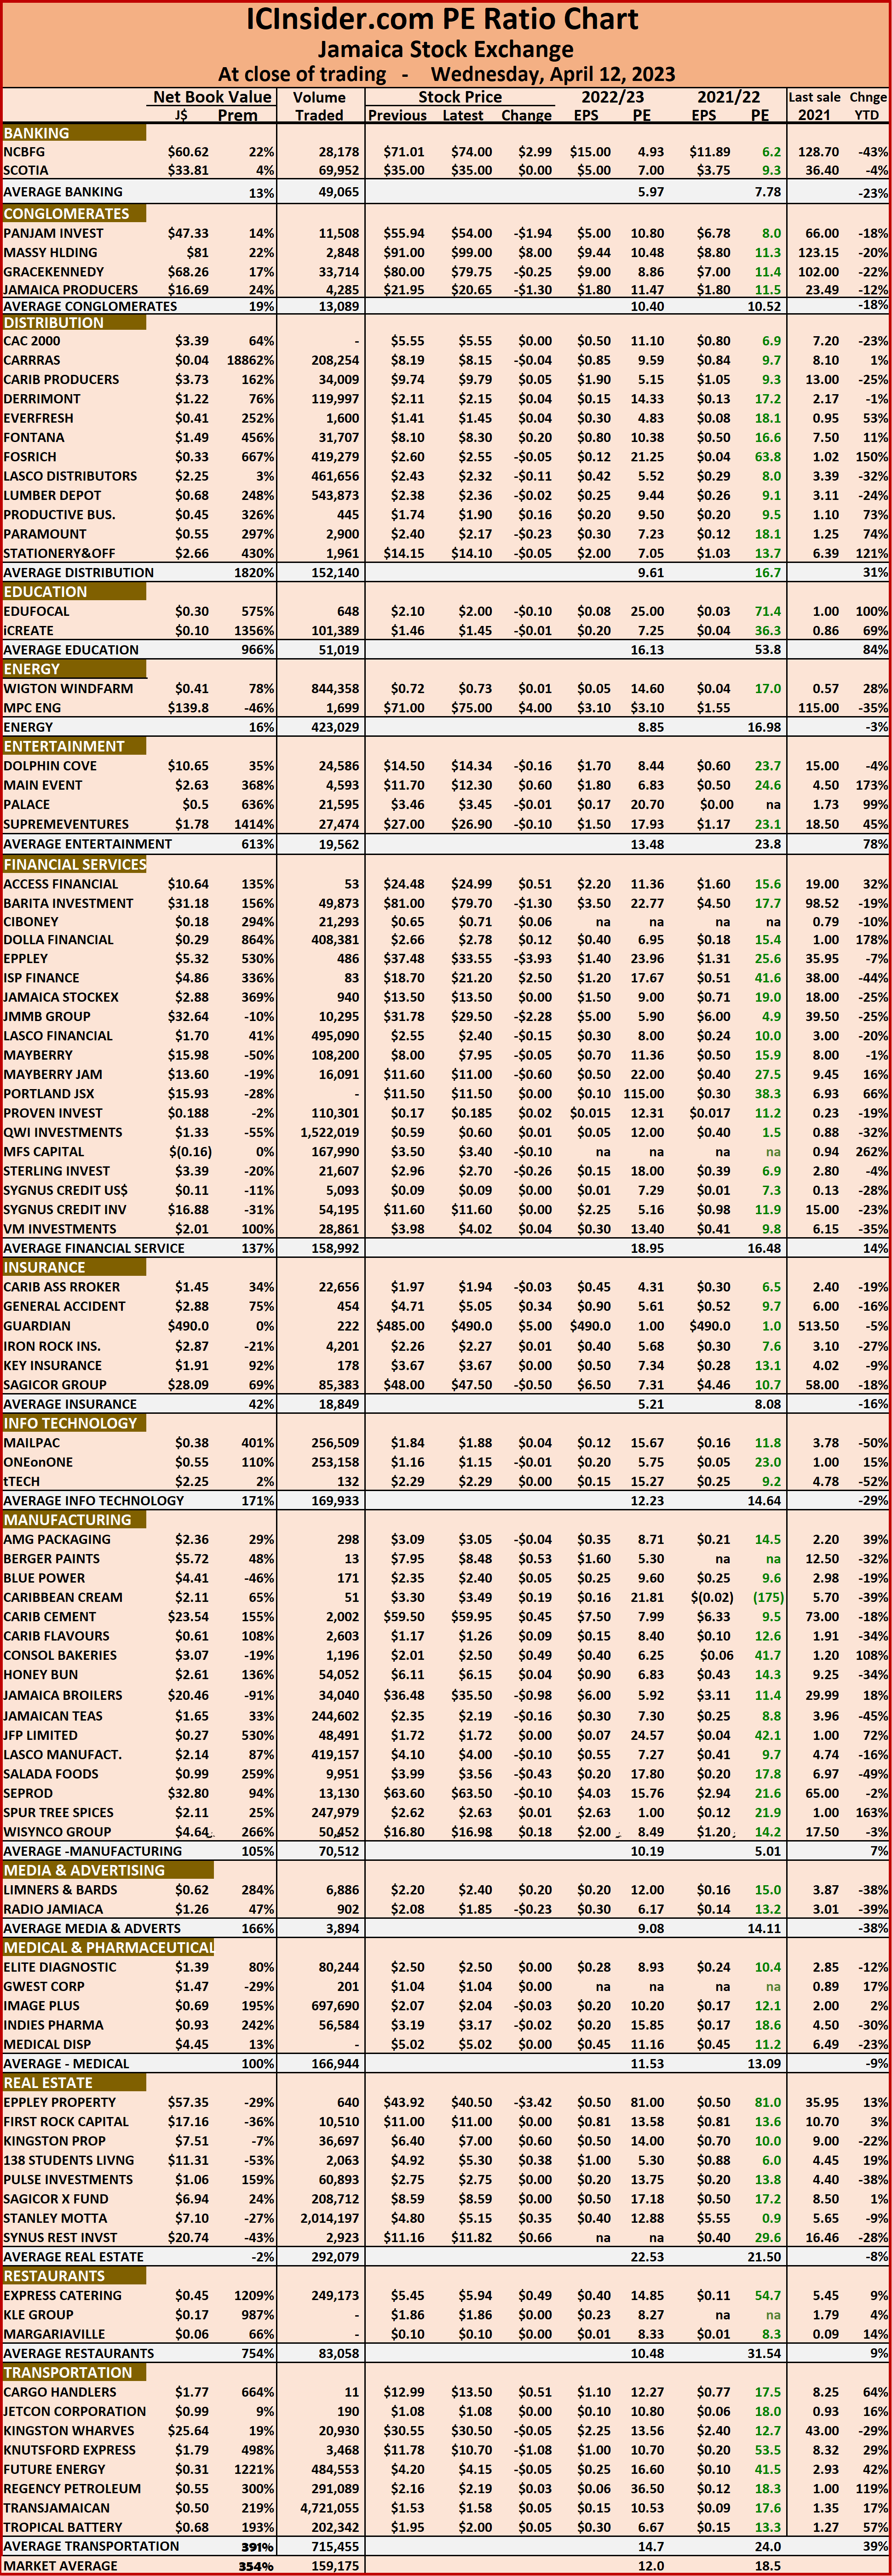
Investors need pertinent information to successfully navigate numerous investment options in the local stock market. The ICInsider.com PE ratio chart and the more detailed daily report charts provide investors with regularly updated information to help decision-making.
Investors should use the chart to help make rational decisions when investing in stocks close to the average for the sector and not going too far from it unless there are compelling reasons to do so. This approach helps to remove emotions from investment decisions and put in on fundamentals while at the same time not being too far from the majority of investors. Investors who buy when the price of a stock is close to the average will find that they are not inclined to overpay for a stock.
The ICInsider.com PE Ratio chart covers all ordinary shares on the Jamaica Stock Exchange and shows companies grouped on an industry basis, allowing easy comparisons between the same sector companies and the overall market.
The net asset value of each company is reported as a guide to assess the value of stocks based on this measure quickly. The chart also shows daily changes in stock prices and the percentage year to date price movement based on the last traded prices.
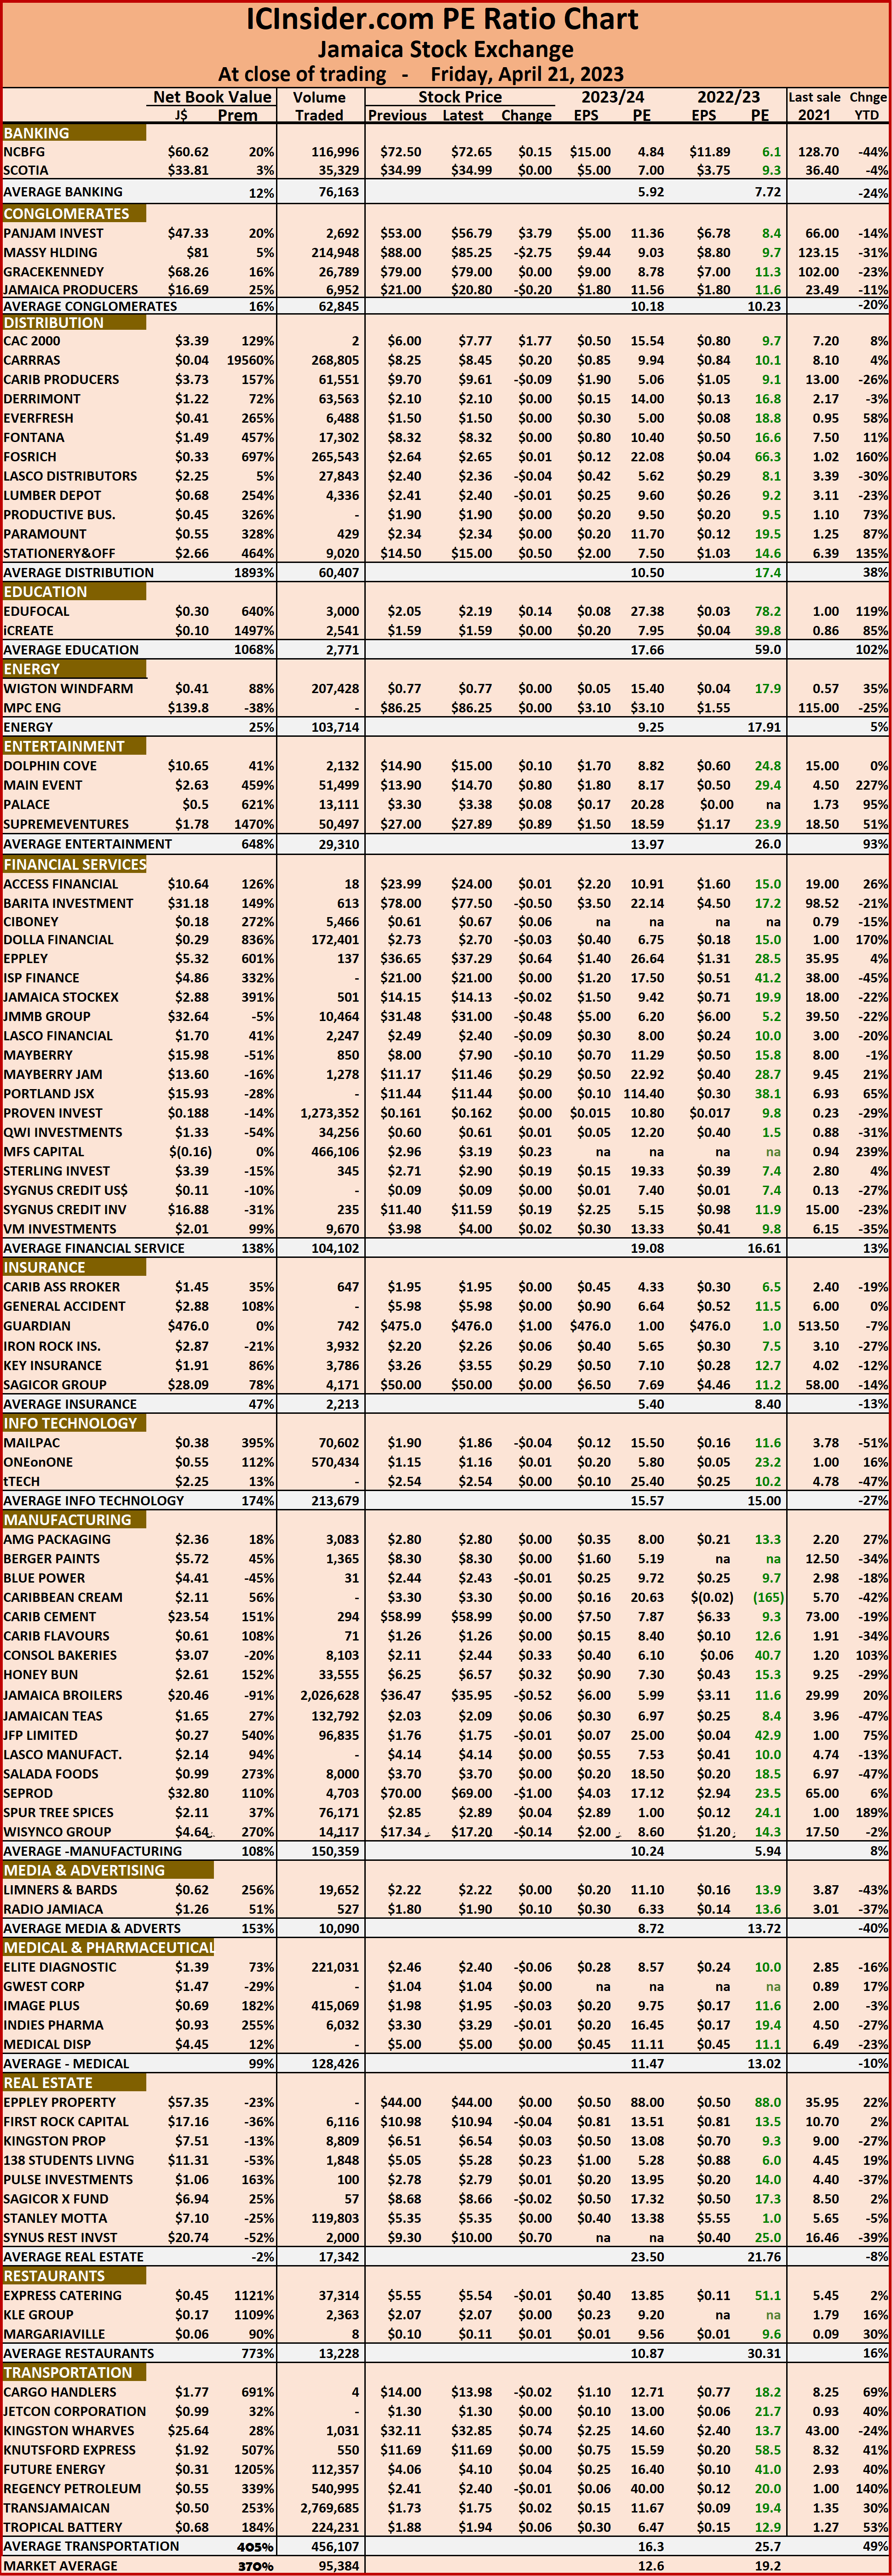 Dividends that are payable and yields for each company are shown in the Main and Junior Markets’ daily report charts that also show the closing volume pertaining to the bids and offers for each company.
The EPS & PE ratios are based on 2021 and 2022 actual or projected earnings, excluding major one off items. The PE Ratio is the most popular measure used to determine the value of stocks.
Gains for Junior & Main Market
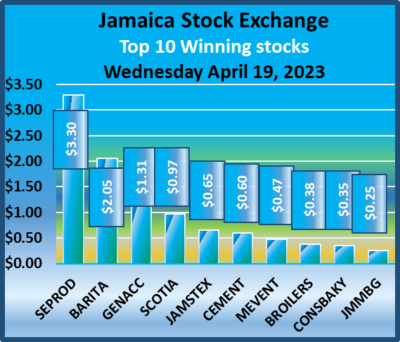
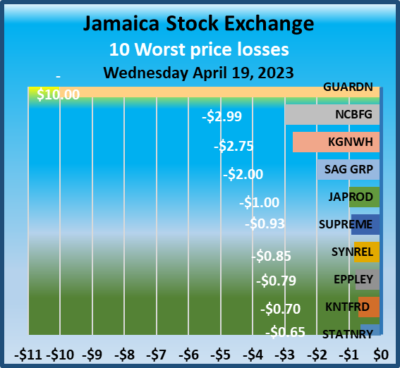
The Main Market and the Junior Markets held on to early morning gains at the close of trading on the Jamaica Stock Exchange on Thursday, but the JSE USD declined, with a fall in the volume and value of stocks changing hands compared to Wednesday.
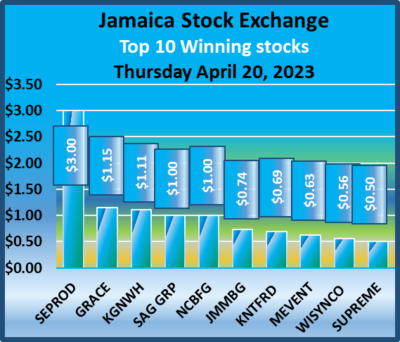 At the close of trading the JSE Combined Market Index rose 466.19 points to close at 343,750.52, the All Jamaican Composite Index surged 2,484.10 points to 372,371.70, the JSE Main Index popped 275.12 points to 331,585.25, while the Junior Market Index rose 22.89 points to 3,753.44 and the JSE USD Market Index dipped 3.57 points to 239.50.
No stocks in the preference segment of the Main Market that are not included in the TOP10 graphs had any notable change.
At the close, investors traded 27,419,909 shares in all three markets, up from 31,232,072 units on Wednesday, with the value of stocks trading amounting to $110.57 million down from $141.76 million on Wednesday. Trading on the JSE USD market resulted in investors exchanging 131,288 shares for US$26,722, up from 1,049,056 units at US$18,330 on Wednesday.
 The market’s PE ratio ended at 18.9 on 2022-23 earnings and 12.4 times those for 2023-24 at the close of trading.
Investors need pertinent information to successfully navigate numerous investment options in the local stock market. The ICInsider.com PE ratio chart and the more detailed daily report charts provide investors with regularly updated information to help decision-making.
Investors should use the chart to help make rational decisions when investing in stocks close to the average for the sector and not going too far from it unless there are compelling reasons to do so. This approach helps to remove emotions from investment decisions and put in on fundamentals while at the same time not being too far from the majority of investors. Investors who buy when the price of a stock is close to the average will find that they are not inclined to overpay for a stock.
The ICInsider.com PE Ratio chart covers all ordinary shares on the Jamaica Stock Exchange and shows companies grouped on an industry basis, allowing easy comparisons between the same sector companies and the overall market.
The net asset value of each company is reported as a guide to assess the value of stocks based on this measure quickly. The chart also shows daily changes in stock prices and the percentage year to date price movement based on the last traded prices.
 Dividends that are payable and yields for each company are shown in the Main and Junior Markets’ daily report charts that also show the closing volume pertaining to the bids and offers for each company.
The EPS & PE ratios are based on 2021 and 2022 actual or projected earnings, excluding major one off items. The PE Ratio is the most popular measure used to determine the value of stocks.
Junior & USD market rise Main Market falls
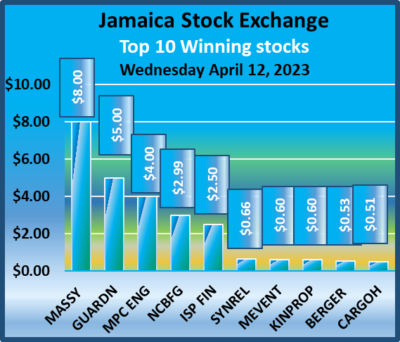
The JSE USD the Junior Markets recorded gains at the close of trading on the Jamaica Stock Exchange on Wednesday but the Main Market declined after trading closed with an increase in the volume and value of stocks changing hands compared to trading on Tuesday.
 Trading ended after the JSE Combined Market Index shed 2,960.06 points to end at 343,284.33, the All Jamaican Composite Index declined 2,286.40 points to 369,887.60, the JSE Main Index dropped 3,351.63 points to close at 331,310.13, while the Junior Market Index rose 18.27 points to 3,730.55 and the JSE USD Market Index rallied 2.43 points to 243.07.
In the preference segment of the Main Market that is not reflected in the TOP10 graphs 138 SLVR fell $3.08 to $74 and JPS 7 percent rose $4.65 to $35.65.
At the close, investors exchanged 31,232,072 shares in all three markets, up from 14,512,825 units on Tuesday, with the value of stocks trading amounting to $141.76 million up from $89.69 million on Tuesday. Trading on the JSE USD market resulted in investors exchanging 1,049,056 shares for US$18,330, up from 69,500 units at US$4,092 on Tuesday.
 The market’s PE ratio ended at 18.8 on 2022-23 earnings and 12.4 times those for 2023-24 at the close of trading.
Investors need pertinent information to successfully navigate numerous investment options in the local stock market. The ICInsider.com PE ratio chart and the more detailed daily report charts provide investors with regularly updated information to help decision-making.
Investors should use the chart to help make rational decisions when investing in stocks close to the average for the sector and not going too far from it unless there are compelling reasons to do so. This approach helps to remove emotions from investment decisions and put in on fundamentals while at the same time not being too far from the majority of investors. Investors who buy when the price of a stock is close to the average will find that they are not inclined to overpay for a stock.
The ICInsider.com PE Ratio chart covers all ordinary shares on the Jamaica Stock Exchange and shows companies grouped on an industry basis, allowing easy comparisons between the same sector companies and the overall market.
 The net asset value of each company is reported as a guide to assess the value of stocks based on this measure quickly. The chart also shows daily changes in stock prices and the percentage year to date price movement based on the last traded prices.
Dividends that are payable and yields for each company are shown in the Main and Junior Markets’ daily report charts that also show the closing volume pertaining to the bids and offers for each company.
The EPS & PE ratios are based on 2021 and 2022 actual or projected earnings, excluding major one off items. The PE Ratio is the most popular measure used to determine the value of stocks.
JSE Main & Junior Markets fall as USD market jumps
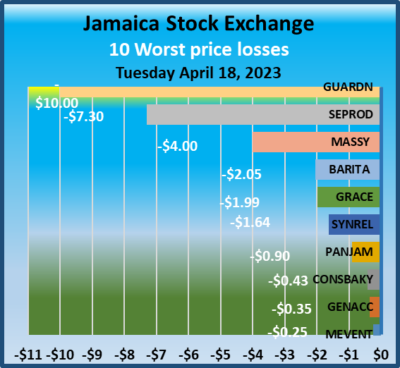
The JSE USD Market was the only one of the three markets to record gains at the close of trading on the Jamaica Stock Exchange on Tuesday, with the Junior Market just inching lower while the Main Market indices falling moderately after trading closed with a fall in the volume, with the value of stocks changing hands rising compared to trading on Monday.
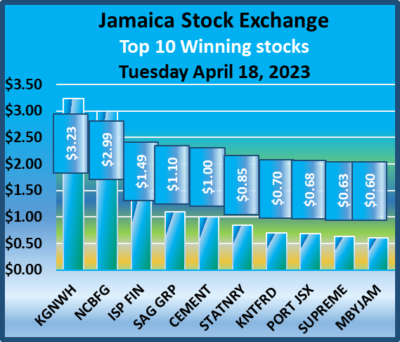 Trading ended after the JSE Combined Market Index shed 1,313.21 points to close trading at 346244.39, the All Jamaican Composite Index declined by 831.45 points to 372,174.00, the JSE Main Index dropped 1,387.56 points to conclude trading at 334,661.76, while the Junior Market Index slipped a mere 2.02 points to 3,712.28 and the JSE USD Market Index climbed 6.12 points to close at 240.64.
In the preference segment of the Main Market that is not reflected in the TOP10 graphs, Eppley 7.75 percent rose $3.82 to $20.02.
At the close, investors exchanged 14,512,825 shares in all three markets, down from 15,538,967 units on Monday, with the value of stocks trading amounting to $89.69 million up from $52.4 million on Monday. Trading on the JSE USD market resulted in investors exchanging 69,500 shares for US$4,092 down from 353,880 units at US$40,414 on Monday.
 The market’s PE ratio ended at 19.1 on 2022-23 earnings and 12.5 times those for 2023-24 at the close of trading.
Investors need pertinent information to successfully navigate numerous investment options in the local stock market. The ICInsider.com PE ratio chart and the more detailed daily report charts provide investors with regularly updated information to help decision-making.
Investors should use the chart to help make rational decisions when investing in stocks close to the average for the sector and not going too far from it unless there are compelling reasons to do so. This approach helps to remove emotions from investment decisions and put in on fundamentals while at the same time not being too far from the majority of investors. Investors who buy when the price of a stock is close to the average will find that they are not inclined to overpay for a stock.
The ICInsider.com PE Ratio chart covers all ordinary shares on the Jamaica Stock Exchange and shows companies grouped on an industry basis, allowing easy comparisons between the same sector companies and the overall market.
The net asset value of each company is reported as a guide to assess the value of stocks based on this measure quickly. The chart also shows daily changes in stock prices and the percentage year to date price movement based on the last traded prices.
 Dividends that are payable and yields for each company are shown in the Main and Junior Markets’ daily report charts that also show the closing volume pertaining to the bids and offers for each company.
The EPS & PE ratios are based on 2021 and 2022 actual or projected earnings, excluding major one off items. The PE Ratio is the most popular measure used to determine the value of stocks.
Gains for JSE Main & Junior Markets
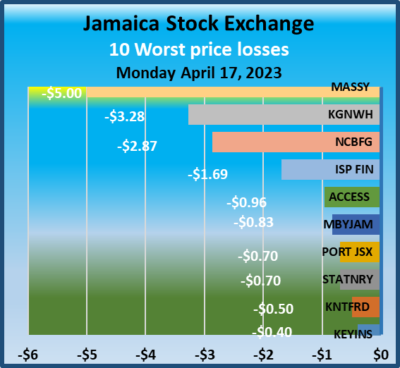
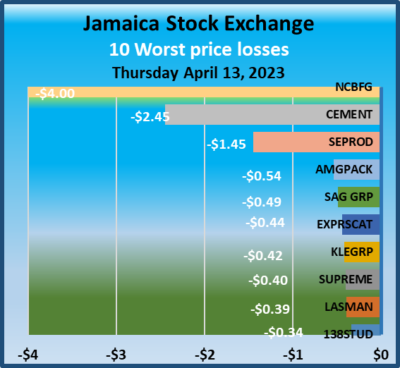
The Main Market and the Junior Market of the Jamaica Stock Exchange started the week with gains while the USD market slipped at the close of trading on Monday as the markets continued to remain in a consolidation mood, but trading closed with a fall in the volume and value of stocks changing hands compared to trading on Friday.
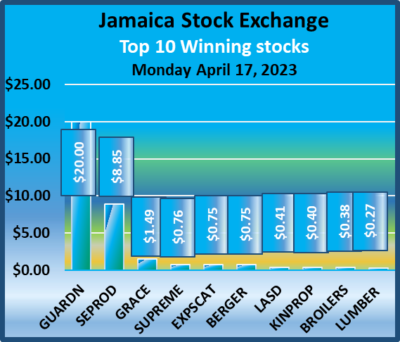 At the close, the JSE Combined Market Index climbed 997.95 points to end trading at 347,557.60, the All Jamaican Composite Index popped 1,881.29 points to 373,005.45, the JSE Main Index rose 593.23 points to 336,049.32, while the Junior Market Index jumped 48.55 points to 3,714.30 and the JSE USD Market Index dipped 2.45 points to close at 234.52.
In the preference segment of the Main Market that is not reflected in the TOP10 graphs JPS 7 percent dropped $8.61 to $31.70 and PBS 9.75% fell $1 to $107.
At the close, investors exchanged 15,538,967 shares in all three markets, down from 30,527,346 units on Friday, with the value of stocks trading on Monday amounting to $52.4 million down from $69.48 million on Friday. Trading on the JSE USD market resulted in investors trading 353,880 shares for US$40,414, down from 506,557 units at US$55,262 on Friday.
 The market’s PE ratio ended at 18.7 on 2022-23 earnings and 12.3 times those for 2023-24 at the close of trading.
Investors need pertinent information to successfully navigate numerous investment options in the local stock market. The ICInsider.com PE ratio chart and the more detailed daily report charts provide investors with regularly updated information to help decision-making.
Investors should use the chart to help make rational decisions when investing in stocks close to the average for the sector and not going too far from it unless there are compelling reasons to do so. This approach helps to remove emotions from investment decisions and put in on fundamentals while at the same time not being too far from the majority of investors. Investors who buy when the price of a stock is close to the average will find that they are not inclined to overpay for a stock.
The ICInsider.com PE Ratio chart covers all ordinary shares on the Jamaica Stock Exchange and shows companies grouped on an industry basis, allowing easy comparisons between the same sector companies and the overall market.
The net asset value of each company is reported as a guide to assess the value of stocks based on this measure quickly. The chart also shows daily changes in stock prices and the percentage year to date price movement based on the last traded prices.
 Dividends that are payable and yields for each company are shown in the Main and Junior Markets’ daily report charts that also show the closing volume pertaining to the bids and offers for each company.
The EPS & PE ratios are based on 2021 and 2022 actual or projected earnings, excluding major one off items. The PE Ratio is the most popular measure used to determine the value of stocks.
JSE Main & USD market jump
The Main Market of the Jamaica Stock Exchange closed out the week with gains while the USD market surged on Friday as the Junior Market traded in a narrow range Friday and slipped modestly at the close as the markets continue to be in a consolidation mood, but the market closed with a fall in the volume and value of stocks changing hands compared to trading on Thursday.
 Trading ended on Friday with the JSE Combined Market Index climbing 2,909.46 points to 346,559.65, the All Jamaican Composite Index surging 3,997.53 points to 371,124.16, the JSE Main Index jumping 3,317.57 points to conclude trading for the week at 335,456.09, up over 4,000 points for the week, while the Junior Market Index dropped 20.33 points to end at 3,665.75 and the JSE USD Market Index popped 7.61 points to conclude at 236.97.
In the preference section of the Main Market that is not reflected in the TOP10 graphs JPS 7 percent dropped $19.69 to $40.31.
At the close, investors exchanged 30,527,346 shares in all three markets, down from 44,225,452 units on Thursday, with the value of trading on Friday amounting to $69.48 million from $113.3 million on the previous trading day. Trading on the JSE USD market resulted in investors exchanging 506,557 shares for US$55,262, down from 12,382,341 units at US$179,206 21,164 on Thursday.
 The market’s PE ratio ended at 18.7 on 2022-23 earnings and 12.2 times those for 2023-24 at the close of trading.
Investors need pertinent information to successfully navigate numerous investment options in the local stock market. The ICInsider.com PE ratio chart and the more detailed daily report charts provide investors with regularly updated information to help decision-making.
Investors should use the chart to help make rational decisions when investing in stocks close to the average for the sector and not going too far from it unless there are compelling reasons to do so. This approach helps to remove emotions from investment decisions and put in on fundamentals while at the same time not being too far from the majority of investors. Investors who buy when the price of a stock is close to the average will find that they are not inclined to overpay for a stock.
The ICInsider.com PE Ratio chart covers all ordinary shares on the Jamaica Stock Exchange and shows companies grouped on an industry basis, allowing easy comparisons between the same sector companies and the overall market.
The net asset value of each company is reported as a guide to assess the value of stocks based on this measure quickly. The chart also shows daily changes in stock prices and the percentage year to date price movement based on the last traded prices.
 Dividends payable and yields for each company are shown in the Main and Junior Markets’ daily report charts that also show the closing volume pertaining to the bids and offers for each company.
The EPS & PE ratios are based on 2021 and 2022 actual or projected earnings, excluding major one off items. The PE Ratio is the most popular measure used to determine the value of stocks.
Consolidating Jamaica Stock Market
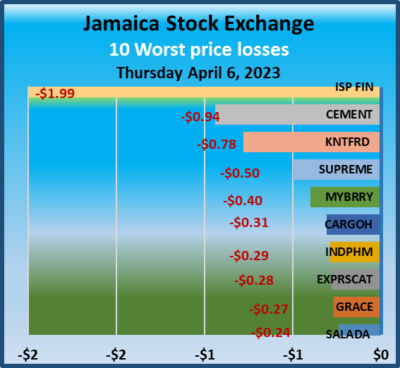
The Jamaica Stock Exchange remains in a consolidation mood on Thursday with the market indices recording modest to moderate changes at the close of trading as investors await market moving developments to move prices in one direction or another as they await first quarter results for the majority of companies and Bank of Jamaica interest rate moves, but the market enjoyed a rise in the volume and value of stocks changing hands compared to trading results on Wednesday.
 At the close of trading, the JSE Combined Market Index dropped 1,463.69 points to 343,650.19, the All Jamaican Composite Index fell 1,167.97 points to 367,126.63 after trading opened with the index up at 374,014.47 points, the JSE Main Index shed 1,446.13 to 332,138.52, the Junior Market Index lost 12.49 points to close at 3,686.08 after opening at 3,740 points in the morning session and the JSE USD Market Index rose 0.92 points to close at 229.36.
In the preference section of the Main Market that is not reflected in the TOP10 graphs, Eppley 7.25% fell $2.19 to end at $16.56 and JPS 7 percent popped $10 to $60.
At the close, investors exchanged 44,225,452 shares in all three markets, up from 19,384,296 units on Wednesday, with the value of trading on Thursday amounting to $113.3 million up from $64.8 million on the previous trading day. Trading on the JSE USD market resulted in investors exchanging 12,382,341 shares for US$179,206, up from 282,987 units at US$21,164 on Wednesday. Transjamaica Highway accounted for 13.148 million units valued at US$143,262, with the price hitting US$1.25 at the close.
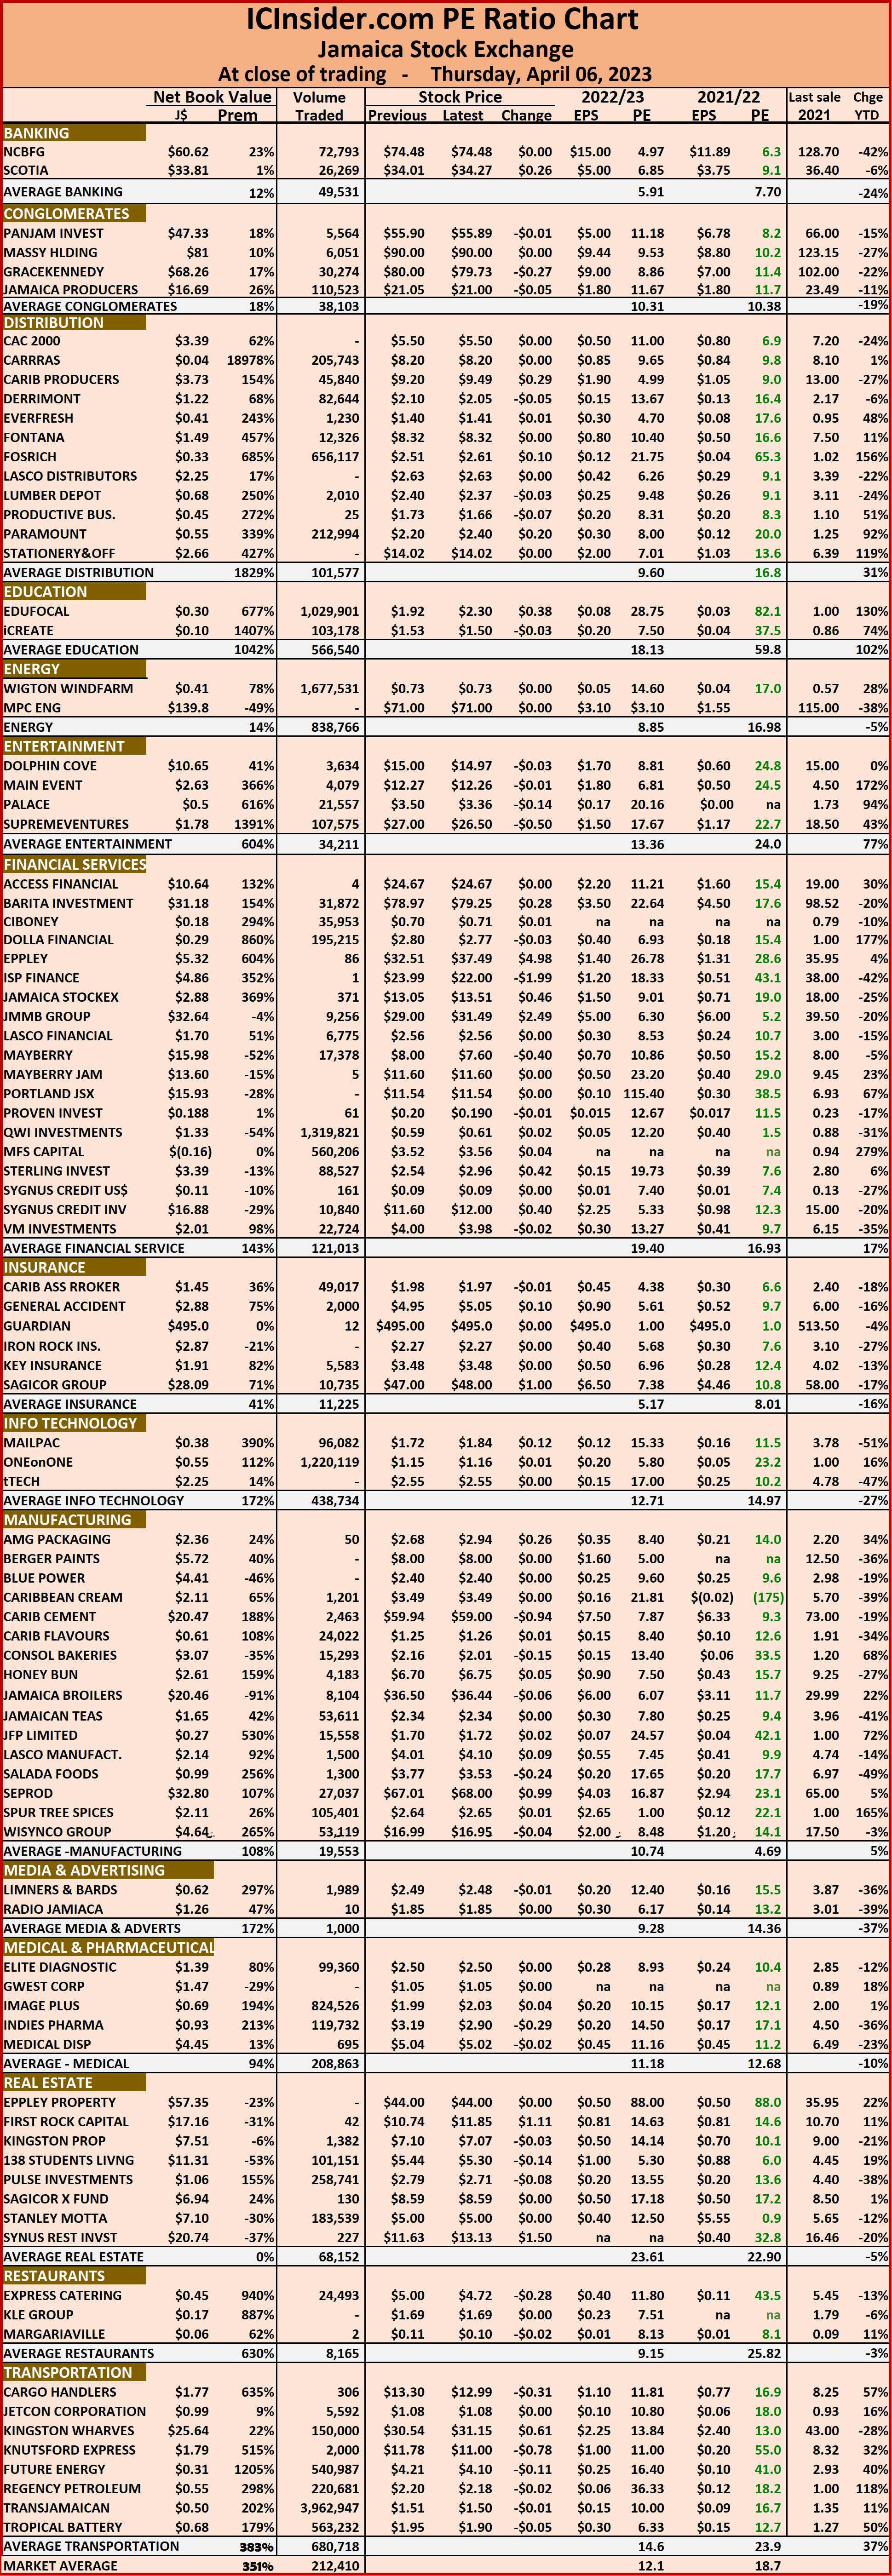
 The market’s PE ratio ended at 18.8 on 2022-23 earnings and 12.1 times those for 2023-24 at the close of trading.
investors need pertinent information to successfully navigate numerous investment options in the local stock market. The ICInsider.com PE ratio chart and the more detailed daily report charts provide investors with regularly updated information to help decision-making.
Investors should use the chart to help make rational decisions when investing in stocks close to the average for the sector and not going too far from it unless there are compelling reasons to do so. This approach helps to remove emotions from investment decisions and put in on fundamentals while at the same time not being too far from the majority of investors. Investors who buy when the price of a stock is close to the average will find that they are not inclined to overpay for a stock.
The ICInsider.com PE Ratio chart covers all ordinary shares on the Jamaica Stock Exchange and shows companies grouped on an industry basis, allowing easy comparisons between the same sector companies and the overall market.
The net asset value of each company is reported as a guide to assess the value of stocks based on this measure quickly. The chart also shows daily changes in stock prices and the percentage year to date price movement based on the last traded prices.
 Dividends payable and yields for each company are shown in the Main and Junior Markets’ daily report charts that also show the closing volume pertaining to the bids and offers for each company.
The EPS & PE ratios are based on 2021 and 2022 actual or projected earnings, excluding major one off items. The PE Ratio is the most popular measure used to determine the value of stocks.
Gains for Jamaica Stock Exchange
The JSE USD Market and the Main indices recorded gains on Wednesday but Junior Markets slipped at the close of the Jamaica Stock Exchange, following a moderate rise in the volume and value of stocks changing hands compared to trading results on Tuesday.
 At the close of trading, the JSE Combined Market Index popped 2,170.12 points to 345,113.88, the All Jamaican Composite Index fell 1,016.96 points to 368,294.60, the JSE Main Index rose 2,386.74 points to 333,584.65, the Junior Market Index dipped 4.92 points to 3,698.57 after trading over 3,780 points in the morning session and the JSE USD Market Index rose 8.49 points to 228.44.
In the preference section of the Main Market that is not reflected in the TOP10 graphs, JPS 7 percent dipped $11.53 to $50 and Eppley 5% lost $2.96 to end at $16.94 and Productivity Business Solutions 10.50% dropped $50 to $1,200.
At the close, investors exchanged 19,384,296 shares in all three markets, compared with 13,220,580 units on Tuesday, with the value of trading on Wednesday amounting to $64.8, million up from $58.84 million on the previous trading day. 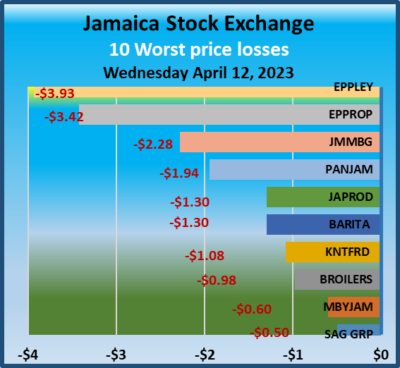 Trading on the JSE USD market resulted in the trading of 282,987 shares for US$21,164, from 299,535 units at US$25,772 on Tuesday.
The market’s PE ratio ended at 18.6 on 2021-22 earnings and 12 times those for 2022-23 at the close of trading.
Investors need pertinent information to successfully navigate numerous investment options in the local stock market. The ICInsider.com PE ratio chart and the more detailed daily report charts provide investors with regularly updated information to help decision-making.
Investors should use the chart to help make rational decisions when investing in stocks close to the average for the sector and not going too far from it unless there are compelling reasons to do so. This approach helps to remove emotions from investment decisions and put in on fundamentals while at the same time not being too far from the majority of investors. Investors who buy when the price of a stock is close to the average will find that they are not inclined to overpay for a stock.
The ICInsider.com PE Ratio chart covers all ordinary shares on the Jamaica Stock Exchange and shows companies grouped on an industry basis, allowing easy comparisons between the same sector companies and the overall market.
 The net asset value of each company is reported as a guide to assess the value of stocks based on this measure quickly. The chart also shows daily changes in stock prices and the percentage year to date price movement based on the last traded prices.
Dividends payable and yields for each company are shown in the Main and Junior Markets’ daily report charts that also show the closing volume pertaining to the bids and offers for each company.
The EPS & PE ratios are based on 2021 and 2022 actual or projected earnings, excluding major one off items. The PE Ratio is the most popular measure used to determine the value of stocks.
JSE Markets consolidating
Markets recorded gains on Tuesday following the closure of the Jamaica Stock Exchange for the long Easter weekend, commencing at the close on Thursday, with modest changes in the various market indices following moderate changes in the volume and value of stocks changing hands compared to Thursday.
 Trading ended with the JSE Combined Market Index dipping 139.10 points to close at 342,939.98, the All Jamaican Composite Index slipping 1,204.07 points to 369,311.56, the JSE Main Index dropping 195.10 points to 331,197.91, while the Junior Market popping 4.58 points to 3,703.49 and the JSE USD Market Index rising 0.04 points to finish at 219.95.
In the preference section of the Main Market that is not reflected in the TOP10 graphs, Eppley 5% lost $2.90 to end at $19.10 and JPS 7% dropped $8.17 to $61.53.
At the close, investors exchanged 13,220,580 shares in all three markets, compared with 18,066,552 units on Thursday, with the value of trading on Tuesday amounting to $58.84, million from $55.7 million on the previous trading day. Trading on the JSE USD market resulted in investors exchanging 299,535 shares for US$25,772, down from 694,591 units at US$29,863 on Thursday.
 The market’s PE ratio ended at 18.6 on 2021-22 earnings and 12 times those for 2022-23 at the close of trading.
Investors need pertinent information to successfully navigate numerous investment options in the local stock market. The ICInsider.com PE ratio chart and the more detailed daily report charts provide investors with regularly updated information to help decision-making.
Investors should use the chart to help make rational decisions when investing in stocks close to the average for the sector and not going too far from it unless there are compelling reasons to do so. This approach helps to remove emotions from investment decisions and put in on fundamentals while at the same time not being too far from the majority of investors. Investors who buy when the price of a stock is close to the average will find that they are not inclined to overpay for a stock.
The ICInsider.com PE Ratio chart covers all ordinary shares on the Jamaica Stock Exchange and shows companies grouped on an industry basis, allowing easy comparisons between the same sector companies and the overall market.
 The net asset value of each company is reported as a guide to assess the value of stocks based on this measure quickly. The chart also shows daily changes in stock prices and the percentage year to date price movement based on the last traded prices.
Dividends payable and yields for each company are shown in the Main and Junior Markets’ daily report charts that also show the closing volume pertaining to the bids and offers for each company.
The EPS & PE ratios are based on 2021 and 2022 actual or projected earnings, excluding major one off items. The PE Ratio is the most popular measure used to determine the value of stocks.
Gains for all three JSE Markets
Markets recorded gains ahead of the long Easter weekend break, on the Jamaica Stock Exchange Thursday, with the Main Market leading the way, with the market index climbing over 1,000 points while the Junior Market and the JSE USD market closed slightly higher.
 Trading ended with the JSE Combined Market Index popping 1,147.93 points to 343,075.79, the All Jamaican Composite Index rising 1,349.36 points to close at 370,515.63, the JSE Main Index gaining 1,175.40 points to settle at 331,393.01, while the Junior Market rose 5.72 points to close at 3,698.91 and the JSE USD Market Index rose 9.57 points to end at 219.91.
In the preference section of the Main Market that is not reflected in the TOP10 graphs, JPS 7 percent dropped $14.30 to $69.70.
At the close, investors exchanged 18,066,552 shares in all three markets, compared with 85,549,341 units on Wednesday, with the value of trading on Thursday amounting to just $55.7, million down sharply from $1.73 billion on the previous trading day. Trading on the JSE USD market resulted in investors exchanging 694,591 shares for US$29,863, down from 303,705 units at US$35,767 on Wednesday.
 The market’s PE ratio ended at 18.7 on 2021-22 earnings and 12.1 times those for 2022-23 at the close of trading.
Investors need pertinent information to successfully navigate numerous investment options in the local stock market. The ICInsider.com PE ratio chart and the more detailed daily report charts provide investors with regularly updated information to help decision-making.
Investors should use the chart to help make rational decisions when investing in stocks close to the average for the sector and not going too far from it unless there are compelling reasons to do so. This approach helps to remove emotions from investment decisions and put in on fundamentals while at the same time not being too far from the majority of investors. Investors who buy when the price of a stock is close to the average will find that they are not inclined to overpay for a stock.
The ICInsider.com PE Ratio chart covers all ordinary shares on the Jamaica Stock Exchange and shows companies grouped on an industry basis, allowing easy comparisons between the same sector companies and the overall market.
The net asset value of each company is reported as a guide to assess the value of stocks based on this measure quickly. The chart also shows daily changes in stock prices and the percentage year to date price movement based on the last traded prices.
 Dividends payable and yields for each company are shown in the Main and Junior Markets’ daily report charts that also show the closing volume pertaining to the bids and offers for each company.
The EPS & PE ratios are based on 2021 and 2022 actual or projected earnings, excluding major one off items. The PE Ratio is the most popular measure used to determine the value of stocks.


