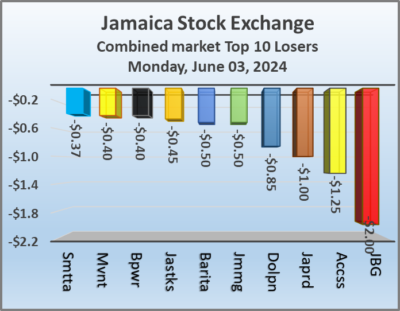
All three markets pulled back at the start of June on a negative note following a big jump to close out May on the Jamaica Stock Exchange that declined at the close of trading on Monday and ended with the number of stocks and the value changing hands falling well below trading on the previous trading day, resulting in prices of 30 shares rising and 44 declining.
 At the close of the market, the JSE Combined Market Index declined 1,439.06 points to 334,355.64, the All Jamaican Composite Index shed 859.63 points to end at 360,164.37, the JSE Main Index lost 983.38 points to end at 321,414.32. The Junior Market Index dived 71.22 points to finish at 3,765.28 and the JSE USD Market Index declined 8.50 points to cease trading at 230.85.
At the close of trading, 17,841,602 shares were exchanged in all three markets, down from 39,310,528 units on Friday, with the value of stocks traded on the Junior and Main markets amounted to $83.02 million, well below the $175.75 million on the previous trading day and the JSE USD market closed with an exchange of 110,971 shares for US$24,393 compared to 267,704 units at US$11,973 on Friday.
In Main Market activity, Transjamaican Highway led trading with 4.72 million shares followed by Wigton Windfarm with 2.36 million stock units, Sagicor Real Estate Fund with 1.92 million units and JMMB 9.5% preference share with 1.18 million units.
In the Junior Market, Limners and Bards led trading with 1.06 million shares followed by Dolla Financial with 867,867 units and Caribbean Assurance Brokers with 494,204 stocks.
 In the preference segment, Eppley 7.75% preference share popped $1.50 to $20, Jamaica Public Service 7% shed $7.20 to close at $40.79 and 138 Student Living preference share climbed $5 and ended at $190.
The market’s PE ratio, the most popular measure used to determine the value of stocks, ended at 21.4 on 2023-24 earnings and 13.5 times those for 2024-25 at the close of trading. ICInsider.com PE ratio chart and the more detailed daily charts provide investors with regularly updated information to help decision-making.
The PE ratio chart covers all ordinary shares on the Jamaica Stock Exchange, grouped by industry, allowing for easy comparisons within a sector and the overall market. The EPS & PE ratios are based on 2023 and 2024 actual or projected earnings, excluding major one off items.
Pertinent information is required to navigate numerous investment options successfully in the stock market. The ICInsider.com PE ratio chart and the more detailed daily report charts provide investors with regularly updated information to help decision-making.
The chart should be used in making rational decisions when investing in stocks close to the average for the sector, not going too far from it unless there are compelling reasons to do so. This approach helps to remove emotions from investment decisions and place them on fundamentals while at the same time not being too far from the majority of investors. Investors who buy when the price of a stock is close to the average will find that they are not inclined to overpay for a stock.
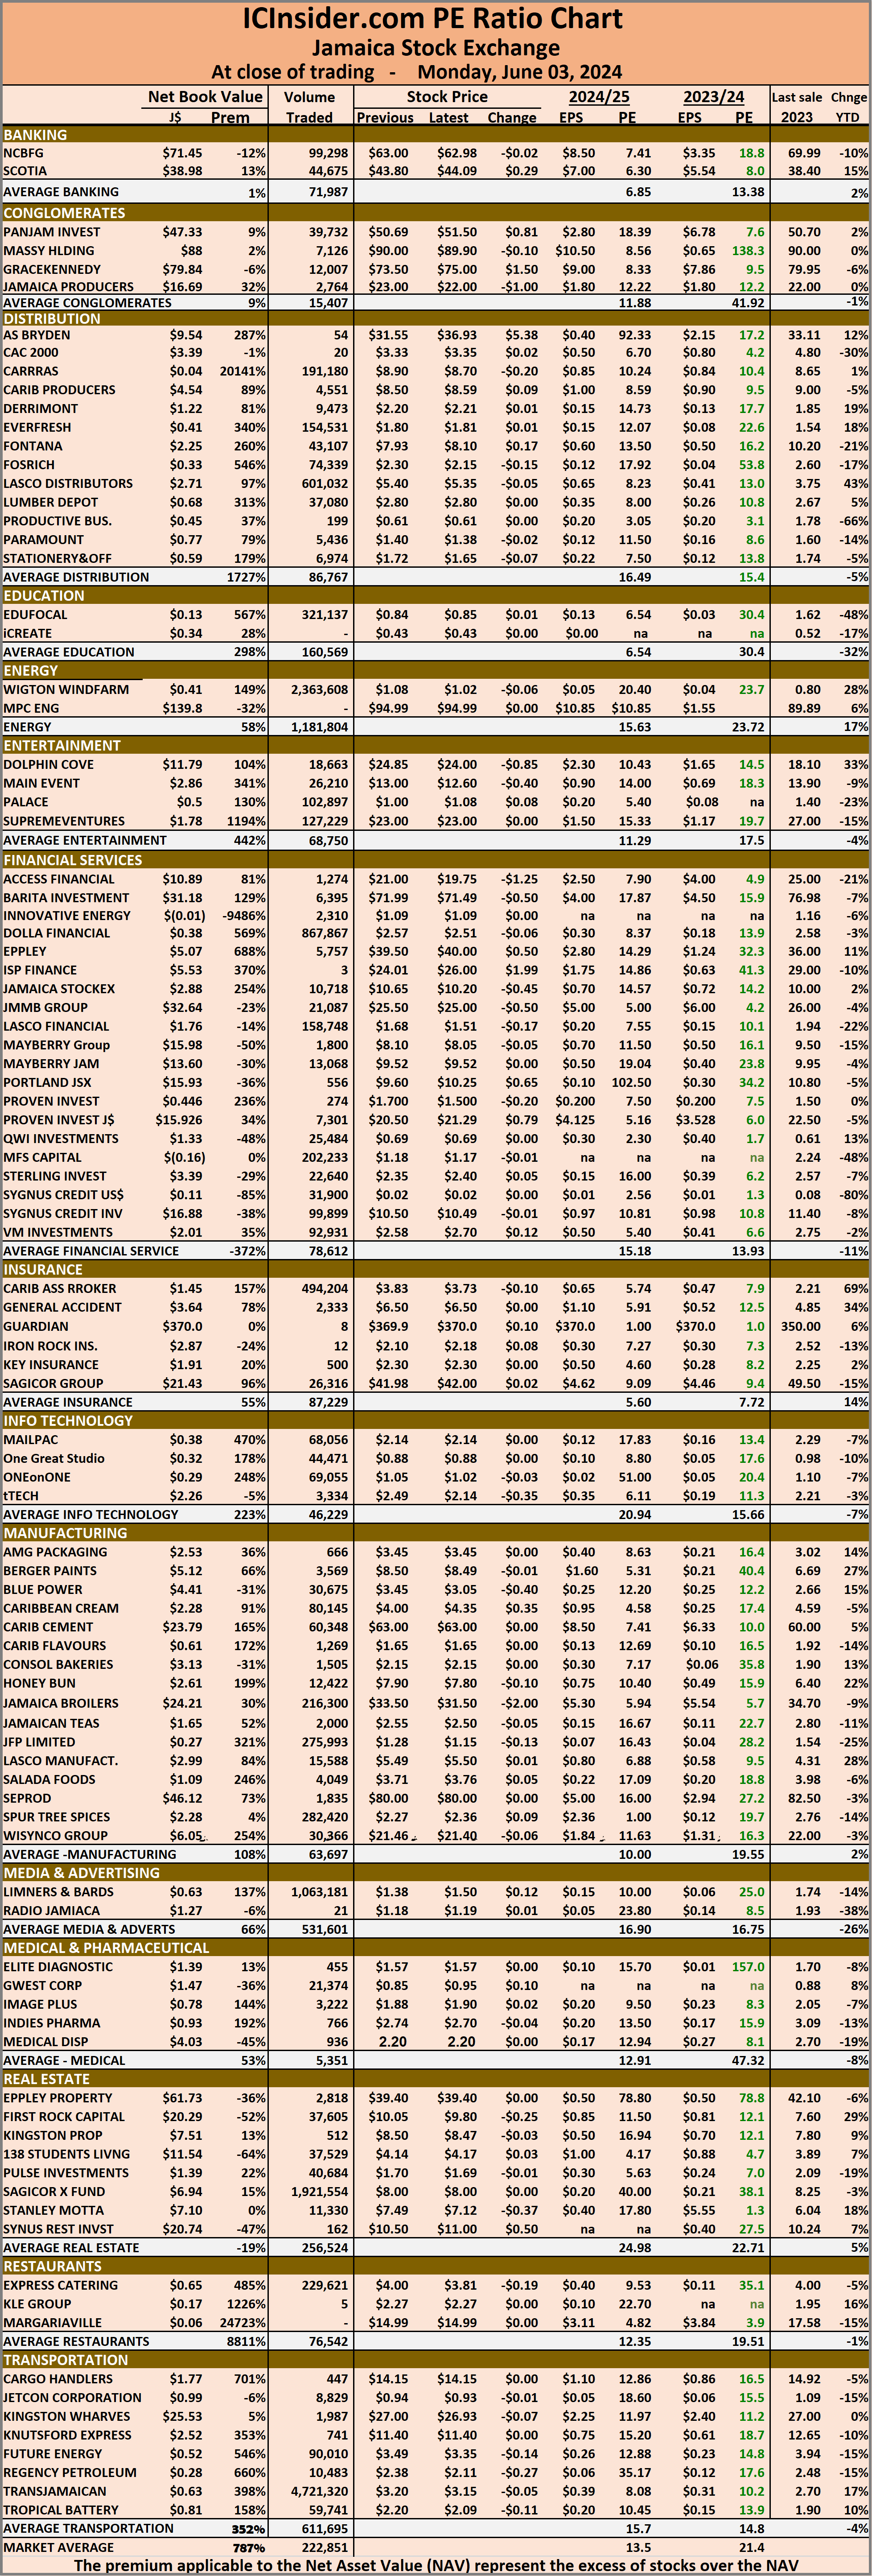 The net asset value of each company is reported as a guide for investors to quickly assess the value of stocks based on this measure. The chart also shows daily changes in stock prices and the percentage year to date price movement based on the last traded prices.
Dividends paid or payable and yields for each company are shown in the Main and Junior Markets’ daily report charts, along with the closing volume of the highest bid and the lowest offer for each company.
All JSE markets fall to start the month
June 3, 2024 by IC Insider.com
Filed Under: Feature Stories, JSE Combined, Stock Market Tagged With: 138 Student Living, Caribbean Cement, Daily Trading, Emerging market, Eppley, Jamaica Producers, Jamaica Stock Exchange, Jamaica Stock Exchange Combined Index, Jamaican stocks, JPS, JSE Main Index, junior market, Junior Market index, NCB Financial, Net asset Value of Jamaican stocks, Pan Jam, PE Ratio of Jamaican stocks, Productive Business Solutions, Scotia Group, Seprod, Trading Activity, Transjamaican Highway, Wigton Windfarm
About IC Insider.com