Trading picked up on the Jamaica Stock Exchange on Wednesday but the rise was confined to the Main market trading with Wisynco Group contributing 3.07 million shares valued at $61.3 million and JMMB Group 7.5% preference shares with 2.49 million units with a value of $25 million, Transjamaican Highway with 2.43 million units valued $6.3 million and Scotia Group 822,622 shares valued $28.3 million as investors lined up ahead of the full year results and final dividend declaration for the year due out on Friday.
 At the close of the market, the JSE Combined Market Index tumbled by 2,952.13 points to close at 322,378.34, while the All Jamaican Composite Index sank 3,179.90 points to end at 344,394.76, the JSE Main Index dived 3,034.26 points to wrap up trading at 309,071.45. The Junior Market Index lost 12.14 points to finish at 3,713.03 and the JSE USD Market Index rose 4.74 points to end at 231.03.
Investors traded 14,894,359 shares, in all three markets, up from 13,928,517 units on Wednesday. The value of stocks traded on the Junior and Main markets amounts to $144.79 million versus $62.87 million on Wednesday. The JSE USD market closed after 134,274 shares were traded, for US$39,564 compared to 228,802 units at US$5,310 on Wednesday.
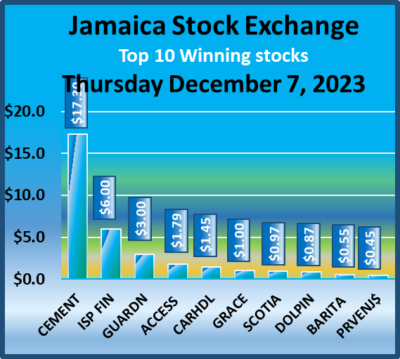
In the preference segment, 138 Student Living preference share surged $24.07 to close at $114.
 The market’s PE ratio, the most popular measure used to determine the value of stocks, ended at 21.5 on 2022-23 earnings and 13.8 times those for 2023-24 at the close of trading. ICInsider.com PE ratio chart and the more detailed daily charts provide investors with regularly updated information to help decision-making.
The PE ratio chart covers all ordinary shares on the Jamaica Stock Exchange, grouped by industry, allowing for easy comparisons between the same sector companies and the overall market. The EPS & PE ratios are based on 2023 and 2024 actual or projected earnings, excluding major one off items.
Investors need pertinent information to successfully navigate numerous investment options in the local stock market. The ICInsider.com PE ratio chart and the more detailed daily report charts provide investors with regularly updated information to help decision-making.
Investors should use the chart to help make rational decisions when investing in stocks close to the average for the sector and not going too far from it unless there are compelling reasons to do so. This approach helps to remove emotions from investment decisions and place them on fundamentals while at the same time not being too far from the majority of investors. Investors who buy when the price of a stock is close to the average will find that they are not inclined to overpay for a stock.
The net asset value of each company is reported as a guide to quickly assess the value of stocks based on this measure. The chart also shows daily changes in stock prices and the percentage year to date price movement based on the last traded prices.
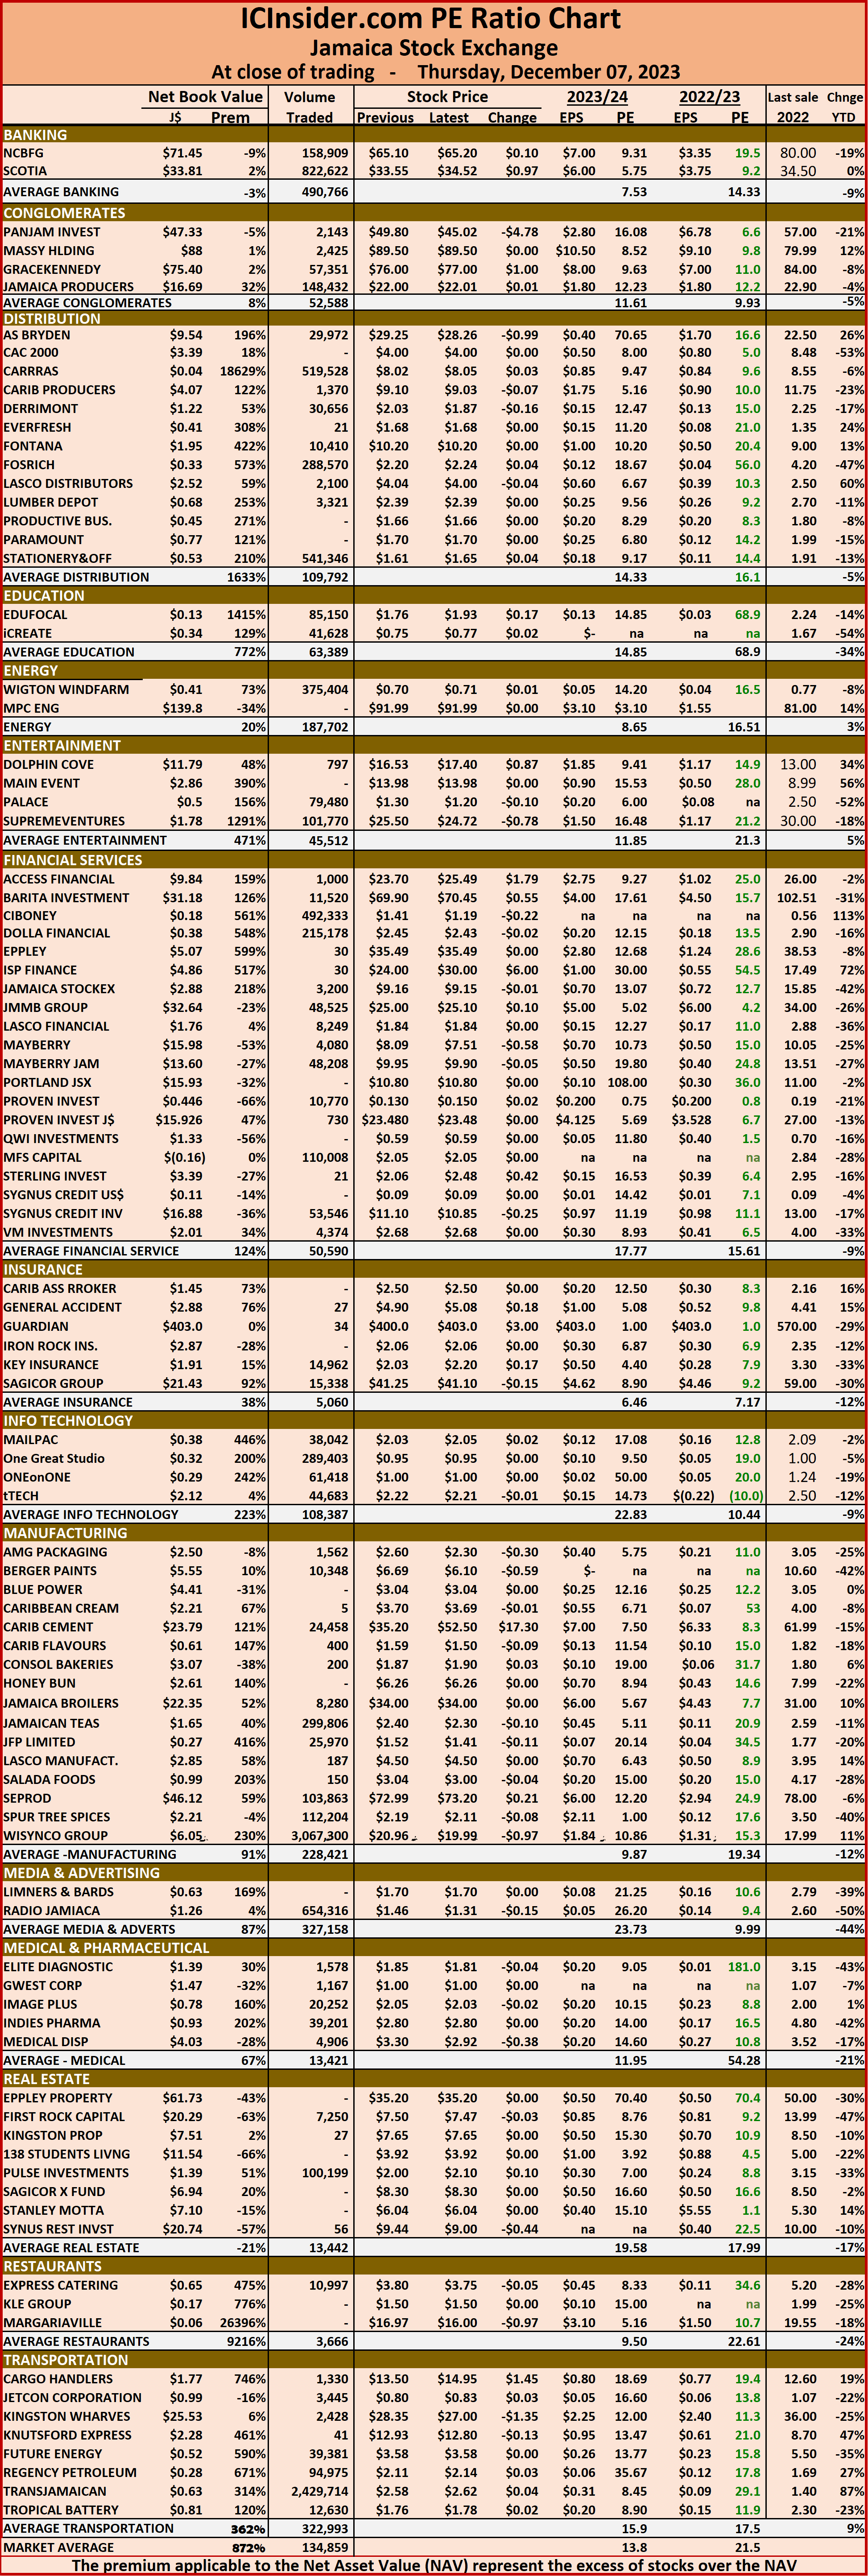 Dividends paid or payable and yields for each company are shown in the Main and Junior Markets’ daily report charts, along with the closing volume pertaining to the highest bid and the lowest offer for each company.
Slippage for Main & Junior Markets as trading jumps
December 7, 2023 by IC Insider.com
Filed Under: Feature Stories, JSE Combined, Stock Market Tagged With: 138 Student Living, Daily Trading, Emerging market, Jamaica Stock Exchange, Jamaica Stock Exchange Combined Index, Jamaican stocks, JSE Main Index, junior market, Junior Market index, Net asset Value of Jamaican stocks, PE Ratio of Jamaican stocks, Trading Activity
About IC Insider.com


