General Accident migrated from the Junior Market to the JSE Main Market on Friday with little or no interest from investors resulting in just 100 units trading with only two bids and one offer on the board on a day when the Junior Market climbed more than 110 points with more than 40 points being added minutes before the close to crossover the 3,900 points mark and the Jamaica Stock Exchange Main Market ended with robust gains but the JSE USD Index declined to close out the week on a day of rising volume and funds passing through the market.
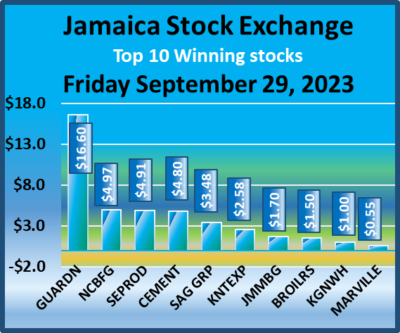 At close, the JSE Combined Market Index blasted 7,270.85 points higher to 341,388.96, the All Jamaican Composite Index jumped 5,002.74 points to close at 355,792.10, the JSE Main Index surged 6,694.66 points to 327,042.43, the Junior Market Index surged 112.67 points to conclude trading at 3,959.34, after Fosrich and Fesco jumped sharply in price and the JSE USD Market Index shed 3.91 points to settle at 253.83.
At the close, investors traded 50,931,729 shares in all three markets, up sharply from 23,642,772 stock units on Thursday. The value of stocks traded on the Junior and Main markets amounted to $256.86 million, from $94.79 million on Thursday. Trading on the JSE USD market ended with investors exchanging 2,780,944 shares for US$60,312 compared with 1,133,465 units at US$157,008, on Thursday.
 In the preference segment, Jamaica Public Service 7% popped $6.40 and ended at $48.40.
The market’s PE ratio, the most popular measure used to determine the value of stocks ended at 20.5 on 2022-23 earnings and 11.4 times those for 2023-24 at the close of trading. ICInsider.com PE ratio chart and the more detailed daily report charts provide investors with regularly updated information to help decision-making.
The PE ratio chart covers all ordinary shares on the Jamaica Stock Exchange, grouped by industry, allowing for easy comparisons between the same sector companies and the overall market. The EPS & PE ratios are based on 2023 and 2024 actual or projected earnings, excluding major one off items.
Investors need pertinent information to successfully navigate numerous investment options in the local stock market. The ICInsider.com PE ratio chart and the more detailed daily report charts provide investors with regularly updated information to help decision-making.
Investors should use the chart to help make rational decisions when investing in stocks close to the average for the sector and not going too far from it unless there are compelling reasons to do so. This approach helps to remove emotions from investment decisions and place them on fundamentals while at the same time not being too far from the majority of investors. 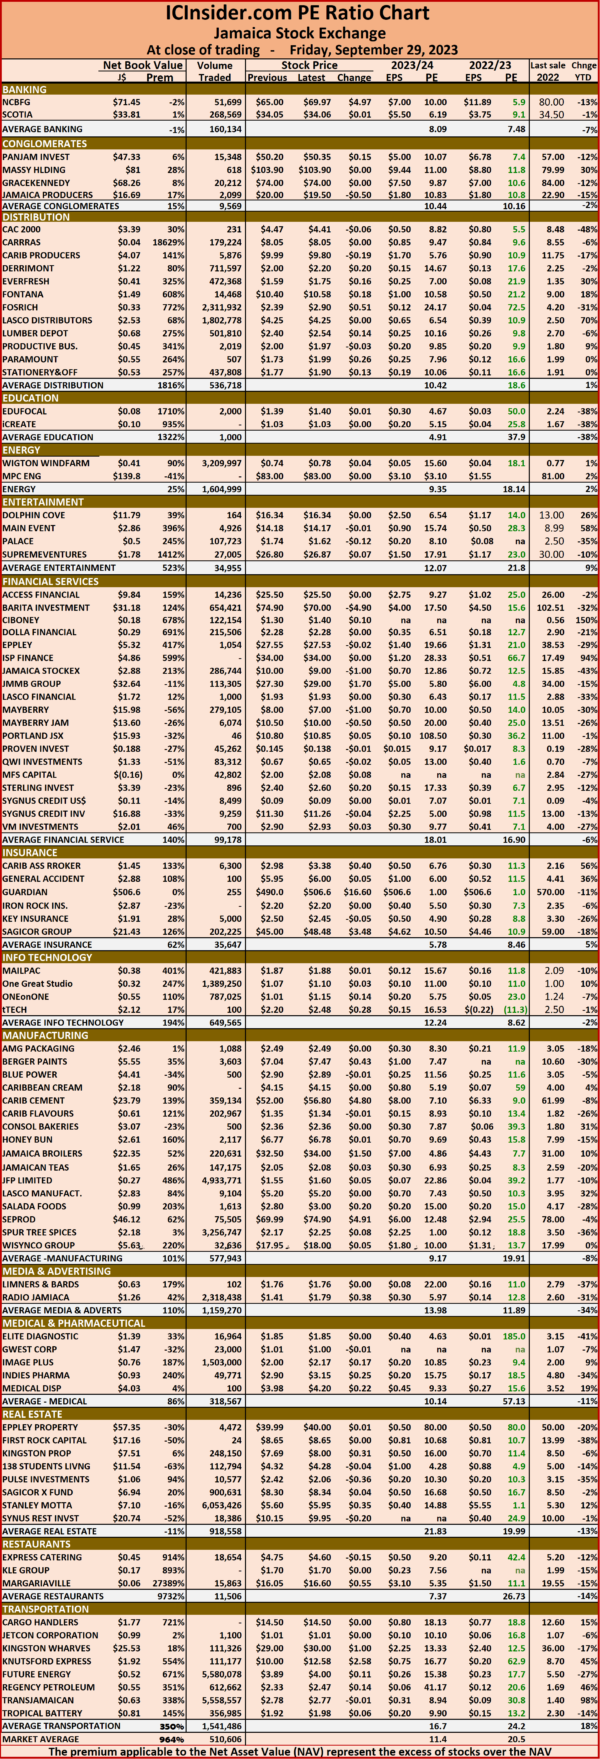 Investors who buy when the price of a stock is close to the average will find that they are not inclined to overpay for a stock.
The net asset value of each company is reported as a guide to assess the value of stocks based on this measure quickly. The chart also shows daily changes in stock prices and the percentage year to date price movement based on the last traded prices.
Dividends paid or payable and yields for each company are shown in the Main and Junior Markets’ daily report charts along with the closing volume pertaining to the highest bid and the lowest offer for each company.
Sharp rally for Jamaican stocks
September 29, 2023 by IC Insider.com
Filed Under: Feature Stories, JSE Combined, Stock Market Tagged With: Daily Trading, Emerging market, Jamaica Stock Exchange, Jamaica Stock Exchange Combined Index, Jamaican stocks, JPS, JSE Main Index, junior market, Junior Market index, Net asset Value of Jamaican stocks, PE Ratio of Jamaican stocks, Trading Activity
About IC Insider.com


