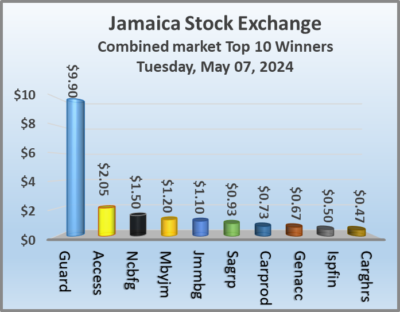
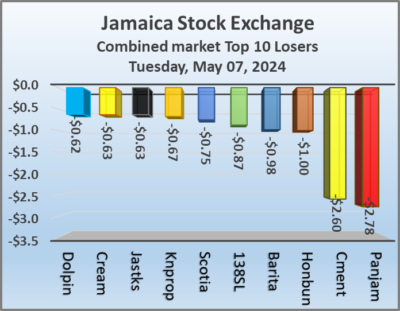
Rising stocks just edged out those declining on the Jamaica Stock Exchange on Tuesday and resulted in a decline in all markets at the close and ended with the number and the value of stocks traded climbing over trading on the previous day, with Caribbean Assurance Brokers being the market leader with 9 million units, with trading ending with prices of 41 shares rising and 37 declining.
 At the end of trading on Tuesday, the JSE Combined Market Index shed 1,210.14 points to 332,553.00, the All Jamaican Composite Index sank 1,855.81 points to 356,728.41. The JSE Main Index dropped 1,104.98 points to close trading at 319,557.13. The Junior Market Index fell 21.65 points to settle at 3,762.08 and the JSE USD Market Index skidded 0.58 points to 235.79.
At the close of trading, 22,556,104 shares were exchanged in all three markets, up from 14,070,427 units on Monday, with the value of stocks traded on the Junior and Main markets amounted to $105.36 million, compared to $94.57 million on the previous trading day and the JSE USD market closed with an exchange of 111,519 shares for US$25,798 compared to 492,062 units at US$57,344 on Monday.
In Main Market activity, Wigton Windfarm led trading with 2.65 million shares followed by Transjamaican Highway with 1.19 million stocks and QWI Investments with 1.03 million units.
In Junior Market trading, Caribbean Assurance Brokers led trading with 9.03 million shares followed by MFS Capital Partners with 1.96 million stock units and Spur Tree Spices with 960,813 units.
In the preference segment, Jamaica Public Service 7% fell 93 cents to $48 and Sygnus Credit Investments C10.5% dropped $1 to finish at $109.
 The market’s PE ratio, the most popular measure used to determine the value of stocks, ended at 22 on 2023-24 earnings and 13.3. times those for 2024-25 at the close of trading. ICInsider.com PE ratio chart and the more detailed daily charts provide investors with regularly updated information to help decision-making.
The PE ratio chart covers all ordinary shares on the Jamaica Stock Exchange, grouped by industry, allowing for easy comparisons within a sector and the overall market. The EPS & PE ratios are based on 2023 and 2024 actual or projected earnings, excluding major one off items.
Pertinent information is required to navigate numerous investment options successfully in the stock market. The ICInsider.com PE ratio chart and the more detailed daily report charts provide investors with regularly updated information to help decision-making.
The chart should be used in making rational decisions when investing in stocks close to the average for the sector, not going too far from it unless there are compelling reasons to do so. This approach helps to remove emotions from investment decisions and place them on fundamentals while at the same time not being too far from the majority of investors.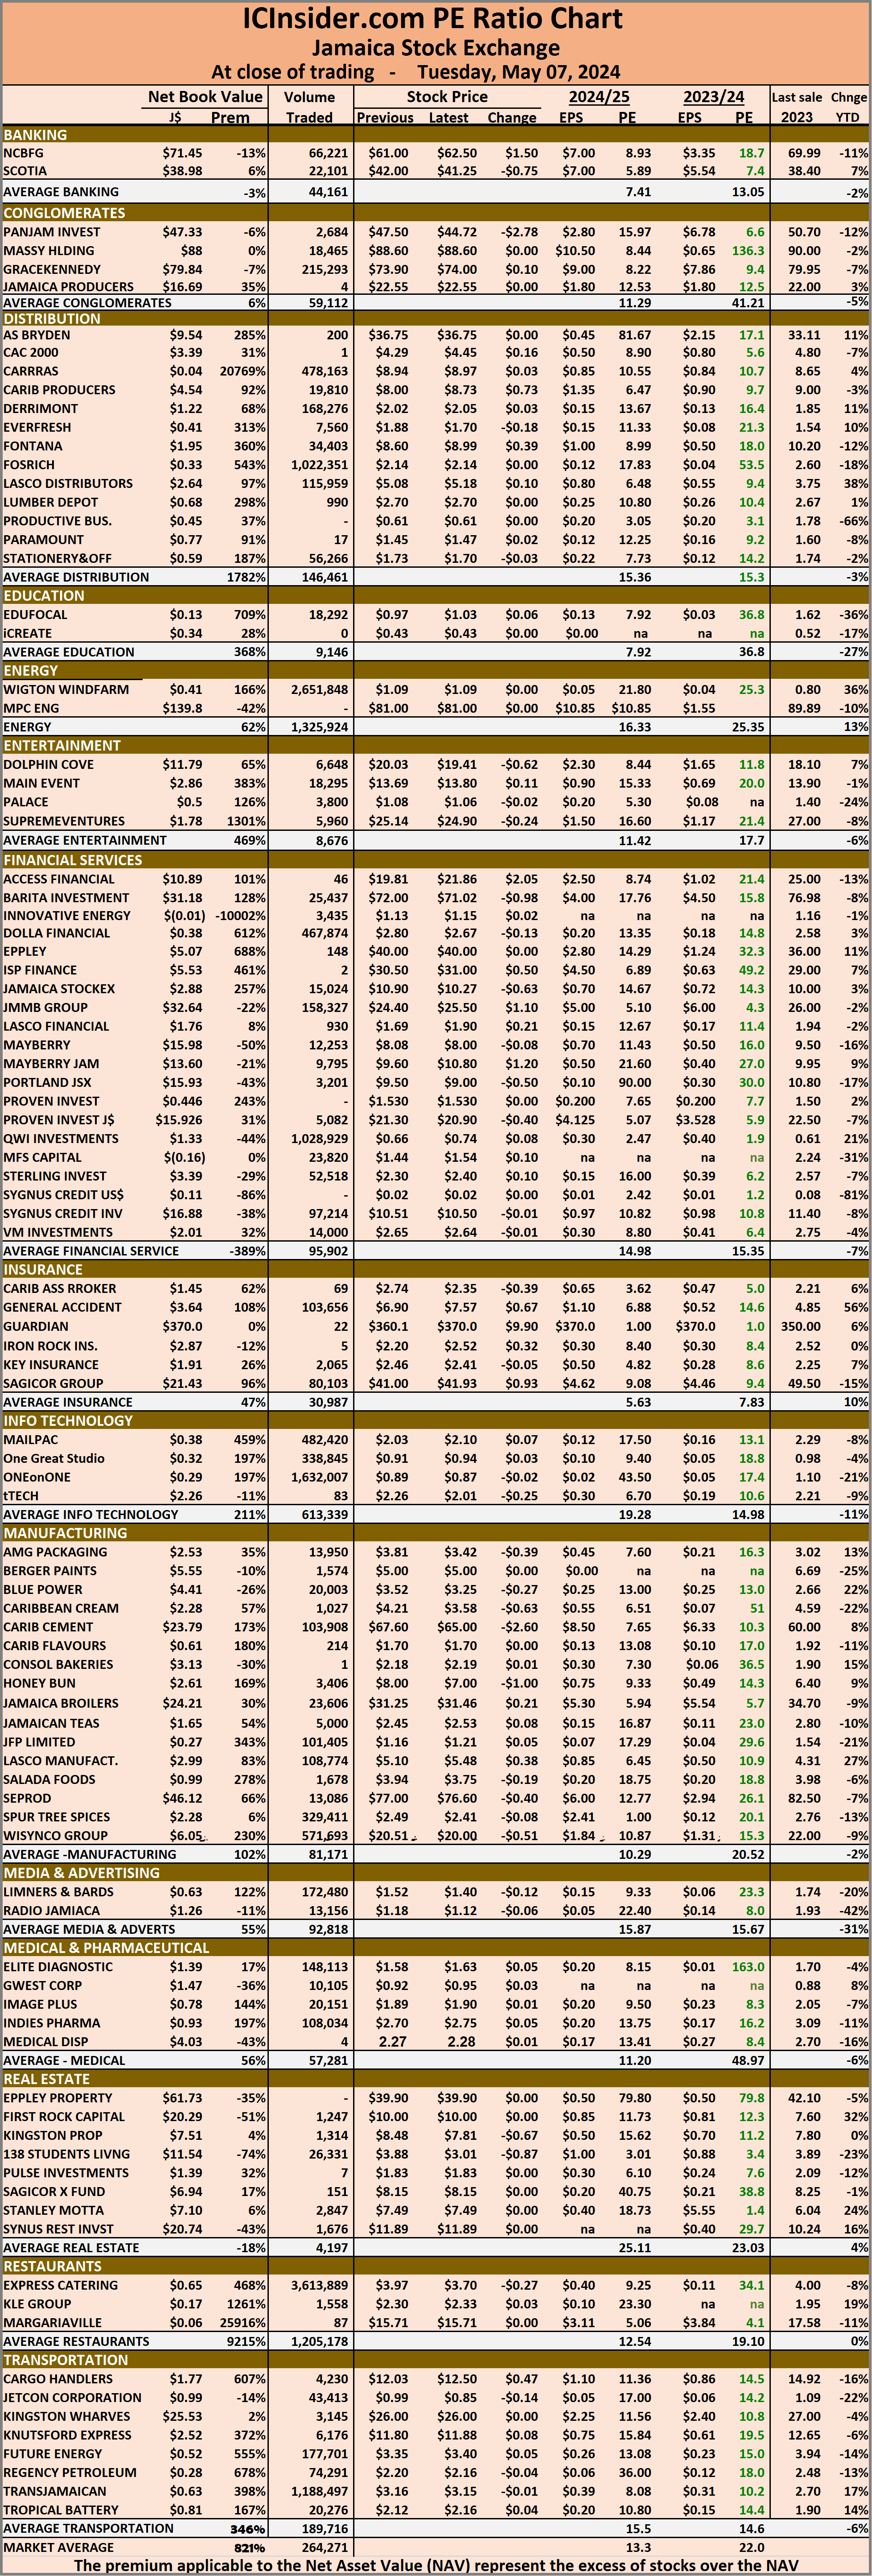 Investors who buy when the price of a stock is close to the average will find that they are not inclined to overpay for a stock.
The net asset value of each company is reported as a guide for investors to quickly assess the value of stocks based on this measure. The chart also shows daily changes in stock prices and the percentage year to date price movement based on the last traded prices.
Dividends paid or payable and yields for each company are shown in the Main and Junior Markets’ daily report charts, along with the closing volume of the highest bid and the lowest offer for each company.
Rising Jamaica Stock Exchange stocks edged out decliners
April 26, 2024 by IC Insider.com
Filed Under: Feature Stories, JSE Combined, Stock Market Tagged With: 138 Student Living, Caribbean Assurance Brokers, Daily Trading, Emerging market, Eppley, General Accident Insurance, Jamaica Stock Exchange, Jamaica Stock Exchange Combined Index, Jamaican stocks, JSE Main Index, junior market, Junior Market index, Net asset Value of Jamaican stocks, PE Ratio of Jamaican stocks, Productive Business Solutions, Trading Activity
About IC Insider.com


