 Junior Market stocks closed at yet another record closing high on Thursday after hitting an all-time intraday high of 4,098.08 shortly after the market opened and ended with a rise of 49.51 index points to 4,072.56, with the market up almost 19 percent for the year to date, with Future Energy hitting a new record of $7.19 with a PE of 72 and Derrimon Trading closing at $2.99 after posting a lower profit for 2021 than in 2020 and earnings per share of just 9.4 cents for a PE of 30.
Jamaica Stock Exchange Main Market stocks closed lower on Thursday, with the Combined Index falling 2192.36 points to 400241.78, the All Jamaican Composite Index diving 3,622.18 points to 440,922.44 and the JSE Main Index dropping 2,805.01 points to 388,891.73.
The market’s PE ratio ended at 18.5 based on 2021-22 earnings and 11.9 times those for 2022-23 at the close of market activity on the Jamaica Stock Exchange.
Investors need a series of measures and pertinent information to successfully navigate the many investment choices in the local stock market. The ICInsider.com PE ratio chart along with the more detailed daily report charts, provide investors with regularly updated information to help with decision making.
Investors should make use of the chart to help make rational investment decisions, by investing in stocks that are close to the average for the sector and not going too far from it, unless there are compelling reasons to do so. Investors who buy when the price of a stock is close to the average will find that they are not inclined to overpay for a stock. This approach helps to take emotions out of the investment decision and put in on fundamentals while at the same time not being too far from the majority of investors.
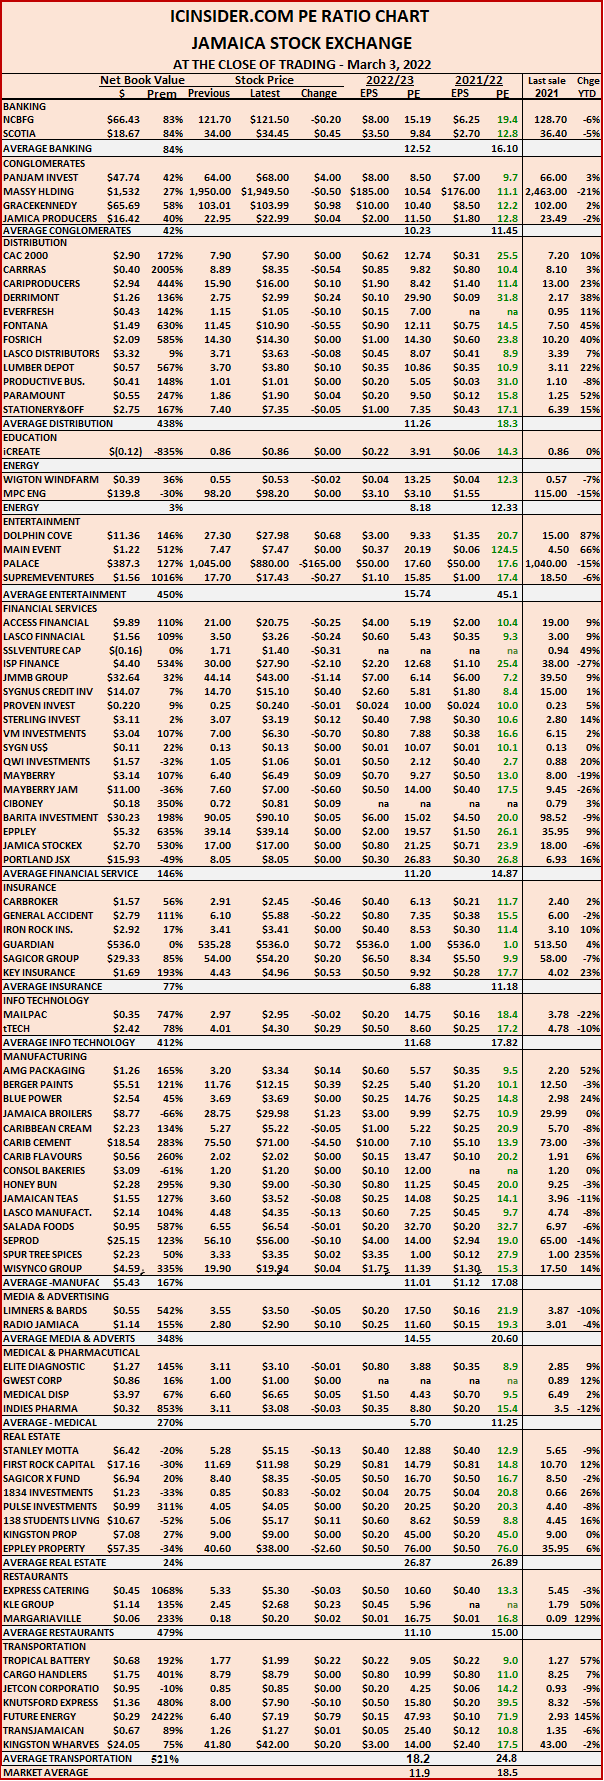 The ICInsider.com PE Ratio chart covers all ordinary shares listed on the Jamaica Stock Exchange and shows companies grouped on an industry basis, allowing for easy comparisons between same sector companies as well as the overall market.
The net asset value of each company is reported as a guide to easily assess the value of stocks based on this measure. The chart also shows daily changes in stock prices and the percentage year to date price movement based on the last traded prices. Dividends payable and yields for each company are shown in the Main and Junior Markets daily report charts that show closing volume for the bids and offers.
The EPS & PE ratios are based on 2021 and 2022 actual or projected earnings, excluding major one off items. The PE Ratio is the most popular measure used to determine the value of stocks.
Record close for Jamaica Stock Exchange Junior Market
March 3, 2022 by


