October month end decline breaks the usual end of month trend of rising prices and market indices as investors pushed the market down to close off the month, with only the US dollar market bucking the trend with a rise in the market index at the close, but the Junior Market declined the most having suffered a near 100 point cut after being down nearly 120 points shortly before the close. The Main Market was closing at its lowest level since April 2020 just above the lowest level of that year in March as the volume trading rose over Friday but at a lower value.
 The JSE Combined Index, a measure of the overall market dropped 1,433.43 points to close at 361,488.69. The All Jamaican Composite Index dipped 1,082.10 points to 397,208.39, the JSE Main Index declined 575.09 points to 347,650.98, the Junior Market Index lost 98.29 points to 4,051.71 and the JSE USD market Index popped 5.31 points to close at 211.74.
Trading ended, with 68,325,229 shares changing hands, for $157.7 million, down from $172.7 million, with 59,396,759 shares traded in all markets on the previous day. The JSE USD market ended with the value of stocks traded at US$25,574 from US$12,962 on Friday.
The market’s PE ratio ended at 23.8 based on 2021-22 earnings and 12.8 times those for 2022-23 at the close of trading.
Investors need pertinent information to successfully navigate many investment options in the local stock market. The ICInsider.com PE ratio chart and the more detailed daily report charts provide investors with regularly updated information to help decision-making.
Investors should use the chart to help make rational investment decisions by investing in stocks close to the average for the sector and not going too far from it unless there are compelling reasons to do so. This approach helps to remove emotions from investment decisions and put in on fundamentals while at the same time not being too far from the majority of investors. Investors who buy when the price of a stock is close to the average will find that they are not inclined to overpay for a stock.
The ICInsider.com PE Ratio chart covers all ordinary shares on the Jamaica Stock Exchange. It shows companies grouped on an industry basis, allowing easy comparisons between the same sector companies and the overall market.
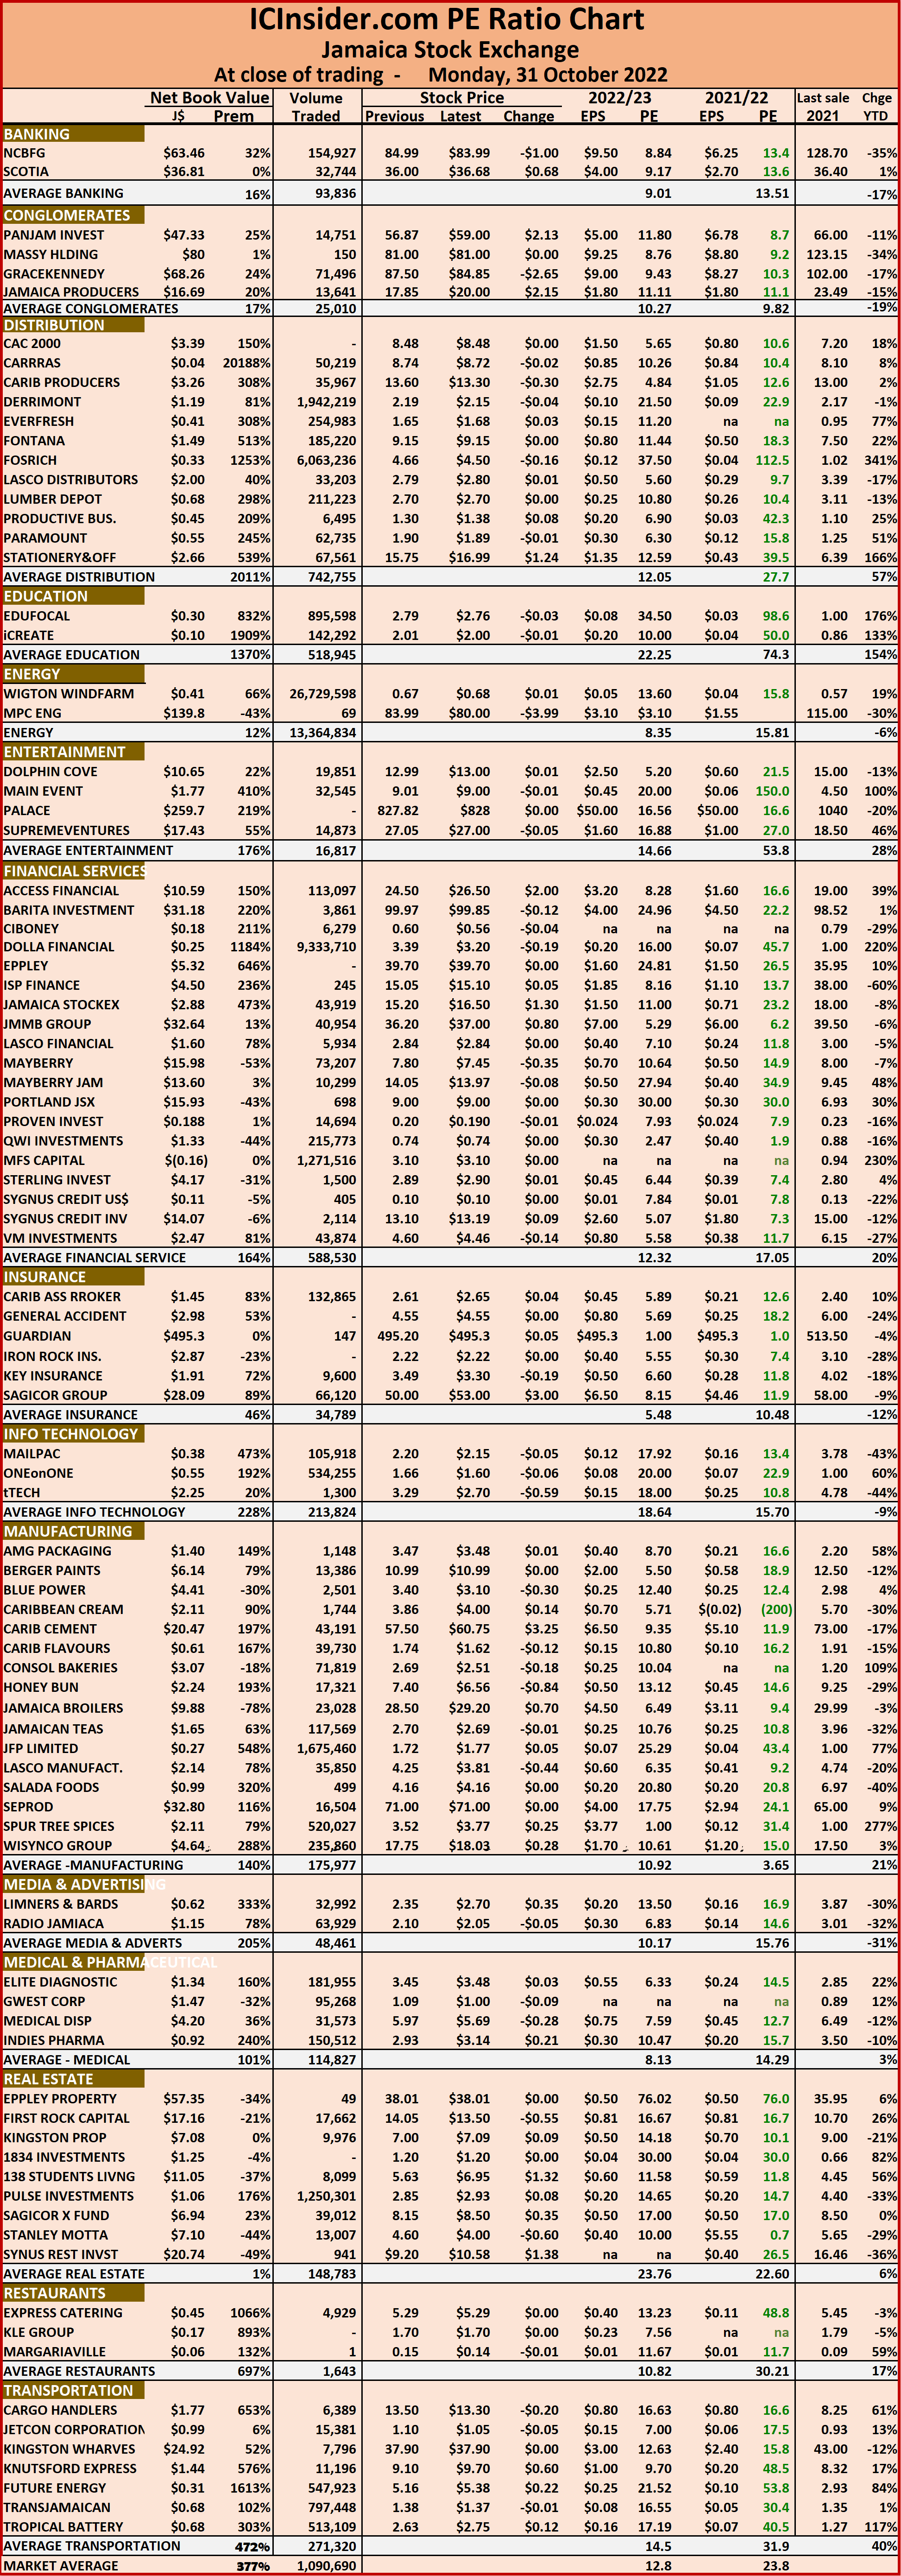 The net asset value of each company is reported as a guide to assess the value of stocks based on this measure quickly. The chart also shows daily changes in stock prices and the percentage year to date price movement based on the last traded prices. Dividends payable and yields for each company are shown in the Main and Junior Markets’ daily report charts that show the closing volume for the bids and offers.
The EPS & PE ratios are based on 2021 and 2022 actual or projected earnings, excluding major one off items. The PE Ratio is the most popular measure used to determine the value of stocks.
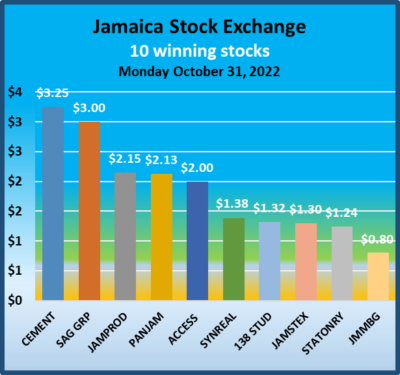
Leading JSE markets end October down
October 31, 2022 by


