The Main Market of the Jamaica Stock Exchange followed Junior Market trading on Wednesday, with a sharp fall on Thursday but the Junior Market made a partial recovery on Thursday while the US Dollar index dropped as trading activity fell with the volume and value of stocks trading fell sharply from Wednesday’s levels.
 At close, the JSE Combined Market Index dropped 3,987.82 points to end at 330,448.03, while the All Jamaican Composite Index dived 4,288.27 points to settle at 347,171.16, the JSE Main Index plunged 4,681.02 points to close trading at 316,267.74, the Junior Market Index rallied 43.90 points to finish at 3,863.19 and the JSE USD Market Index fell 5.33 points to 248.72.
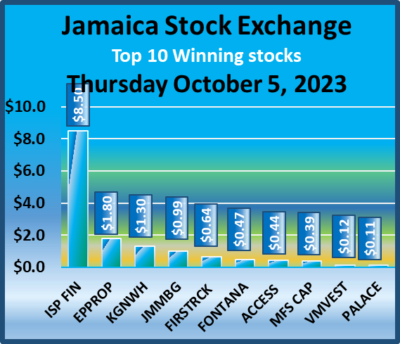
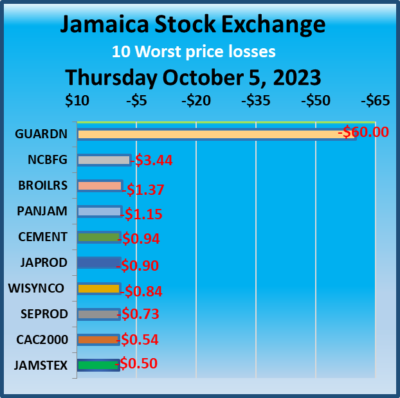
Overall, investors traded 15,326,745 shares in all three markets, down from 30,360,616 stock units on Wednesday. The value of stocks traded on the Junior and Main markets amounted to $70.27 million, up from $170.57 million on Wednesday. Trading on the JSE USD market ended with investors exchanging 526,142 stock units for US$16546 compared with 268,786 shares for US$4,988 on Wednesday.
In the preference segment, Jamaica Public Service 7% climbed $6.17 to $47.32 and 138 Student Living preference share shed $6.47 and ended at $113.85.
 The market’s PE ratio, the most popular measure used to determine the value of stocks, ended at 21.3 on 2022-23 earnings and 11.1 times those for 2023-24 at the close of trading. ICInsider.com PE ratio chart and the more detailed daily charts provide investors with regularly updated information to help decision-making.
The PE ratio chart covers all ordinary shares on the Jamaica Stock Exchange, grouped by industry, allowing for easy comparisons between the same sector companies and the overall market. The EPS & PE ratios are based on 2023 and 2024 actual or projected earnings, excluding major one off items.
Investors need pertinent information to successfully navigate numerous investment options in the local stock market. The ICInsider.com PE ratio chart and the more detailed daily report charts provide investors with regularly updated information to help decision-making.
Investors should use the chart to help make rational decisions when investing in stocks close to the average for the sector and not going too far from it unless there are compelling reasons to do so. This approach helps to remove emotions from investment decisions and place them on fundamentals while at the same time not being too far from the majority of investors. Investors who buy when the price of a stock is close to the average will find that they are not inclined to overpay for a stock.
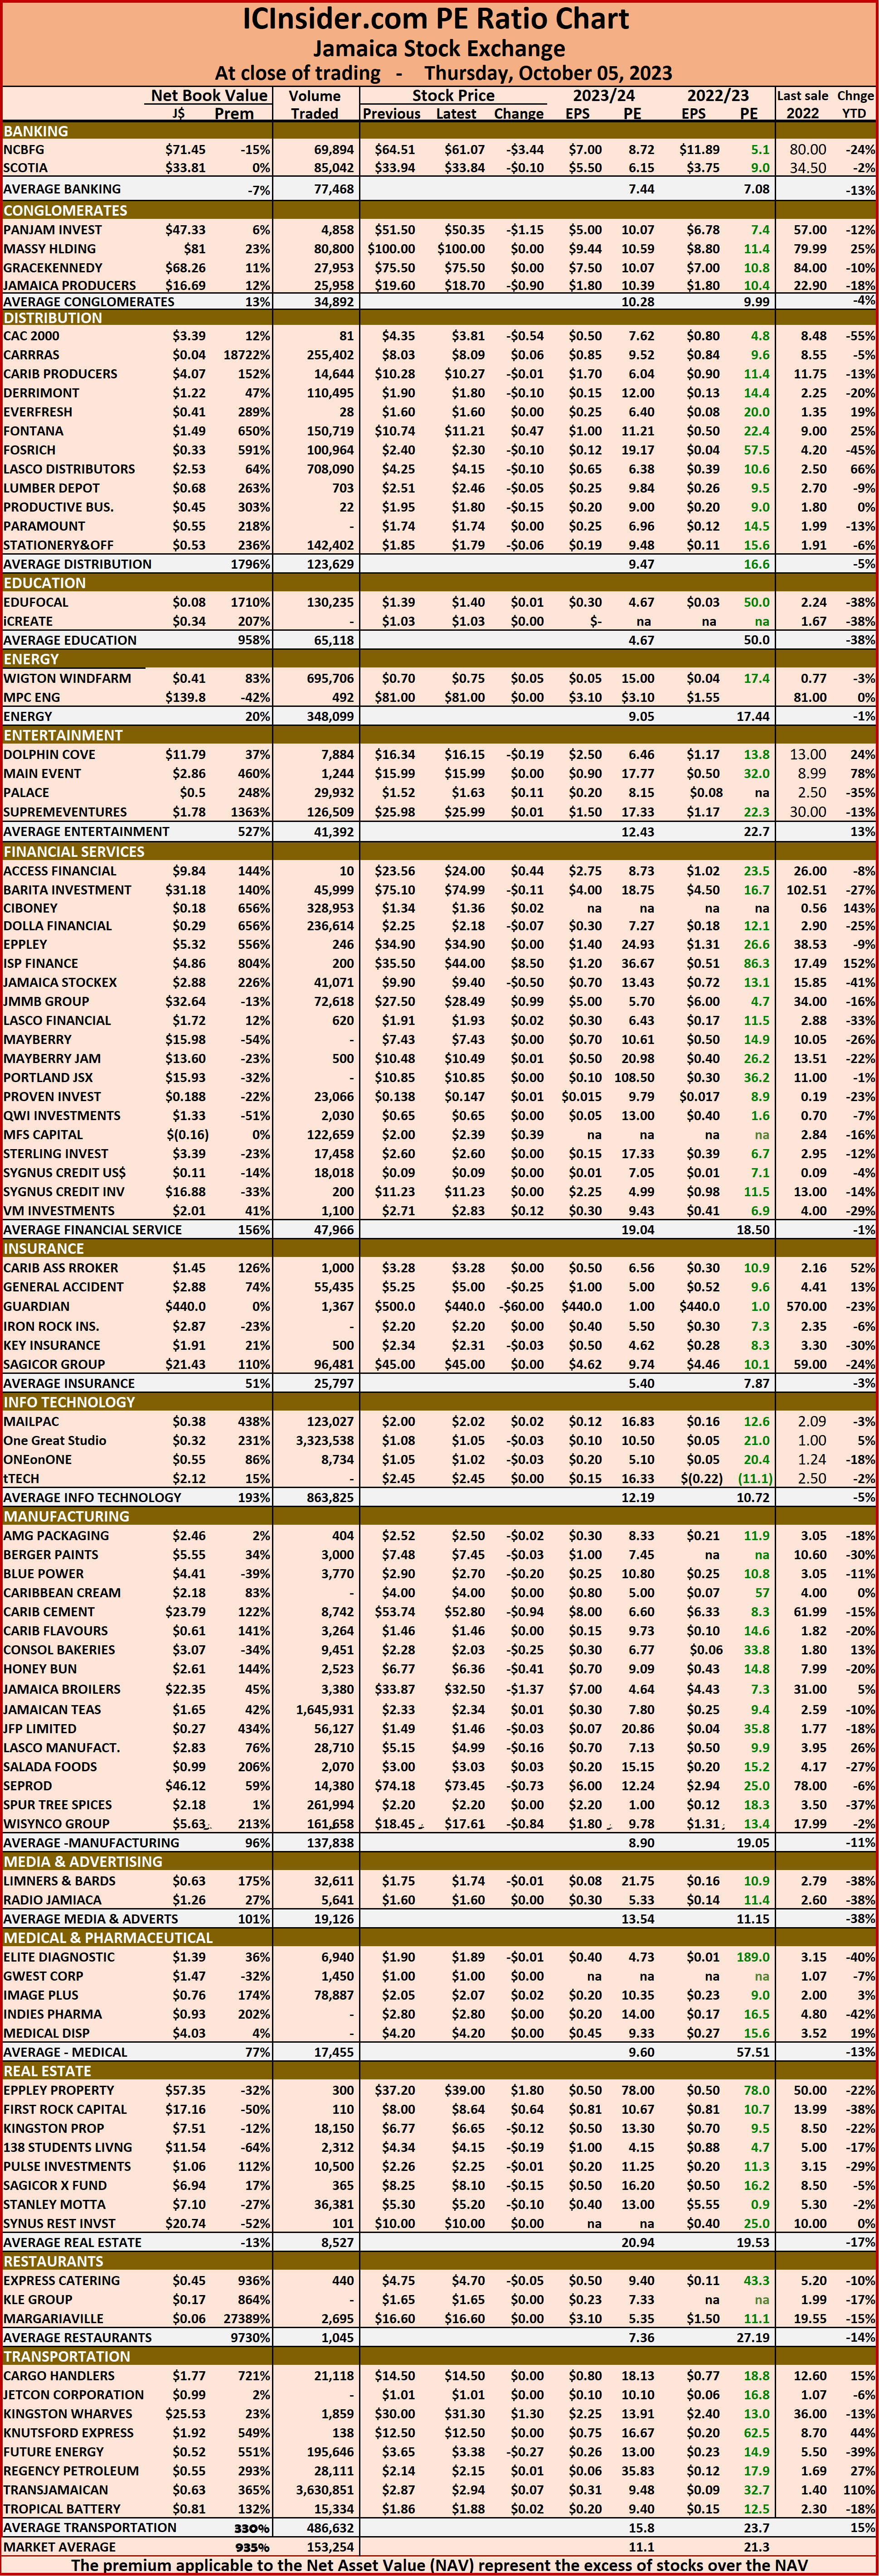 The net asset value of each company is reported as a guide to assess the value of stocks based on this measure quickly. The chart also shows daily changes in stock prices and the percentage year to date price movement based on the last traded prices.
Dividends paid or payable and yields for each company are shown in the Main and Junior Markets’ daily report charts along with the closing volume pertaining to the highest bid and the lowest offer for each company.
Juniors bounce JSE USD and Main markets drop
October 5, 2023 by IC Insider.com
Filed Under: Feature Stories, JSE Combined, Stock Market Tagged With: 138 Student Living, Daily Trading, Emerging market, Jamaica Stock Exchange, Jamaica Stock Exchange Combined Index, Jamaican stocks, JPS, JSE Main Index, junior market, Junior Market index, Net asset Value of Jamaican stocks, PE Ratio of Jamaican stocks, Trading Activity
About IC Insider.com


