The Main market and the USD markets of the Jamaica Stock Exchange eked out gains on Thursday while the Junior Market declined, with the volume of stocks changing hands exceeding those on Wednesday fueled by a rise in the traded value.
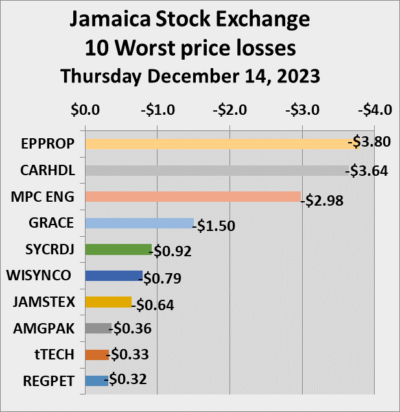
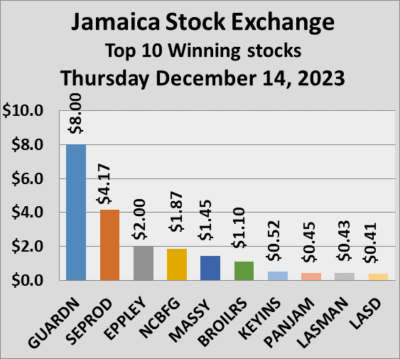 At the close of trading, Guardian Holdings led stocks rising with a gain of $8 followed by Seprod up $4.17, Eppley rose $2 $2.49, NCB Financial a $1.87 and Massy Holdings off $1.45 and Jamaica Broilers up by $1,10. Declining stocks saw Eppley Caribbean Property Fund falling $3.80 followed by MPC Caribbean Energy Fund with a fall of $3.64 and GraceKennedy down $1.50.
At the close of trading, the JSE Combined Market Index popped 524.07 points to close at 324,399.50, the All Jamaican Composite Index popped 5.10 points to wrap up trading at 346,487.62, the JSE Main Index advanced 755.51 points to end at 311,709.42. The Junior Market Index shed 21.06 points to close at 3,661.32 and the JSE USD Market Index inched 0.13 points higher to finish at 223.89.
Investors traded 22,170,439 shares, in all three markets, up from 11,954,522 units on Wednesday. The value of stocks traded on the Junior and Main markets amounts to a mere $63.54 million up from $48.78 million on Wednesday. The JSE USD market closed after 10,110 shares were traded, for US$968 compared to 730,855 units at US$13,102 on Wednesday.
 In the preference segment, 138 Student Living preference share fell $24 and ended at $90.
The market’s PE ratio, the most popular measure used to determine the value of stocks, ended at 21 on 2022-23 earnings and 13.6 times those for 2023-24 at the close of trading. ICInsider.com PE ratio chart and the more detailed daily charts provide investors with regularly updated information to help decision-making.
The PE ratio chart covers all ordinary shares on the Jamaica Stock Exchange, grouped by industry, allowing for easy comparisons between the same sector companies and the overall market. The EPS & PE ratios are based on 2023 and 2024 actual or projected earnings, excluding major one off items.
Investors need pertinent information to successfully navigate numerous investment options in the local stock market. The ICInsider.com PE ratio chart and the more detailed daily report charts provide investors with regularly updated information to help decision-making.
Investors should use the chart to help make rational decisions when investing in stocks close to the average for the sector and not going too far from it unless there are compelling reasons to do so. This approach helps to remove emotions from investment decisions and place them on fundamentals while at the same time not being too far from the majority of investors. Investors who buy when the price of a stock is close to the average will find that they are not inclined to overpay for a stock.
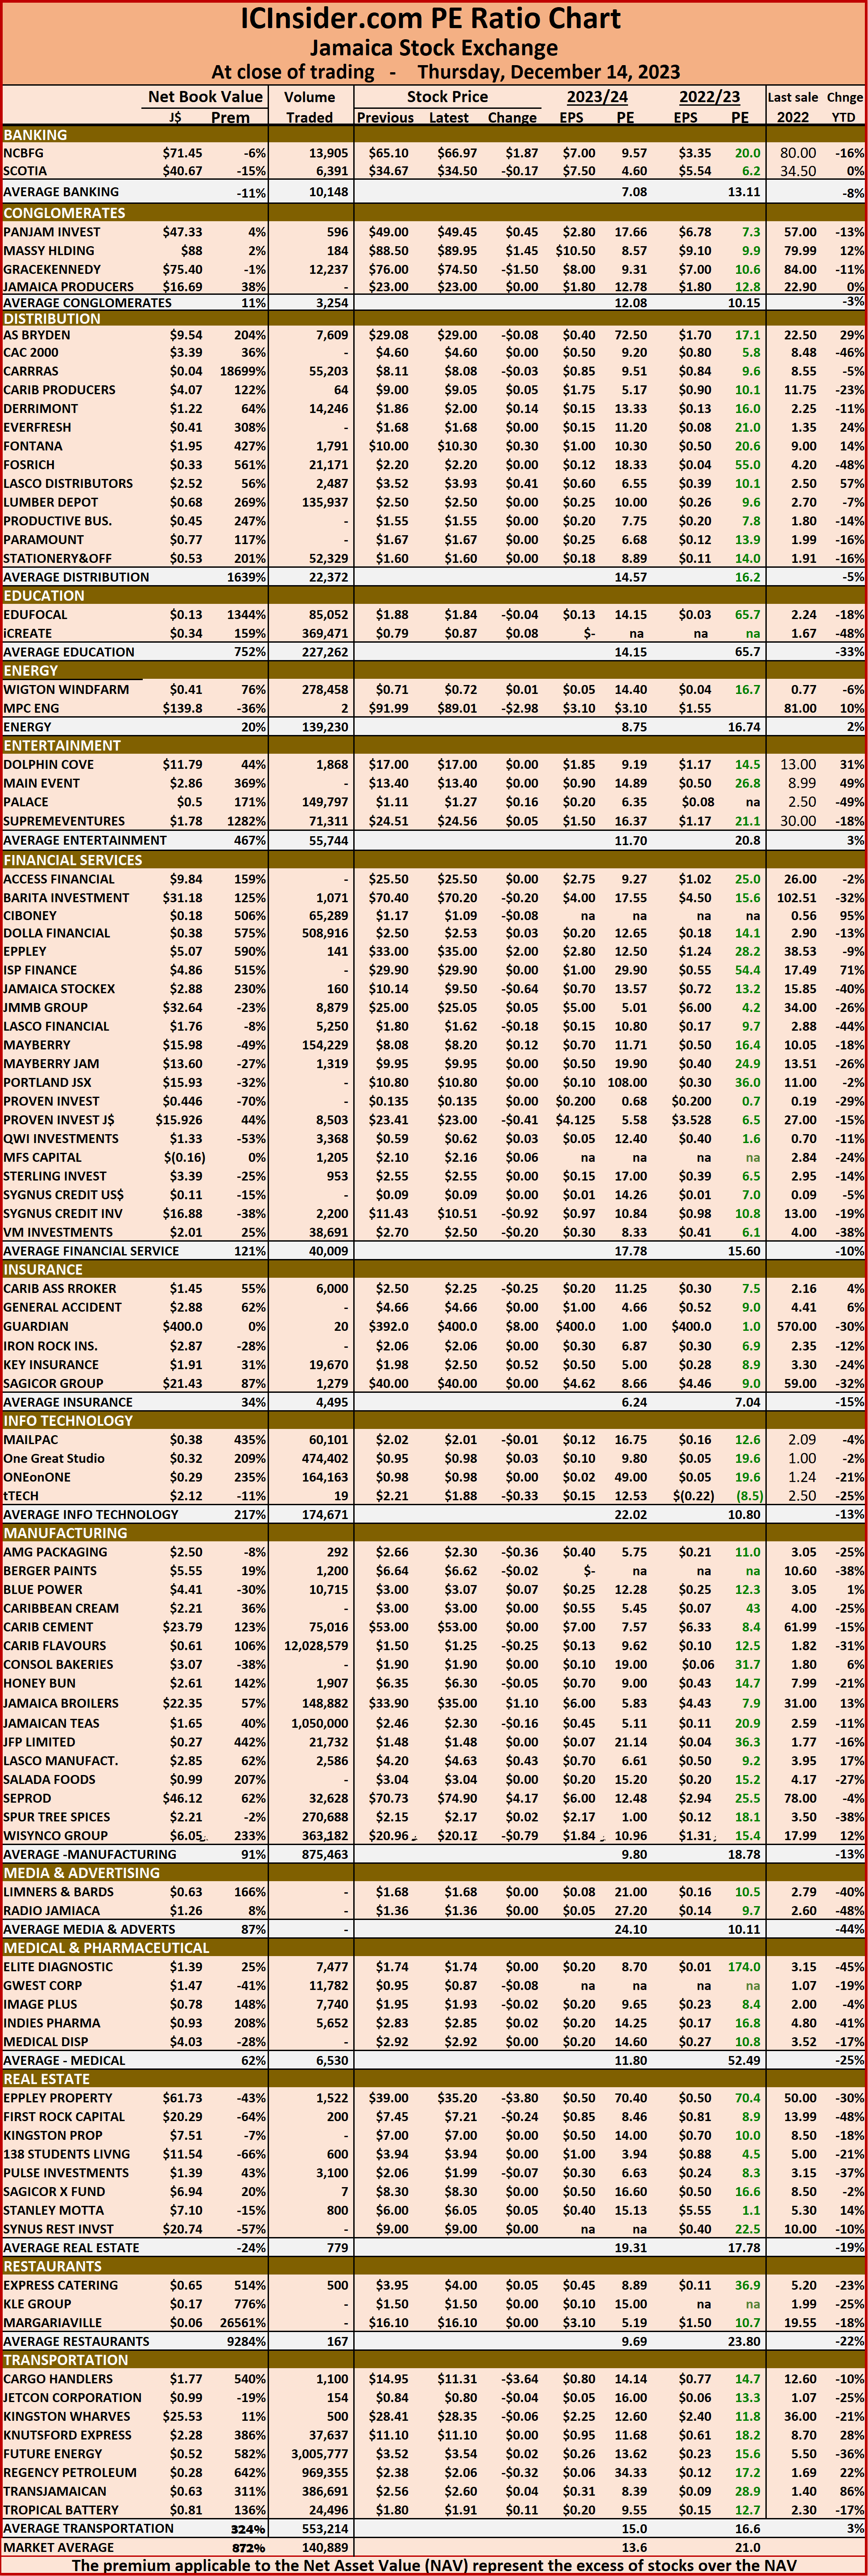 The net asset value of each company is reported as a guide to quickly assess the value of stocks based on this measure. The chart also shows daily changes in stock prices and the percentage year to date price movement based on the last traded prices.
Dividends paid or payable and yields for each company are shown in the Main and Junior Markets’ daily report charts, along with the closing volume pertaining to the highest bid and the lowest offer for each company.
JSE Markets marking time
December 14, 2023 by IC Insider.com
Filed Under: Feature Stories, JSE Combined, Stock Market Tagged With: 138 Student Living, Daily Trading, Emerging market, Eppley, Grace Kennedy, Guardian Holdings, Jamaica Broilers, Jamaica Stock Exchange, Jamaica Stock Exchange Combined Index, Jamaican stocks, JSE Main Index, junior market, Junior Market index, NCB Financial Group, Net asset Value of Jamaican stocks, PE Ratio of Jamaican stocks, Seprod, Trading Activity
About IC Insider.com


